
Figure 1.
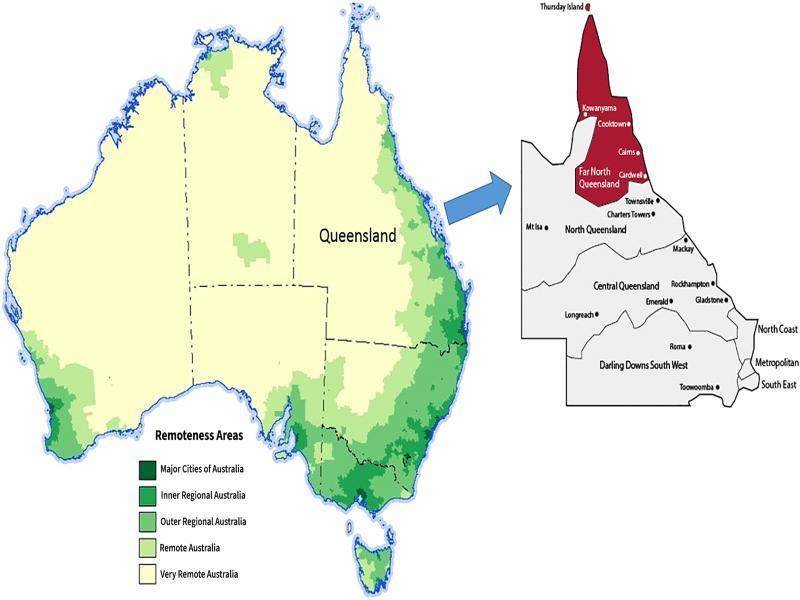
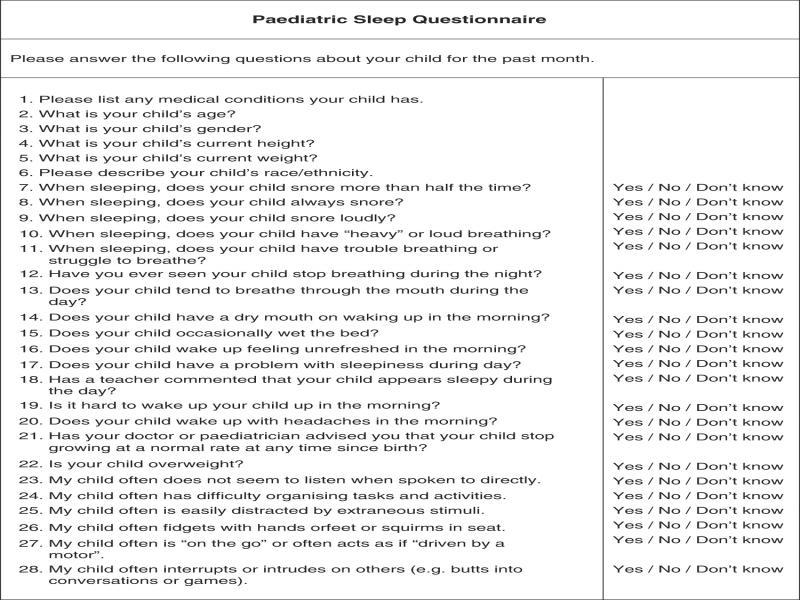
Figure 2.
Logistic regression coefficients_
| Predictors | Levels | OR (95% CI) | p - values |
|---|---|---|---|
| Gender | Female | REF | |
| Male | 2.44 (1.51–3.94) | 0.001 | |
| Age | 0.95 (0.90–1.02) | 0.097 | |
| BMI | Underweight | REF | |
| Normal | 1.19 (0.62–2.27) | 0.121 | |
| Overweight/obese | 4.77 (2.23–10.22) | <0.001 | |
| Race | Caucasian | REF | |
| Asian | 0.58 (0.25–1.36) | 0.234 | |
| Indigenous | 1.10 (0.33–3.65) | 0.449 | |
| Pacific Islander | 3.49 (0.72–16.89) | 0.118 | |
| Other | 0.37 (0.04–3.77) | 0.577 |
Association between BMI and risk category_
| BMI category | Low risk | High risk |
|---|---|---|
| Underweight | 26 (50%) | 25 (50%) |
| Normal | 88 (47%) | 98 (53%) |
| Overweight/obese | 21 (19%) | 88 (81%) |
Association between race and risk category_
| Race | Low Risk | High Risk |
|---|---|---|
| Caucasian | 119 (37.3%) | 200 (62.7%) |
| Asian | 15 (54%) | 13 (46%) |
| Indigenous | 6 (30%) | 14 (70%) |
| Pacific Islander | 2 (14%) | 12 (86%) |
| Other | 4 (67%) | 2 (33%) |
| Not reported | 7 (41.2%) | 10 (58.8%) |
All the schools in the Cairns region of Far North Queensland that were contacted for participation_
| Number of schools | Number of students | |
|---|---|---|
| State Primary Schools | 69 | 15,399 |
| State High Schools | 11 | 10,340 |
| State Combined (Primary and High) Schools | 16 | 11,597 |
| Private Primary Schools | 24 | 5,917 |
| Private High Schools | 8 | 3,793 |
| Private Combined (Primary and High) Schools | 9 | 5,579 |
| Total | 137 | 52,625 |
Association between gender and risk category_
| Variable | Male mean (SD) | Female mean (SD) | t - value | p - value |
|---|---|---|---|---|
| Inattention | 4.05 (1.92) | 2.91 (2.10) | ‒5.57 | <0.01 |
| Snoring frequency | 0.57 (0.80) | 0.42 (0.68) | ‒2.03 | <0.05 |
| Snoring quality | 0.82 (0.73) | 0.60 (0.70) | ‒2.96 | <0.01 |
| Breathing | 0.34 (0.64) | 0.22 (0.52) | ‒2.13 | <0.05 |
| Mouth breathing | 0.84 (0.79) | 0.88 (0.82) | 0.54 | 0.57 |
| Daytime sleepiness | 1.87 (1.32) | 1.89 (1.27) | 0.05 | 0.96 |
| Bed wetting | 0.35 (0.48) | 0.20 (0.40) | ‒3.49 | <0.01 |
| Total | 9.22 (4.19) | 7.52 (4.08) | ‒4.06 | <0.01 |
Association between age and risk category_
| Risk | ||
|---|---|---|
| Age | Low | High |
| ≤11 years | 88 (58) | 63 (42) |
| 12+ years | 172 (69) | 77 (31) |