
Figure 1.
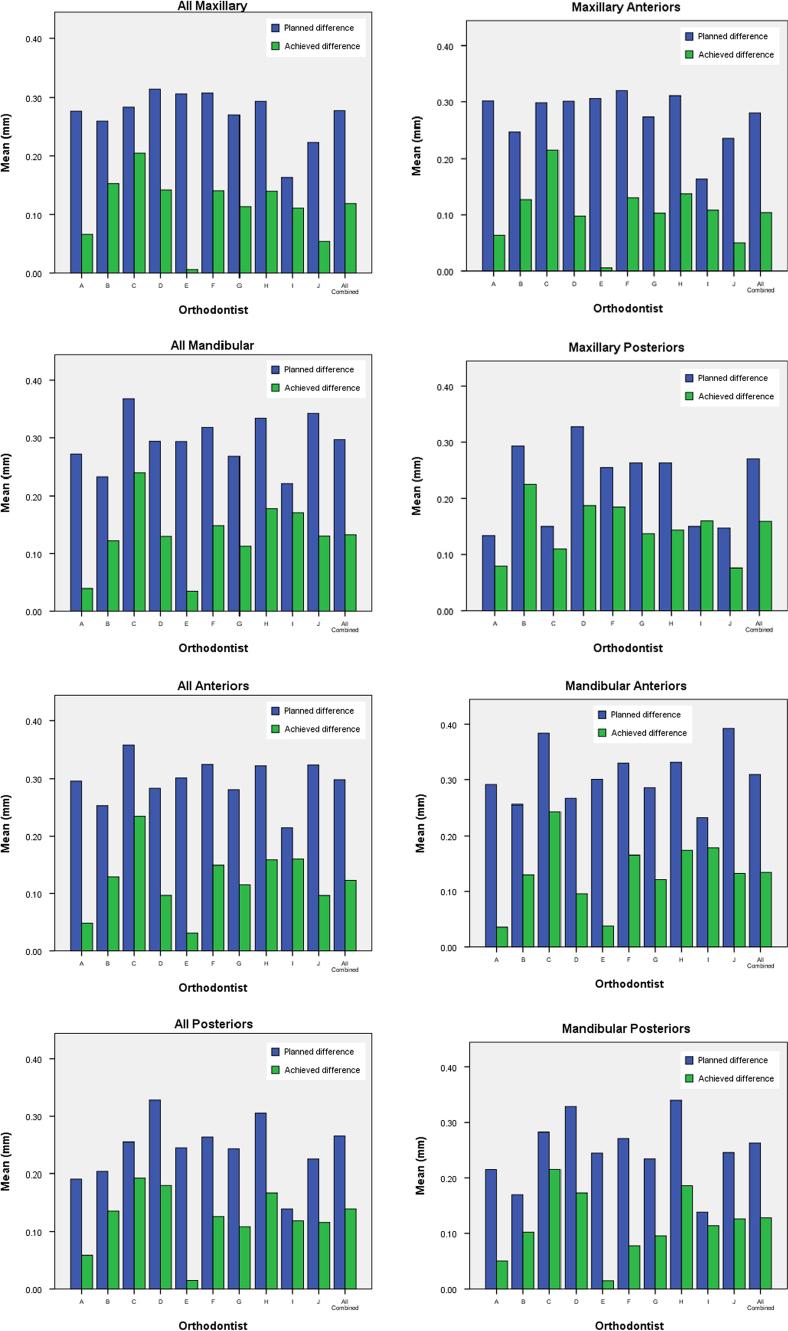
Figure 2.
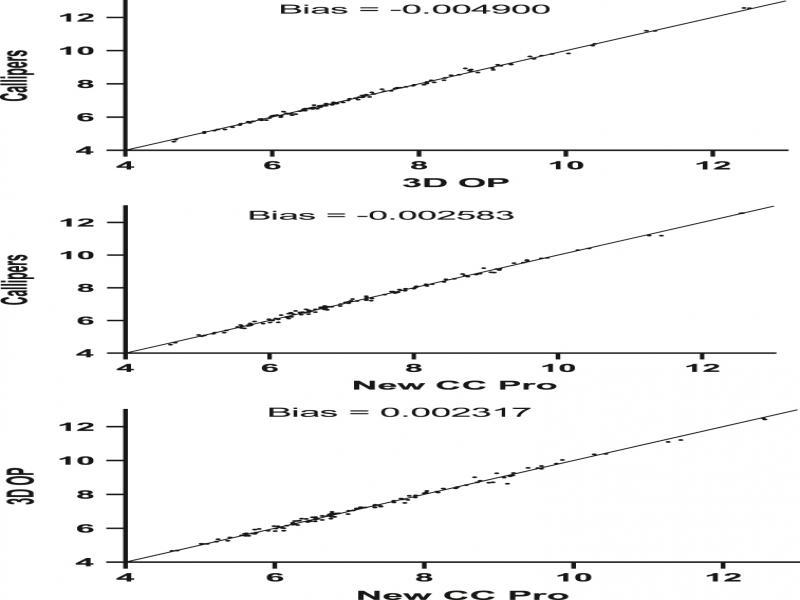
Figure 3.
Figure 4.
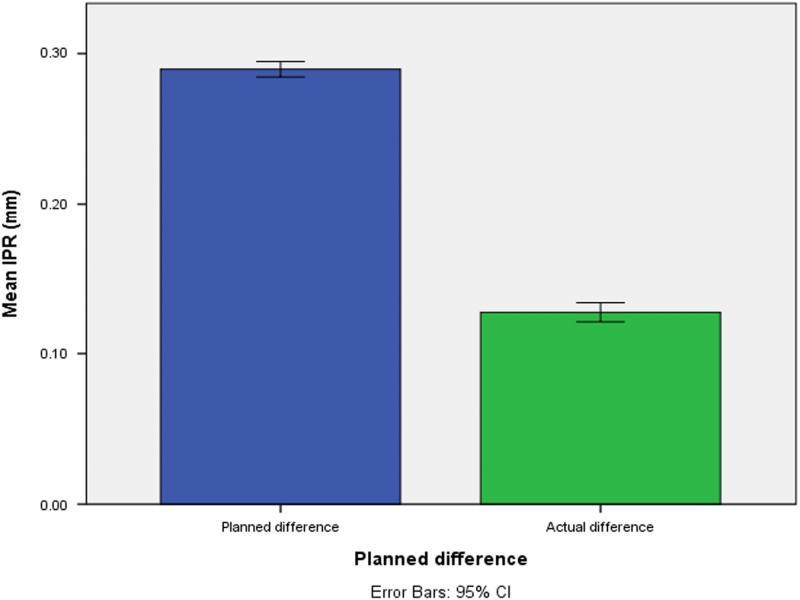
Figure 5.
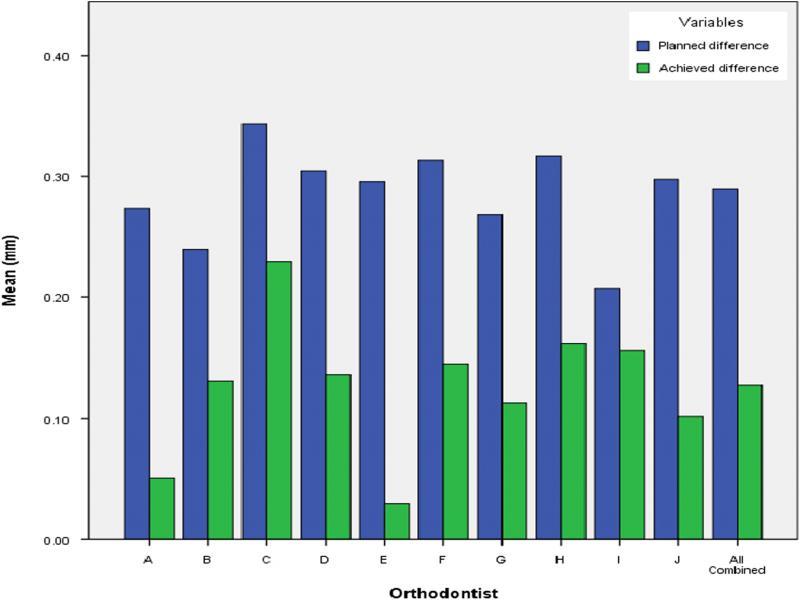
Figure 6.
Correlation matrix (n = 120) comparing both ClinCheck versions with ‘gold standard’ measurements_
| Correlations | ||||
|---|---|---|---|---|
| Old CC Pro | New CC Pro | 3D OP | Callipers | |
| Old CC Pro | ||||
| Pearson Correlation | 1 | 0.991** | 0.988** | 0.988** |
| Sig. (2-tailed) | 0.000 | 0.000 | 0.000 | |
| N | 120 | 120 | 120 | 120 |
| New CC Pro | ||||
| Pearson Correlation | 0.991** | 1 | 0.997** | 0.998** |
| Sig. (2-tailed) | 0.000 | 0.000 | 0.000 | |
| N | 120 | 120 | 120 | 120 |
| 3d OP | ||||
| Pearson correlation | 0.988** | 0.997** | 1 | 0.999** |
| Sig. (2-tailed) | 0.000 | 0.000 | 0.000 | |
| N | 120 | 120 | 120 | 120 |
| Callipers | ||||
| Pearson correlation | 0.988** | 0.998** | 0.999** | 1 |
| Sig. (2-tailed) | 0.000 | 0.000 | 0.000 | |
| N | 120 | 120 | 120 | 120 |
Reliability correlation matrix (n = 40) for comparison of Geomagic with other methods_
| Method | Geomagic 1 | Geomagic 2 | 3D OP measure | Callipers | Old CC Pro | New CC Pro |
|---|---|---|---|---|---|---|
| Geomagic 1 | 1.000 | 0.986 | 0.989 | 0.986 | 0.971 | 0.988 |
| Geomagic 2 | 0.986 | 1.000 | 0.994 | 0.995 | 0.989 | 0.997 |
| 3D OP measure | 0.989 | 0.994 | 1.000 | 0.997 | 0.988 | 0.996 |
| Callipers | 0.986 | 0.995 | 0.997 | 1.000 | 0.986 | 0.997 |
| Old CC Pro | 0.971 | 0.989 | 0.988 | 0.986 | 1.000 | 0.991 |
| New CC Pro | 0.988 | 0.997 | 0.996 | 0.997 | 0.991 | 1.000 |
Mean planned and achieved IPR (in mm) by group_
| Group | n | Planned IPR Mean (SD) | Achieved IPR Mean (SD) | Mean shortfall | Mean % achieved |
|---|---|---|---|---|---|
| All teeth | 2,474 | 0.29 (0.13) | 0.13 (0.16) | 0.16 | 43.99 |
| Maxillary | 921 | 0.28 (0.13) | 0.12 (0.17) | 0.16 | 42.74 |
| Mandibular | 1,553 | 0.30 (0.13) | 0.13 (0.16) | 0.16 | 44.68 |
| Anterior | 1808 | 0.30 (0.13) | 0.12 (0.16) | 0.18 | 41.19 |
| Posterior | 666 | 0.27 (0.14) | 0.14 (0.17) | 0.13 | 52.54 |
| Mx anterior | 677 | 0.28 (0.13) | 0.10 (0.16) | 0.18 | 37.13 |
| Mx posterior | 244 | 0.27 (0.13) | 0.16 (0.17) | 0.11 | 58.82 |
| Md anterior | 1,131 | 0.31 (0.12) | 0.13 (0.16) | 0.18 | 43.37 |
| Md posterior | 422 | 0.26 (0.15) | 0.13 (0.17) | 0.13 | 48.80 |
Teeth in pilot study of 40 cases for which no IPR was done, to show variation of New CC Pro measurements from T1 to T2_
| Descriptive statistics | |||||
|---|---|---|---|---|---|
| N | Minimum | Maximum | Mean | Std. deviation | |
| Planned difference | 509 | 0.05 | 1.00 | 0.2900 | 0.14318 |
| Actual difference | 509 | ‒0.78 | 1.18 | 0.1303 | 0.17169 |
| Valid N (listwise) | 509 | ||||
Planned and achieved tooth width differences in pilot study of 40 cases_
| Descriptive statistics | |||||
|---|---|---|---|---|---|
| N | Minimum | Maximum | Mean | Std. deviation | |
| Planned difference | 422 | 0.00 | 0.00 | 0.0000 | 0.00000 |
| Achieved difference | 422 | ‒0.78 | 0.72 | 0.0072 | 0.13918 |
| Valid N (listwise) | 422 | ||||
Planned and achieved tooth width changes for all teeth (n = 2,474) from all 10 orthodontists combined_
| Paired samples test | ||||||||
|---|---|---|---|---|---|---|---|---|
| Paired differences | ||||||||
| 95% confidence interval of the difference | ||||||||
| Mean | Std. deviation | Std. error mean | Lower | Upper | t | df | Sig. (2-tailed) | |
| Pair 1 | ||||||||
| Planned difference‒actual difference | 0.16220 | 0.16101 | 0.00324 | 0.15585 | 0.16855 | 50.108 | 2,473 | 0.000 |
Linear regression of planned difference and shortfall in achieved difference_
| Unstandardised coefficients | Standardised coefficients | 95.0% confidence interval for B | |||||
|---|---|---|---|---|---|---|---|
| Model | B | Std. error | Beta | t | Sig. | Lower bound | Upper bound |
| 1 | |||||||
| (Constant) | 0.019 | 0.007 | 2.698 | 0.007 | 0.005 | 0.034 | |
| Planned difference | 0.493 | 0.023 | 0.400 | 21.689 | 0.000 | 0.448 | 0.537 |