
Table I.
Criteria for sample selection.
|
Inclusion criteria:
Non-growing patients Complete permanent dentition Orthodontic treatment with Invisalign (SmartTrack) All subjects finished the initial aligner wear as determined by ClinCheck Two-week aligner wear protocol Simple Class I malocclusion comprising spacing (< 4 mm) to crowding (< 6 mm) Non – extraction treatment No interproximal reduction No intermaxillary elastics No orthognathic surgery No restorative treatment to incisors and distal most molars during orthodontic treatment All the subjects included in this study met the criteria of compliance |
|
Exclusion criteria: Periodontally compromised patients Medications which alter bone metabolism (e.g.: Bisphosphonates, PG inhibitors) Patients treated with Power Ridges |
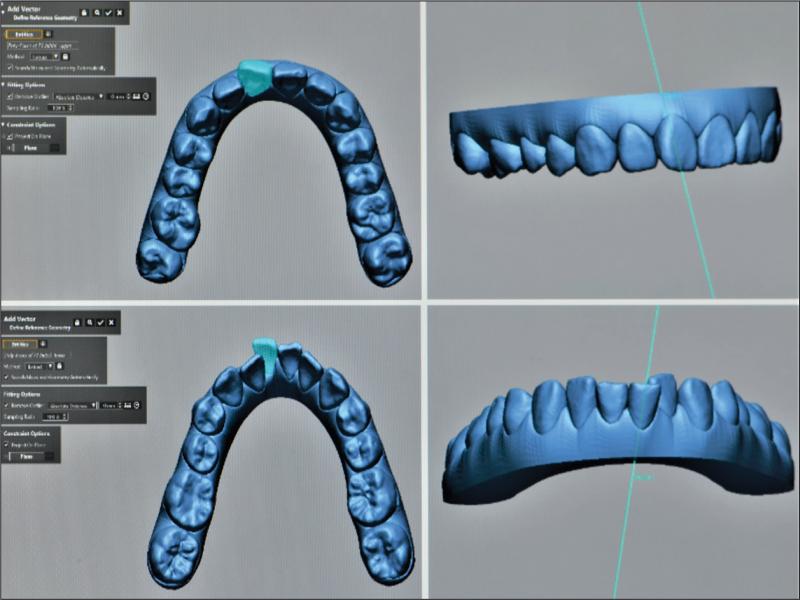
Figure 1.
Generation of long axis of the tooth.
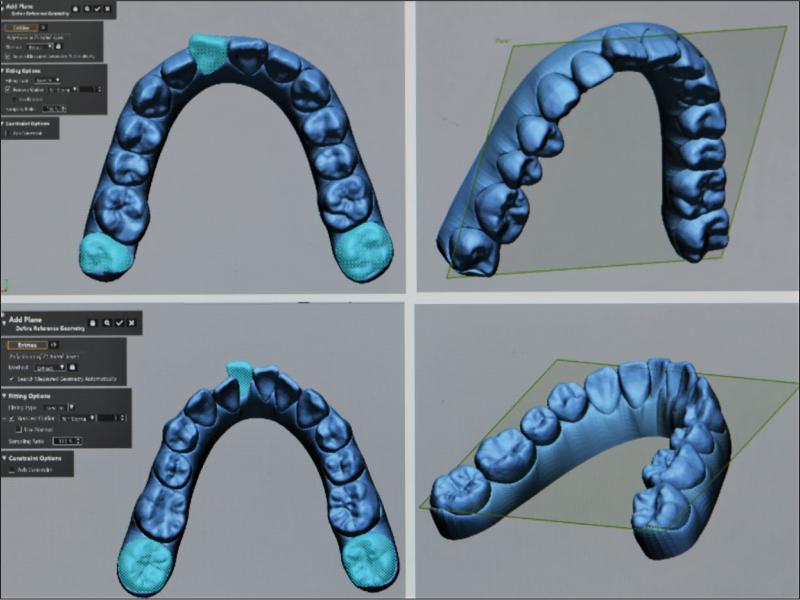
Figure 2.
Generation of reference plane.
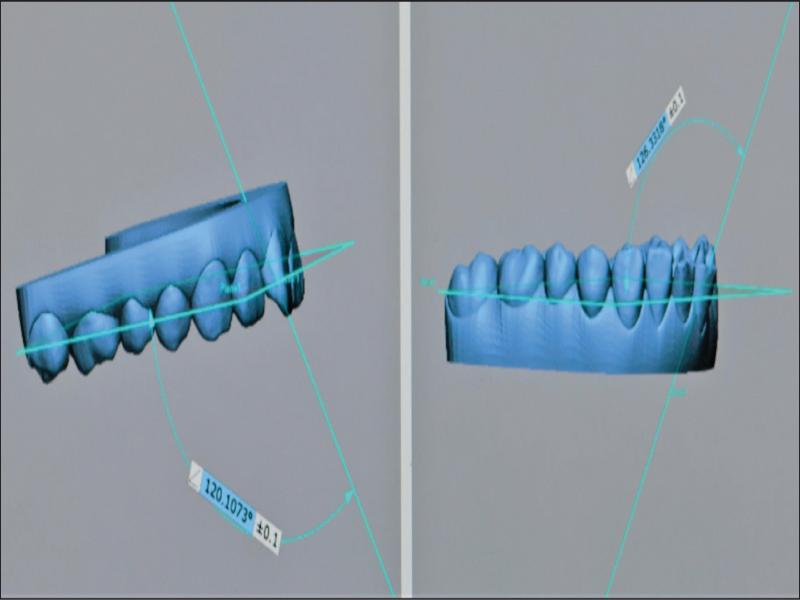
Figure 3.
Measurement of torque.
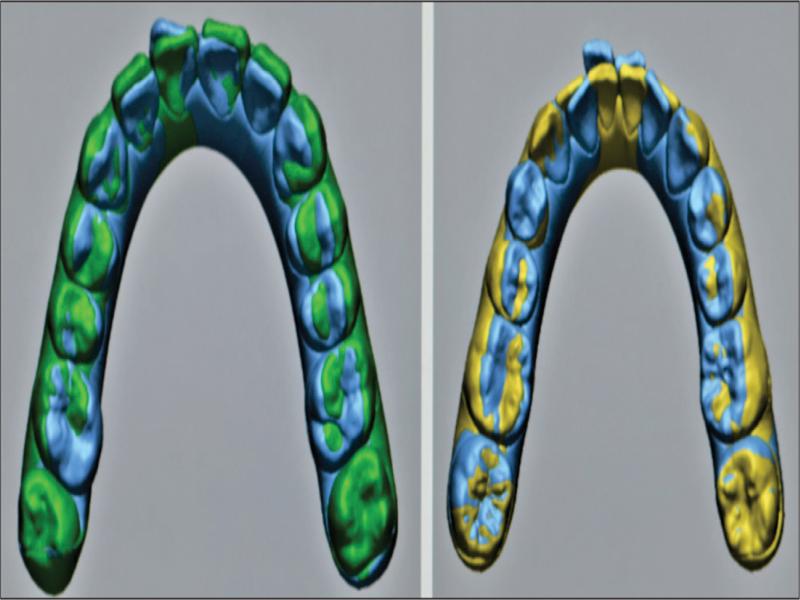
Figure 4.
Best-fit superimposition (global and fine).
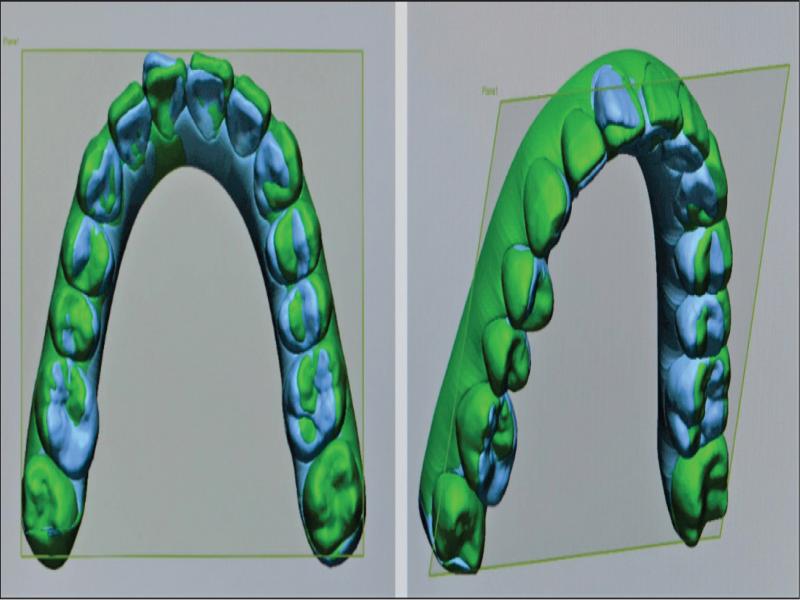
Figure 5.
The best fit superimposition with a common transverse reference plane for both pretreatment and predicted post-treatment STL files.
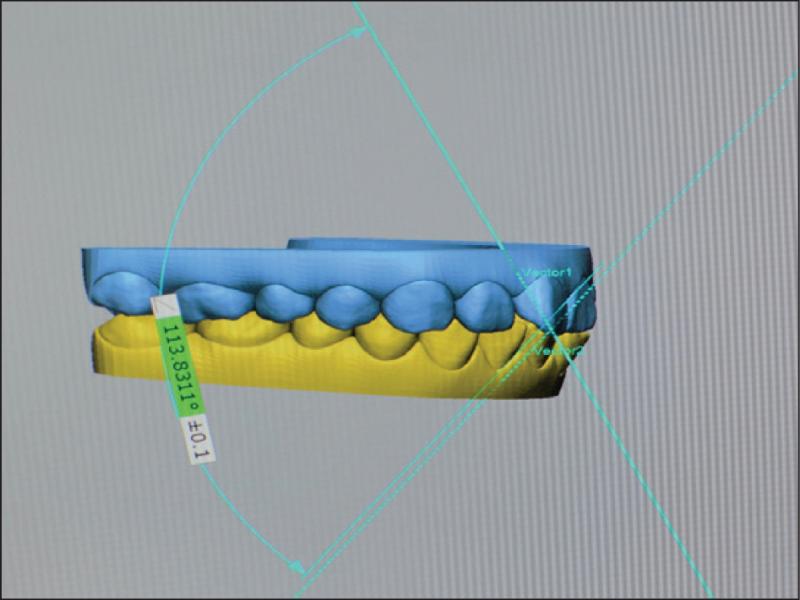
Figure 6.
Measurement of interincisal angle.
Table II.
Calculation of torque, interincisal angle (IIA) differential and mean accuracy.
| Predicted change in torque = torque at T1 – torque at T0 Achieved change in torque = torque at R – torque at T0 Torque differential = predicted change in torque – achieved change in torque |
| Predicted change in IIA = IIA at T1 – IIA at T0 Achieved change in IIA = IIA at R – IIA at T0 IIA differential = predicted change in IIA – achieved change in IIA |
| Mean accuracy for torque or IIA = 100 – (predicted change-achieved change/predicted change) X 100 |
Table III.
Descriptive statistics and paired student t-test values for torque, IIA differential.
| Group | N | Predicted change (Mean ± SD) (°) | Achieved change (Mean ± SD) (°) (Mean ± SD) (°) | Differential (predicted change – achieved change) (°) | t | P-value | ||||
|---|---|---|---|---|---|---|---|---|---|---|
| Median (°) | 95% CI | |||||||||
| Lower (°) | Upper (°) | |||||||||
| Labial CT | UC | 56 | 8.16 ± 7.78 | 1.73 ± 5.22 | 6.43 ± 7.09 | 5.94 | 4.50 | 8.36 | 6.78 | <0.001* |
| UL | 51 | 5.99 ± 6.26 | 0.93 ± 4.49 | 5.06 ± 7.32 | 3.94 | 2.96 | 7.16 | 4.94 | <0.001* | |
| LI | 112 | 7.77 ± 5.11 | 5.03 ± 5.94 | 2.75 ± 5.70 | 2.40 | 1.65 | 3.84 | 5.10 | <0.001* | |
| Lingual/Palatal CT | UC | 24 | 4.49 ± 3.38 | 5.22 ± 4.01 | -0.73 ± 3.31 | -0.71 | -2.16 | 0.70 | -1.08 | >0.05 |
| UL | 29 | 4.90 ± 4.28 | 4.54 ± 4.38 | 0.36 ± 4.41 | 0.81 | -1.36 | 2.08 | 0.44 | >0.05 | |
| LI | 48 | 4.73 ± 5.39 | 5.40 ± 5.50 | -0.67 ± 6.06 | -0.45 | -2.49 | 1.15 | -0.77 | >0.05 | |
| Labial CT – IIA | 61 | 13.80 ± 10.69 | 4.80 ± 8.74 | 9.00 ± 10.73 | 7.50 | 6.20 | 11.8 | 6.55 | <0.001* | |
| Lingual/Palatal CT– IIA | 19 | 9.79 ± 11.70 | 13.20 ± 9.44 | -3.40 ± 7.90 | -2.45 | -7.39 | 0.59 | -1.88 | >0.05 | |
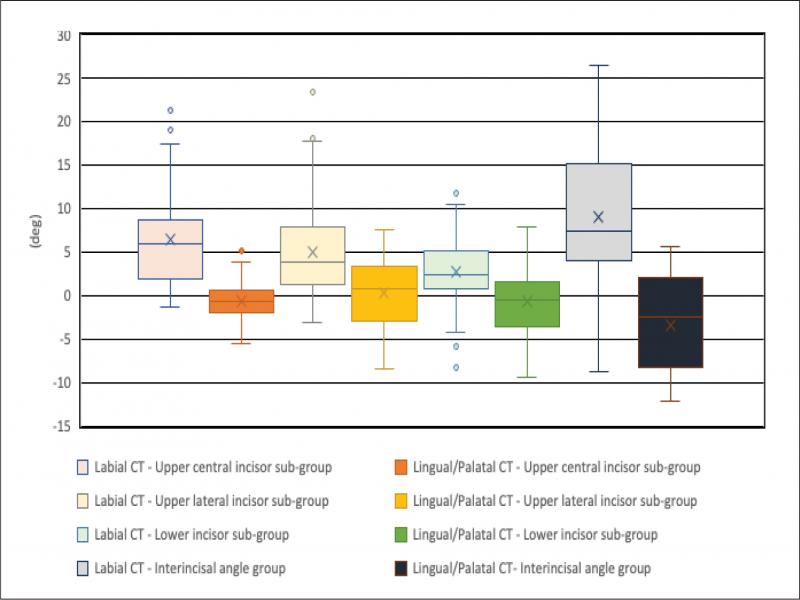
Figure 7.
Box-whisker plot showing the distribution of torque and IIA differential.
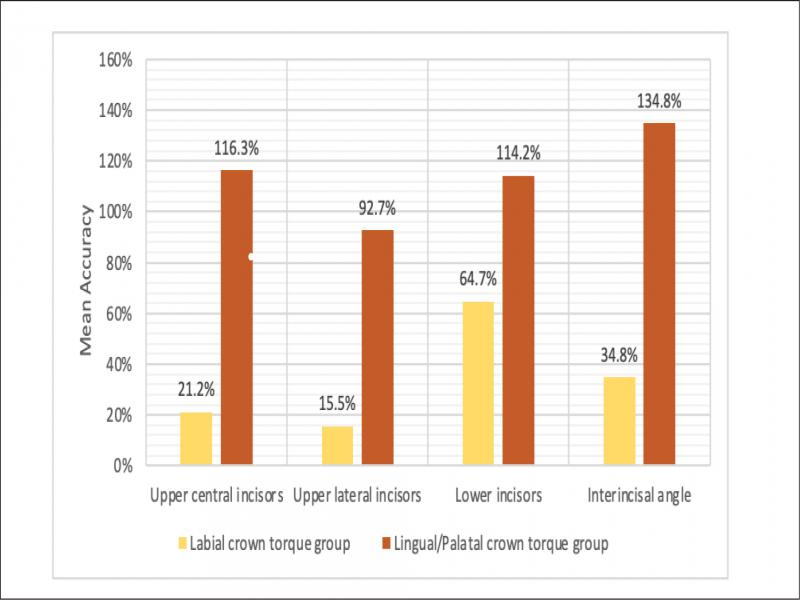
Figure 8.
Mean accuracy of the torque expression and interincisal angle change resulting from prescribed torque.