
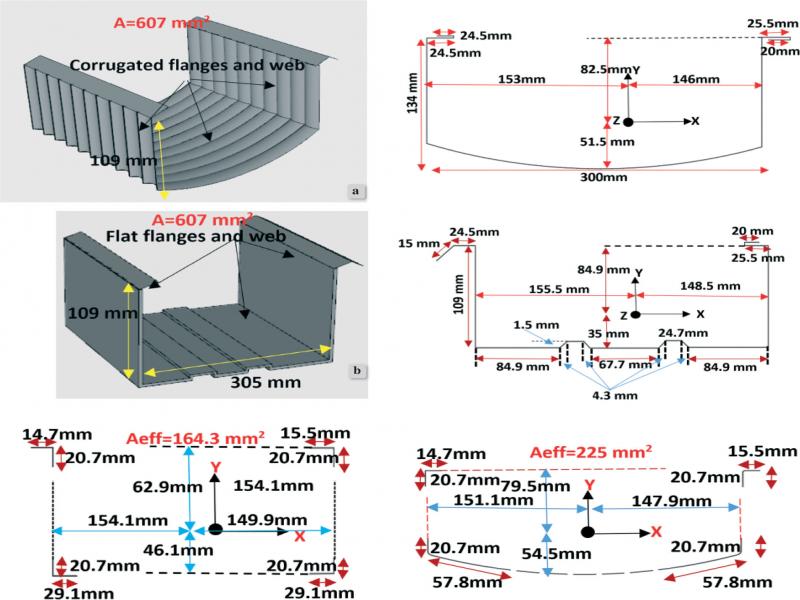
Figure 1.
k-span: super span model 600 a) corrugated b) without corrugation and the effective cross-section area in all models
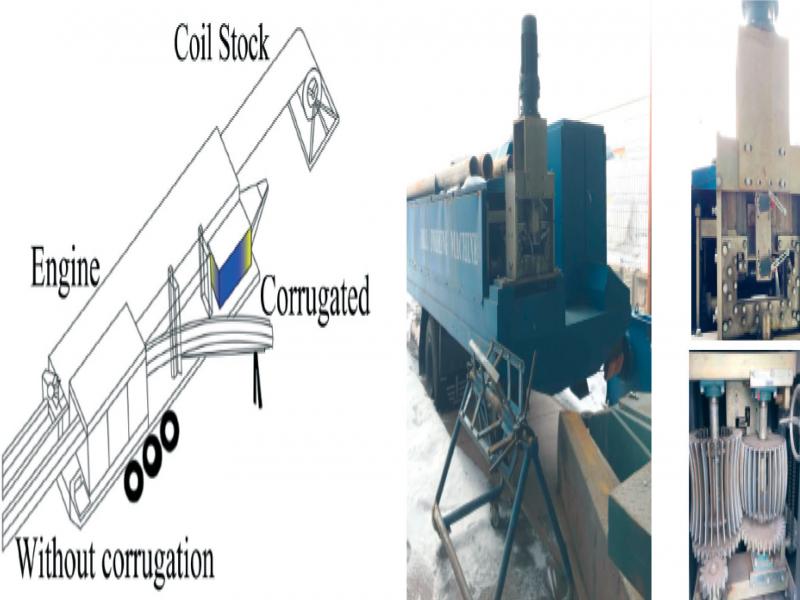
Figure 2.
RFM machine
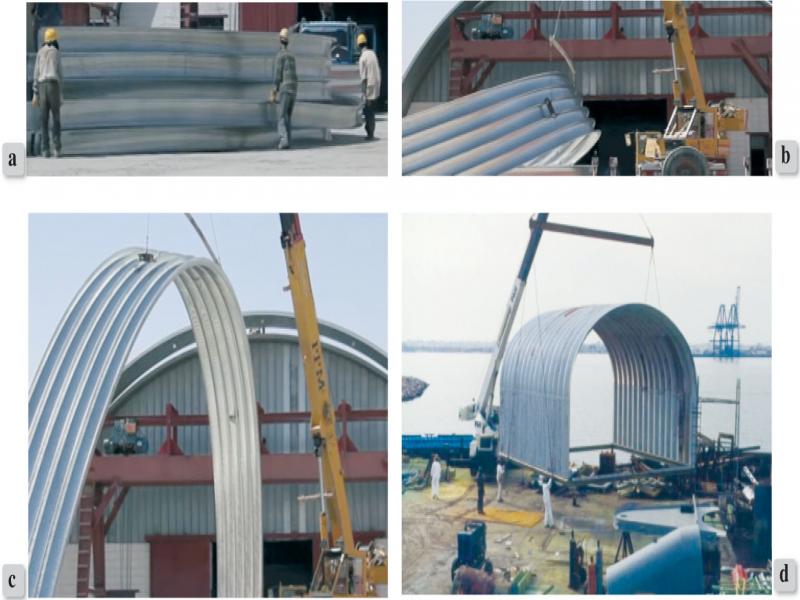
Figure 3.
Application of arch steel plate sections (a-b-c-shows the application pf a k-span vault-type structure made of light steel plates on the site in the Afghanistan (http://gazingattheflag.blogspot.com/2007/08/coalition-engineers-work-together-in.html), d – shows the application pf a k-span vault-type structure made of light steel plates on the site in the USA (http://www.durospan.net/))
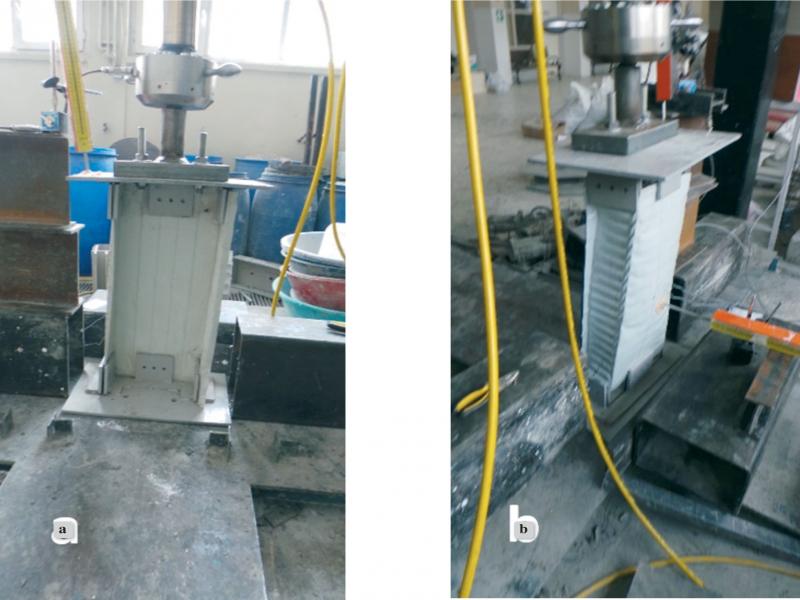
Figure 4.
Experimental models a) without corrugation b) corrugated
Table 1.
Materials Properties
| The Youngs Modulus (E) GPa | The Yield Strength (fy) MPa | The ultimate tensile strength (fu) MPa | Poissons Ratio (υ) |
|---|---|---|---|
| 201 | 352.8 | 489.6 | 0.29 |
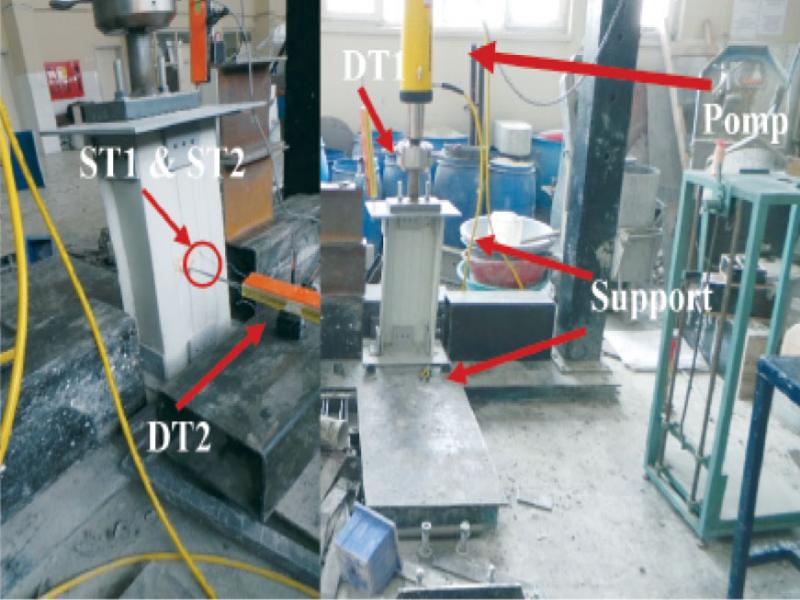
Figure 5.
The experimental setup
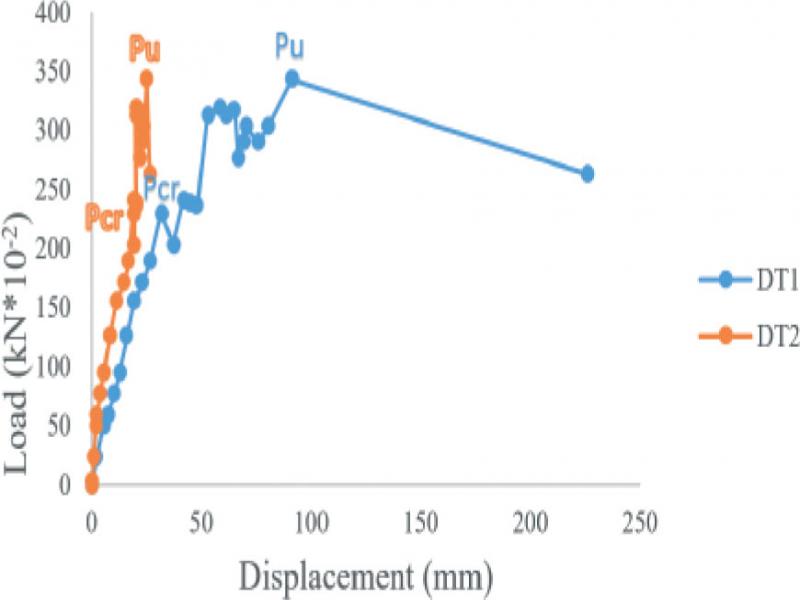
Figure 6.
Load-displacement for uncorrugated member
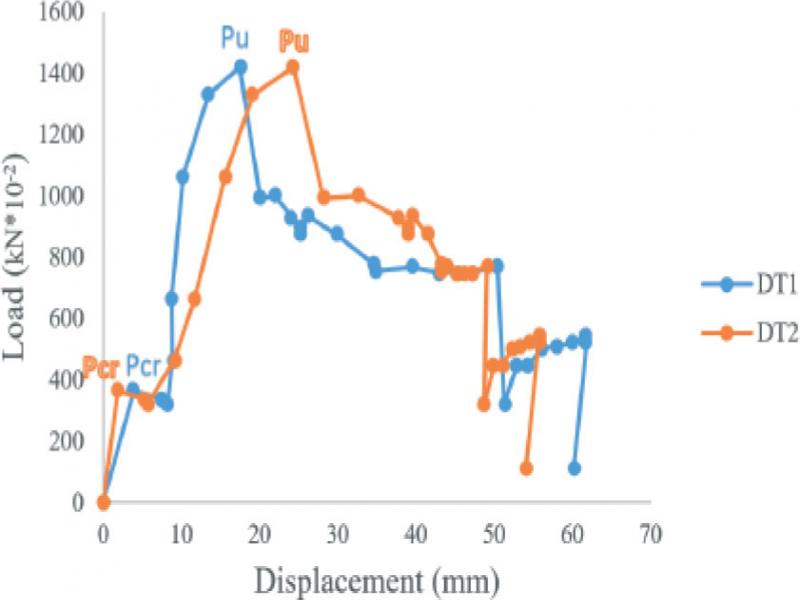
Figure 7.
Load-displacement for corrugated member
Table 2.
Load-displacement of the members with and without corrugate
| Model | First bucking load (Pcr) (kN) | First buckling load Displacement (mm) | Max. load (Pu) (kN) | Displacement at Pu (mm) | Max. Displacement (mm) | First bucking load (Pcr) (EX2) / First bucking load (Pcr) (EX1) | Analytical Max.load of the EC3 (kN) | Max. Load (EX2) / Max. Load (EX1) | First bucking load (Pcr) (EX)/Analytical Max.load of the EC3 | Max. load(Pu) (EX)/Analytical Max.load of the EC3 |
|---|---|---|---|---|---|---|---|---|---|---|
| EX1* | 2.30 | 31.72 | 3.4345 | 91.15 | 262.95 | 57.96 | 4.13 | 0.039 | 0.059 | |
| EX2** | 3.649 | 1.84 | 14.1925 | 24.29 | 61.80 | 1.59 | 79.38 | 0.045 | 0.178 |
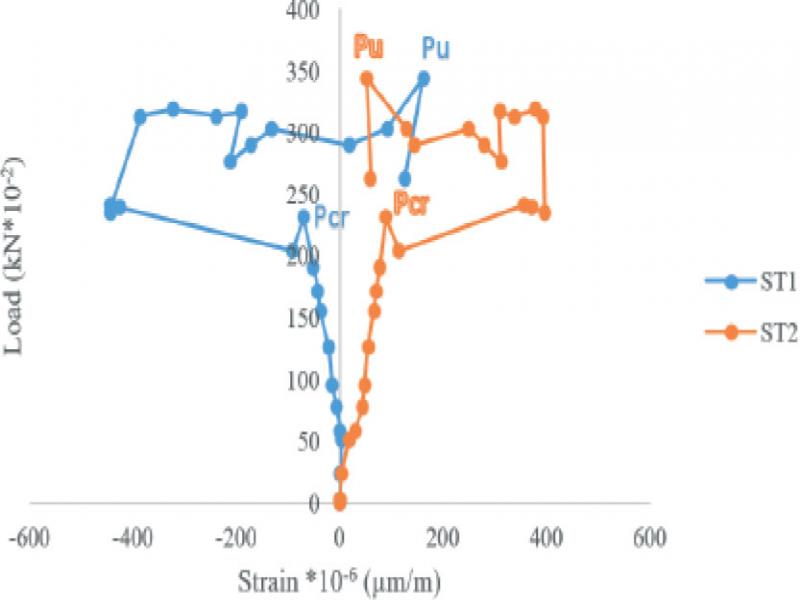
Figure 8.
Load-strain for the uncorrugated members
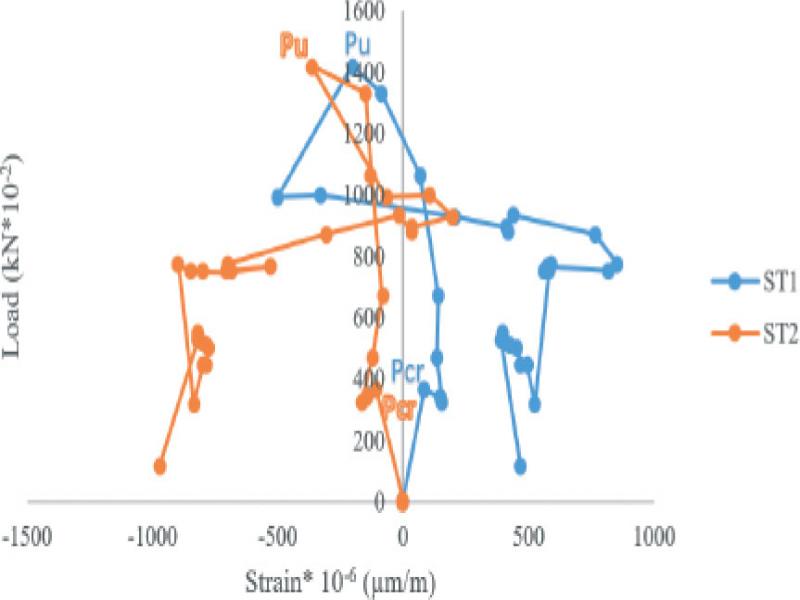
Figure 9.
Load-strain for the corrugated member
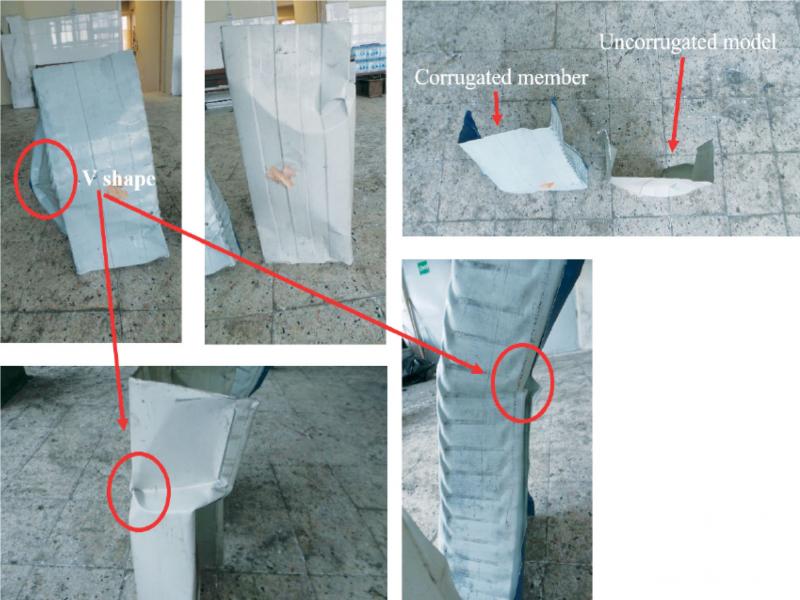
Figure 10.
Failure types of the all tests
Table 3.
Comparison of this work and Cybulski et al. [5]
| Model | Experimental load (Cybulski et al [5]) | First buckling load (Pcr) (kN) | Max. load (Pu) | First buckling load (Pcr) to Experimental load (Cybulski et al (%) | Max. load (Pu) to Experimental load (Cybulski et al (%) |
|---|---|---|---|---|---|
| EX1* | - | 2.30 | 3.4345 | - | - |
| EX2** | - | 3.649 | 14.1925 | - | - |
| S1 | 56.9 | - | - | 4.04 | 6.04 |
| S2 | 57.5 | - | - | 4 | 5.97 |
| S3 | 59.7 | - | - | 3.8 | 5.75 |
| S1r5m | 44.6 | - | - | 8.18 | 31.82 |
| S2r5m | 43.1 | - | - | 8.46 | 32.92 |
| S3r5m | 44.3 | - | - | 8.24 | 32.04 |
2** corrugated, S1,S2 and S3 are straight panels; and S1r5m, S2r5m, and S3r5m are corrugated panels of the Cybulski et al. [5]
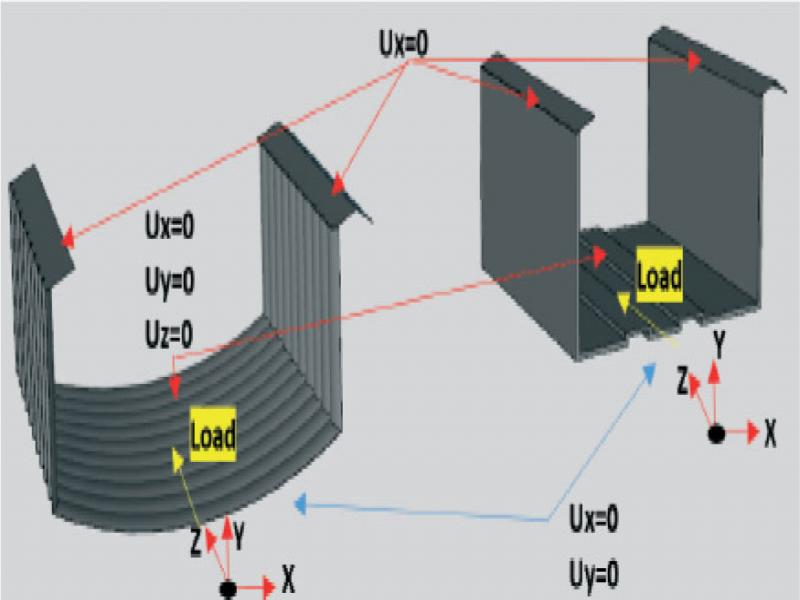
Figure 11.
Boundary conditions for with and without corrugated models
Table 4.
Numbers of nodes and elements for corrugated model
| Mesh Type | Number of nodes | Number of Elements |
|---|---|---|
| Automatically generated | 27159 | 7852 |
| Tetrahedrons | 21956 | 6149 |
| Hex-dominant | 37652 | 9874 |
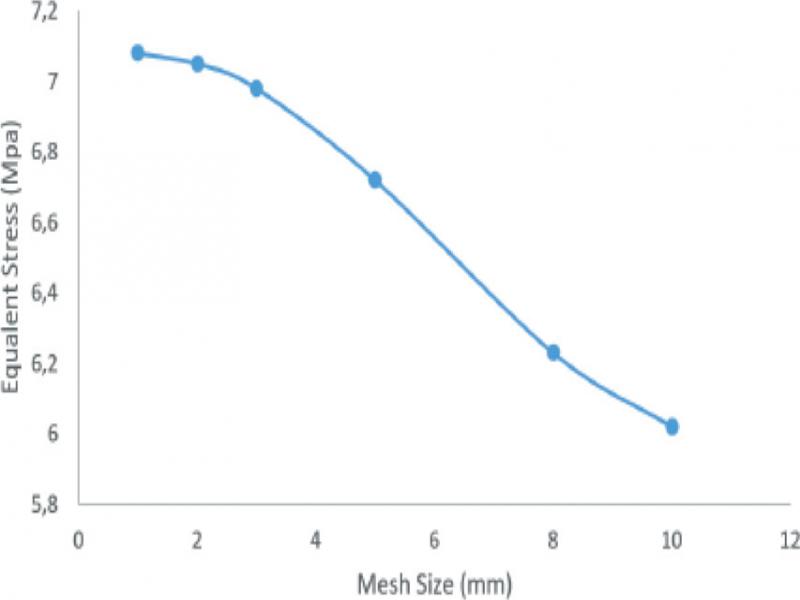
Figure 12.
Mesh sizing for corrugated model
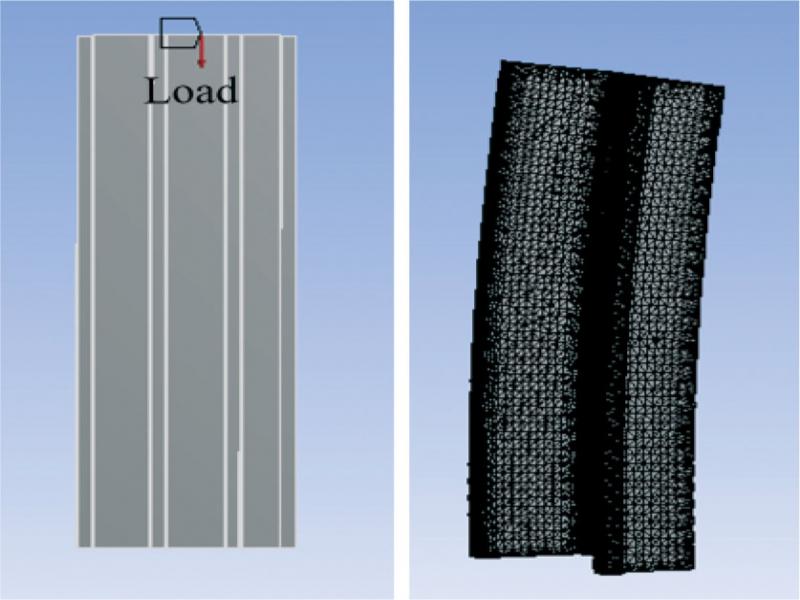
Figure 13.
Mesh and Load of the models
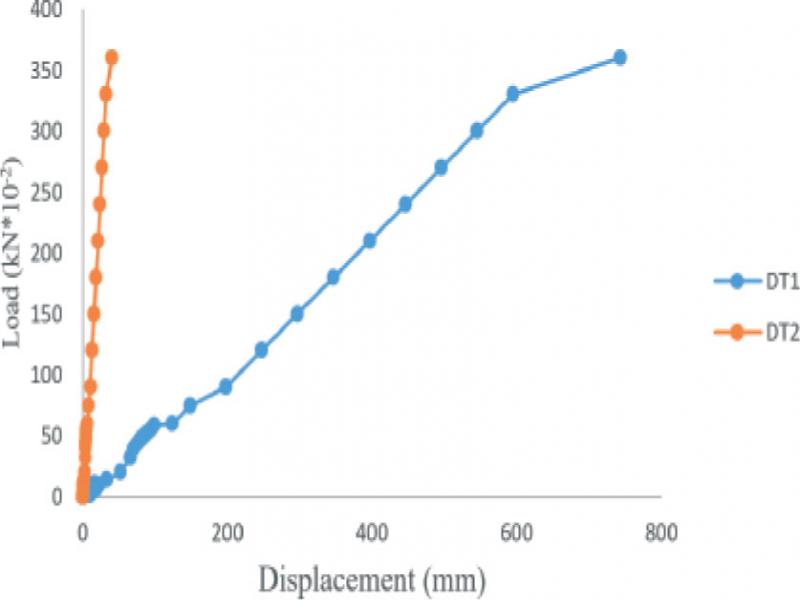
Figure 14.
Load-displacement for the uncorrugated finite-element models
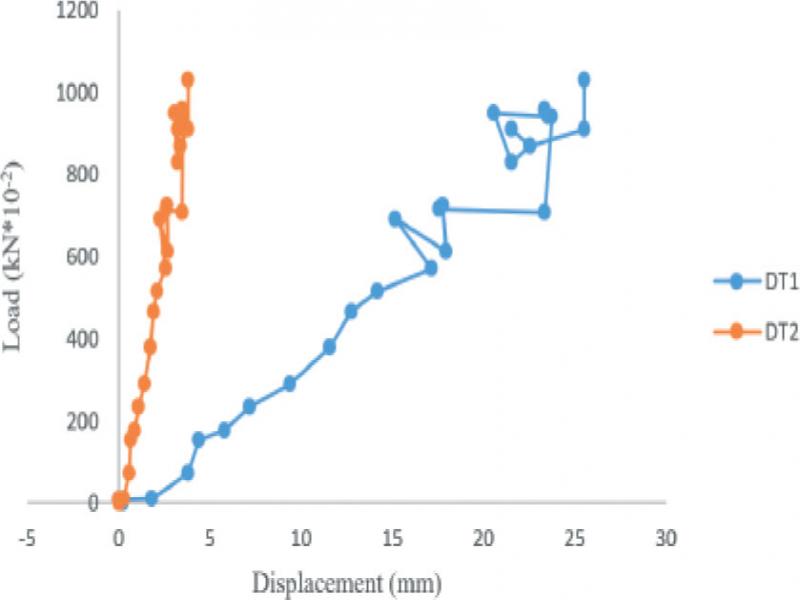
Figure 15.
Load-displacement for the corrugated finite-element models
Table 5.
Comparison of maximum load and displacement of the models
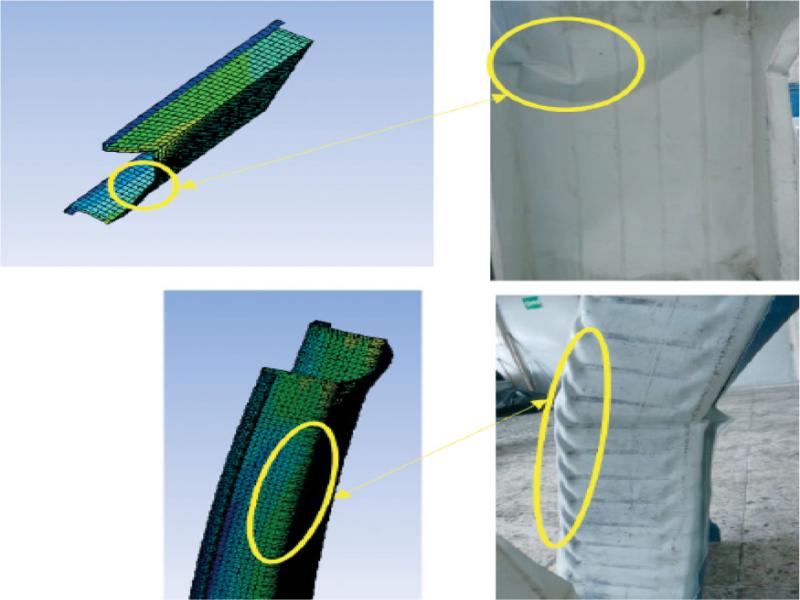
Figure 16.
Maximum shear strain by FE for the with and without corrugated models