
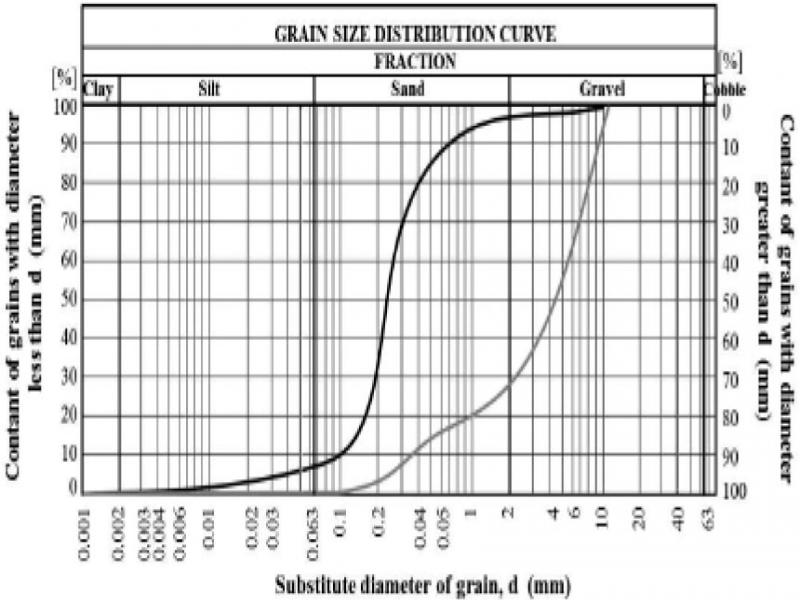
Figure 1.
Curves of grain size of non-cohesive soils, black line – FSa, gray line – saGr
Table 1.
Non-cohesive soils – basic parameters Table 2.
| Characteristic diameter / Parameter | Value | |
|---|---|---|
| FSa (SP) | saGr (GW) | |
| D 10 (mm) | 0.10 | 0.40 |
| D 30 (mm) | 0.20 | 2.20 |
| D 50 (mm) | 0.25 | 4.50 |
| D 60 (mm) | 0.30 | 5.80 |
| D 90 (mm) | 0.70 | 9.50 |
| Coefficient of curvature, C c | 1.44 | 2.30 |
| Coefficient of uniformity, C u | 2.50 | 15.70 |
| Specific density, ρs (g/cm3) | 2.65 | 2.65 |
Table 2.
Cohesive soil – basic parameters
| Parameter | Value siCl (CH) |
|---|---|
| Specific density, ρ s (g/cm3) | 2.77 |
| Dry density of solid particles, ρ ds (g/cm3) | 1.75 |
| Plastic limit, w p (%) | 25 |
| Liquid limit – cone penetrometer method, w L (%) | 65 |
| Liquid limit - Casagrande method, w L (%) | 75 |
| Optimal moisture, w opt (%) | 18 |
| Swelling pressure, σ sp (kPa) | 97 |
| Free-swell, FS (%) | 31.50 |
Table 3.
Research program (w – specimen moisture; m – specimen mass; n – specimen number in one drying cycle)
| Type of soil | Parameter | Variant 1 | Variant 2 | Variant 3 | ||
|---|---|---|---|---|---|---|
| (MO-A) (MO-B) | (CO) | (MO-A) | (CO) | (MO-A) | ||
| FSa (SP) | w | 3% ÷ 43% every 4% 43% ÷ 103% every 5% | 45% | 45% | 45% | |
| m | 25 g | 25 g | 25 g, 50 g, 75 g, 100 g, 125 g, 300 g | 25 g | ||
| n | 1 | - | 1 | - | 1, 2, 3, 5 | |
| SaGr (GW) | w | 3% ÷ 43% every 4% 43% ÷ 103% every 5% | 3% ÷ 43% every 4 % 43% ÷ 48% every 5% | 45% | 45% | - |
| m | 300 g | 300 g | 300 g | 300 g | - | |
| n | 1 | - | 1 | - | - | |
| SiCl (CH) | w | 3% ÷ 43% every 4% 43% ÷ 103% every 5% | 45% | 45% | 45% | |
| m | 25 g | 25 g | 25 g, 50 g, 75 g, 100 g, 125 g | 25 g | ||
| n | 1 | - | 1 | - | 1, 2, 3, 5 | |
Table 4.
Summary of moisture measurements and drying time for FSa, siCl and saGr conducted in microwave oven for variant 2
| Microwave oven (MO-A) – variant 2 (w 0 = 45%) | ||||||
|---|---|---|---|---|---|---|
| Specimen mass | FSa | siCl | saGr | |||
| m | w avg | t avg | w avg | t avg | w avg | t avg |
| (g) | (%) | (min) | (%) | (min) | (%) | (min) |
| 25 | 45.12 | 12 | 45.01 | 4 | - | - |
| 50 | 45.23 | 12 | 45.41 | 6 | - | - |
| 75 | 45.61 | 12 | 45.01 | 11 | - | - |
| 100 | 45.39 | 13.5 | 45.19 | 13 | - | - |
| 125 | 45.16 | 14.5 | 45.39 | 16 | - | - |
| 300 | 45.26 | 17 | - | - | 44.95 | 11 |
Table 5.
Summary of moisture measurements and drying time for FSa and siCl conducted in microwave oven for variant 3
| Microwave oven (MO-A) – variant 3 | ||||
|---|---|---|---|---|
| Number of specimens | m 0 = 25 g, w 0 = 45% | |||
| FSa | siCl | |||
| n | w avg | t avg | w avg | t avg |
| (-) | (%) | (min) | (%) | (min) |
| 1 | 45.12 | 12 | 45.01 | 4 |
| 2 | 44.76 | 14 | 44.76 | 4.75 |
| 3 | 44.72 | 14.5 | 44.85 | 4.75 |
| 5 | 45.04 | 16.1 | 44.87 | 6.8 |
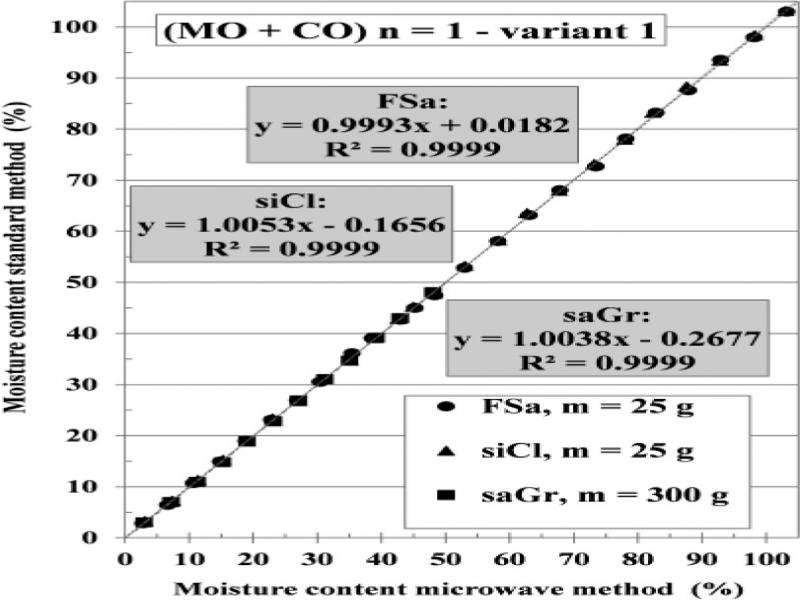
Figure 2.
Difference between results of moisture contents from microwave oven and conventional oven for FSa, siCl and saGr specimens (variant 1)
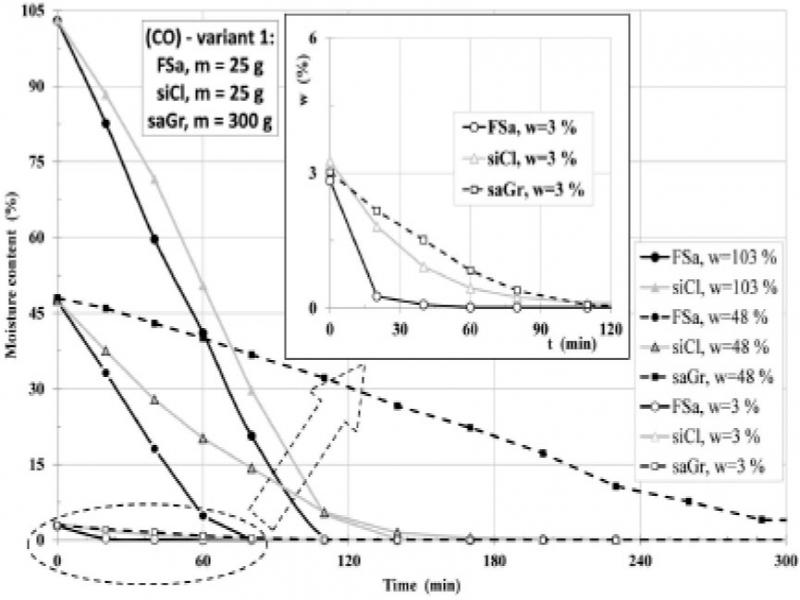
Figure 3.
Change of specimens moisture content during drying in a conventional oven (variant 1) for FSa, siCl and saGr
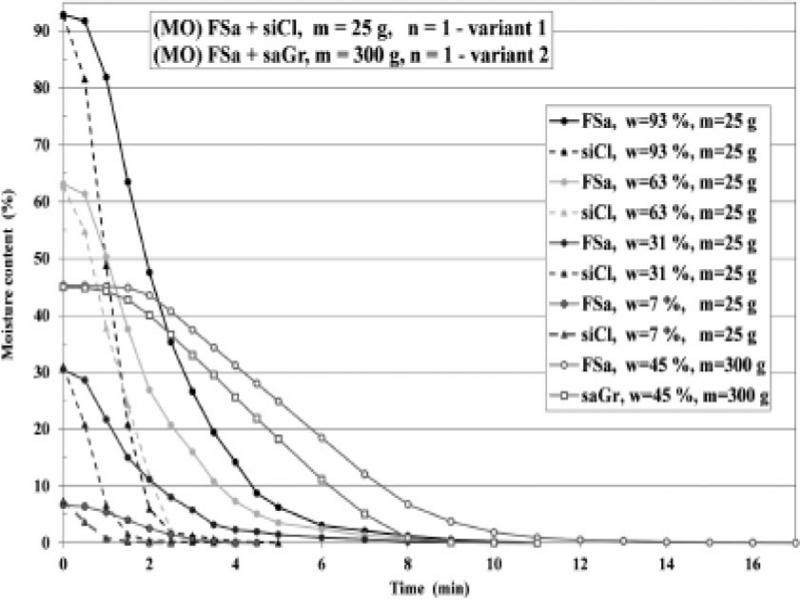
Figure 4.
Change of specimens moisture content during drying in a microwave oven (variants 1 and 2) for FSa, siCl and saGr
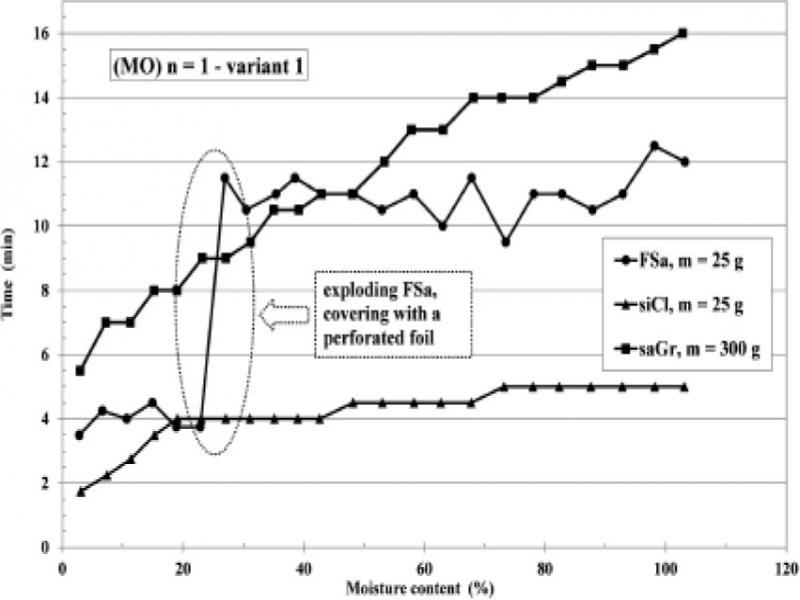
Figure 5.
Change of specimens drying time in a microwave oven depending on their initial moisture for FSa, siCl and saGr (variant 1)
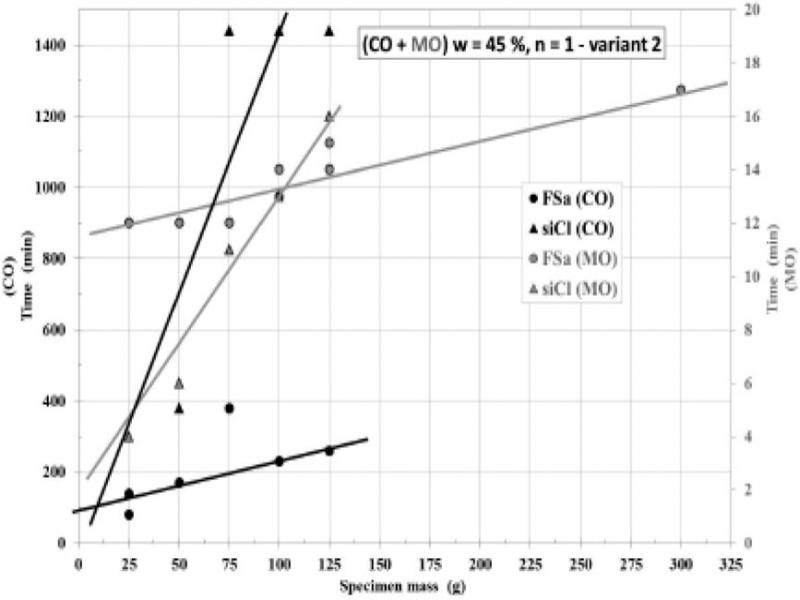
Figure 6.
Change of specimens drying time in a microwave oven and conventional oven depending on their initial mass for FSa, siCl and saGr (variant 2)
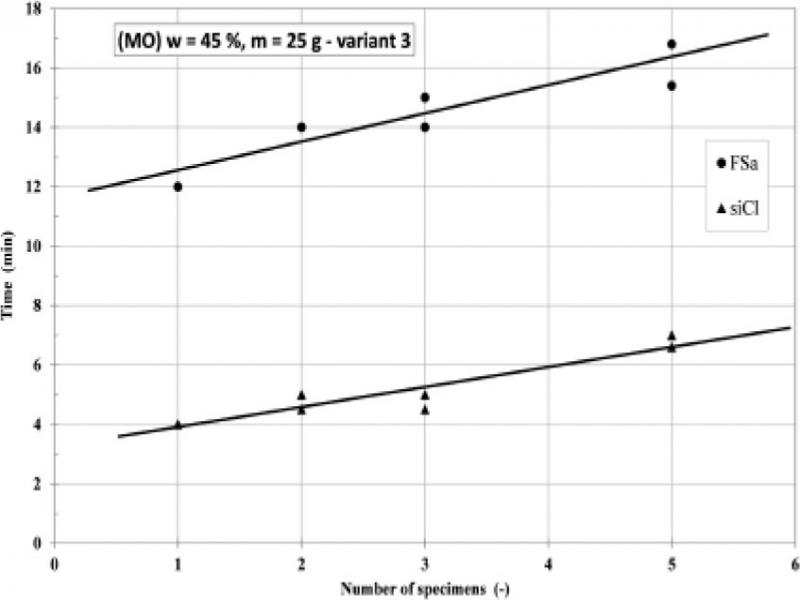
Figure 7.
Change of specimens drying time in a microwave oven depending on their number for FSa and siCl (variant 3)
Table A1.
Summary of moisture measurements and drying time for FSa, siCl and saGr conducted in microwave oven for variant 1
| Microwave oven (MO-A+MO-B) – variant 1 | |||||
|---|---|---|---|---|---|
| m = 25 g | m = 300 g | ||||
| FSa | siCl | saGr | |||
| wavg | tavg | wavg | tavg | wavg | tavg |
| (%) | (min) | (%) | (min) | (%) | (min) |
| 2.83 | 2.8 | 3.10 | 1.8 | 2.97 | 5.5 |
| 6.66 | 4.3 | 7.41 | 2.3 | 7.20 | 7 |
| 10.70 | 4 | 11.38 | 2.8 | 11.28 | 7 |
| 14.93 | 4.5 | 15.28 | 3.5 | 15.21 | 8 |
| 18.90 | 3.8 | 19.07 | 4 | 19.01 | 8 |
| 22.88 | 3.8 | 23.04 | 4 | 23.20 | 9 |
| 26.94* | 11.5 | 27.10 | 4 | 27.09 | 9 |
| 30.46 | 10.5 | 31.09 | 4 | 31.18 | 9.5 |
| 35.43 | 11 | 35.15 | 4 | 35.03 | 10.5 |
| 38.57 | 11.5 | 39.01 | 4 | 39.18 | 10.5 |
| 42.92 | 11 | 42.64 | 4 | 42.93 | 11 |
| 48.30 | 11 | 48.19 | 4.5 | 48.04 | 11 |
| 52.95 | 10.5 | 53.03 | 4.5 | 53.37 | 12 |
| 58.19 | 11 | 58.27 | 4.5 | 57.84 | 13 |
| 63.05 | 10 | 62.72 | 4.5 | 63.10 | 13 |
| 67.83 | 11.5 | 67.74 | 4.5 | 68.13 | 14 |
| 73.47 | 9.5 | 73.18 | 5 | 72.81 | 14 |
| 78.11 | 11 | 77.97 | 5 | 77.99 | 14 |
| 82.84 | 11 | 82.39 | 5 | 82.79 | 14.5 |
| 87.88 | 10.5 | 87.63 | 5 | 87.81 | 15 |
| 92.90 | 11 | 92.81 | 5 | 92.99 | 15 |
| 98.15 | 12.5 | 98.22 | 5 | 98.10 | 15.5 |
| 103.20 | 12 | 103.09 | 5 | 102.83 | 16 |
| 45.12 | 12 | 45.01 | 4 | 44.95 | 11 |
Table A2.
Summary of selected measurements of moisture and drying time for FSa, siCl and saGr conducted in conventional oven for variant 1
| Conventional oven (CO) – variant 1 | ||||
|---|---|---|---|---|
| m = 25 g | m = 300 g | |||
| Meas. time | FSa | siCl | Meas. time | saGr |
| t | w avg | w avg | t | w avg |
| (min) | (%) | (%) | (min) | (%) |
| 0 | 2.83 | 3.26 | 0 | 3.02 |
| 20 | 0.27 | 1.82 | 20 | 2.16 |
| 40 | 0.08 | 0.92 | 40 | 1.52 |
| 60 | 0.02 | 0.45 | 60 | 0.84 |
| 80 | 0.02 | 0.25 | 80 | 0.40 |
| 110 | 0.02 | 0.12 | 110 | 0.08 |
| 140 | 0.02 | 0.12 | 140 | 0.03 |
| 170 | 0.02 | 0.12 | 170 | 0.01 |
| 200 | 0.02 | 0.08 | 200 | 0.01 |
| 230 | 0.02 | 0.02 | 230 | 0.01 |
| 1440 | 0.00 | 0.00 | 1440 | 0.00 |
| 0 | 23.10 | 23.37 | 0 | 22.80 |
| 60 | 1.01 | 2.15 | 60 | 16.01 |
| 230 | 0.03 | 0.17 | 230 | 1.44 |
| 1440 | 0.00 | 0.00 | 1440 | 0.00 |
| 0 | 42.65 | 42.78 | 0 | 34.68 |
| 60 | 19.20 | 20.76 | 60 | 26.74 |
| 230 | 0.00 | 0.26 | 230 | 5.90 |
| 1440 | 0.00 | 0.00 | 260 | 3.56 |
| 0 | 63.16 | 63.55 | 290 | 1.71 |
| 60 | 38.38 | 30.05 | 1440 | 0.00 |
| 230 | 0.00 | 0.13 | 0 | 42.96 |
| 1440 | 0.00 | 0.00 | 60 | 32.66 |
| 0 | 83.20 | 83.18 | 230 | 7.02 |
| 60 | 30.19 | 43.00 | 260 | 4.15 |
| 230 | 0.00 | 0.00 | 290 | 2.20 |
| 1440 | 0.00 | 0.00 | 1440 | 0.00 |
| 0 | 102.98 | 103.11 | 0 | 48.05 |
| 20 | 82.60 | 88.30 | 20 | 45.99 |
| 40 | 59.65 | 71.54 | 40 | 43.00 |
| 60 | 41.06 | 50.51 | 60 | 40.09 |
| 80 | 20.68 | 29.68 | 80 | 36.76 |
| 110 | 0.49 | 5.09 | 110 | 32.20 |
| 140 | 0.08 | 0.20 | 140 | 26.65 |
| 170 | 0.00 | 0.04 | 170 | 22.34 |
| 200 | 0.00 | 0.04 | 200 | 17.22 |
| 230 | 0.00 | 0.04 | 230 | 10.68 |
| 1440 | 0.00 | 0.00 | 260 | 7.65 |
| - | - | - | 290 | 4.03 |
| - | - | - | 1440 | 0.00 |
Table B1.
Summary of details, results and recommendations for determining the moisture content of soils in the microwave oven based on previous and own researches
| References | Output power of microwave [W] | Type of soil | Mass of specimen [g] | Drying time [min] | Remarks and recommendations | |
|---|---|---|---|---|---|---|
| 1 | 2 | 3 | 4 | 5 (min) | 6 (max) | 7 |
| Ryley (1969) | 500-2000 | Sand, limestone gravel, clays, organic earth, chalk, coal | 100 | 10 | 15 | 1. Large errors in the case of clay mixed with gypsum. 2. Ignition of coal in the microwave oven. |
| Routledge & Sabey (1976) | - | Loamy sand, clay (with different initial moisture) | 5, 10 and 25 | 5 | 35 | 1. The increase in moisture content and the number of specimens in the cycle increases the duration of the test. |
| Hagerty et al. (1990a, 1990b) | 700 | Sand, silt, clay, tile clay, peat clay, bentonite, loess, aggregate | 50, 100 and 200 | 8 | 105 | 1. Test in cycles: 1 min (2 min) heating, then 1 min cooling and weighing the specimen. |
| Gilbert (1988, 1991) | - | Clays, organic clays, silts, sands, gravels, fly ash (depending on the soil w 0 = 2%–495%) | 20–1280 | 3’38’’ | 30’7’’ | 1. Automated microwave oven drying. 2. Safety instructions. 3. The possibility of exploding soils and rocks. 4. Recommended specimen mass 80 g (100 g) – 200 g. 5. Mixing the soil during drying may cause its loss, which affects the erroneous determination of moisture. |
| Gaspard (2002) | 650 | Clay, silt, sand (depending on the soil w 0 = 27%–45%) | 500 | 11,2 (SMWO) 19,5 (CMWO) | 31,7 (SMWO) 52,7 (CMWO) | 1. Due to costs, the recommendation for SMWO (Standard Microwave Oven) method, not for CMWO (Computer Controlled Microwave Oven). |
| Gołębiewska et al. (2003) | 800 | Loamy sand, silt, clay, clay loam, medium sand | I p =0-10%: 20, 50, 100 I p =10-30%, I p >30%: 10, 30, 60 | 3 | 10 | 1. Control measurement every 1 min in the range from 1–10 min. 2. Dry 3 specimens at the same time. |
| Chung & Ho (2008) | 700-1700 | Silt loam | 100–1000 | 8,5 | 50 | 1. Initial drying for 3 min, for the first minute taking measurement every 10 seconds. |
| Suwandi et al. (2009) | 700 | Clay (depending on the soil w 0 = 67% –174%) | 100–1000 | 14,7 | 22 | 1. Testing procedure based on ASTM D4643-00. |
| Daod (2012) | 900 | Clay, silty clay | 150–200 | - | - | 1. Recommended mass specimen for determination liquidity limit 50-60 g. 2. Measurement in the interval every 10 min. |
| Grymowicz & Jastrzębska (2015) | 800 | Fine sand, silt, clay | 12,5 31,5 1816 | 2 | 40 | 1. Moisture content of all specimens increased by 25% in relation to the initial state. 2. Drying of 5 specimens at the same time. |
| Kramarenko et al. (2015, 2016) | 900 | Clay, clay loam, clay sand, low peat clay (w 0 = 14%–58%) peat (w 0 = 2513%) | 9–100 5–200 | 5 | 17 | 1.1. Recommended drying time: • 30–40 min for peat mass more than 100 g, • 10–15 min for peat mass 30–50 g, • 3–5 min for peat mass 5–10 g. 2. Recommended the intervals between control weighing: • about 3–5 min for peat mass more than 50 g, • 1-2 min for peat mass more than 5-10 g and for low peaty soil. 3. According to ASTM D 4643 – 00 they suggest the mixing of soil at control weighing. |
| Cormick (2015) | - | Fine-grained coarse-grained | 10–250 300–1000 | - | - | 1. Recommended specimen mass of 150 g. 2. Continuous drying for the first 3 min and then every 1 min with mass measurements after each heating cycle, keeping 1 min cooling period before weighing. 3. Do not dry the soils with organic content above 10% and bentonites with moisture content greater than 110%. |
| Jalilian et al. (2017) | 90-180-360-600 and 900 | Sieved and unsieved soil specimens with 10cc twice of distilled water | 50 | 5 | 10 | 1. Heating cycles of 5 min and 10 min with 1 min cooling before weighing. 2. Recommended heating power 600 W. 3. Recommended heating time 10 min. min cooling before weighing. |
| ATT-15/96 Kanada | max. possible | - | min. 250 | - | - | 1. Dry 1 specimen in a cycle. 2. Use the same specimen mass and microwave heating level. 3. Measurement from 5 min after starting in the interval every 2 min, to stabilize the mass through the specimen. |
| ASTM 2000 ASTM 2008 USA | 700 | Most of the soil types. Caution in the case of the soil types: • soil containing significant amounts of halloysite, mica, montmorillonite, gypsum or other hydrated materials • highly organic soils • soils in which the pore water contains dissolved solids | 100–1000 (depending on the grain size) | 3 | - | 1. According to ASTM 2000; initial drying for 3 min and then in cycles every 1 min. Mass measurements after each cycle after 1 min (or no) cooling. 2. According to ASTM 2008; heating without a break in accordance with the time determined on the basis of nomograms. 3. Mix the soil between drying cycles. 4. Do not use specimens smaller than 100 g due to the possibility of overheating. |
| Jastrzębska | 800 | Fine sand, silty clay, sandy gravel (specimens with different moisture w 0 = 3%–103%) | 25–300 | 2 | 17 | 1. Measurement up to 5 min in the intervals every 30 seconds, then every 1 min to stabilize the mass through the specimen. 2. The need to cover specimens due to the possibility of exploding. |