
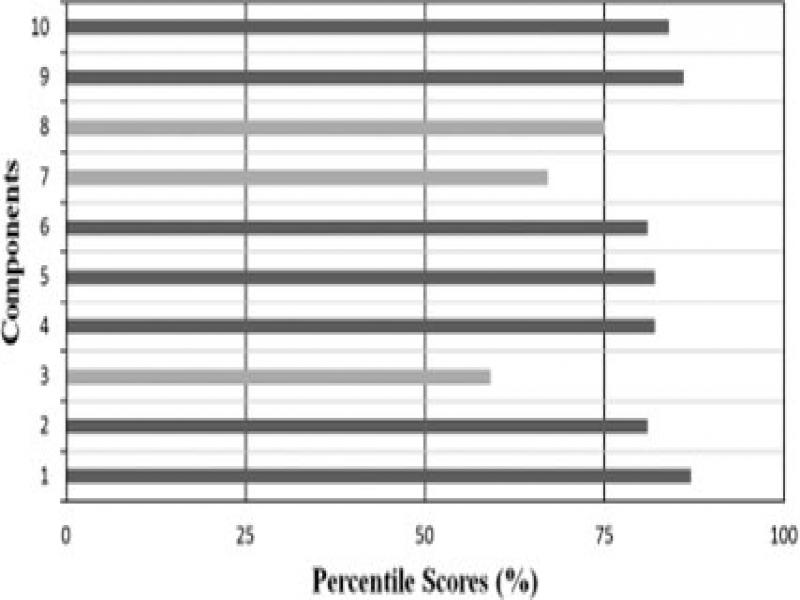
Figure 1.
Percentile scores for organizational safety climate components
Table 1.
Organizational safety climate
| Components | Level of Agreement | Percentile Score (%) | Rate of Performance | |||||
|---|---|---|---|---|---|---|---|---|
| SA | A | N | D | SD | ||||
| 1. | It is common for employees to take part in identifying and eliminating worksite hazards. | 87 | 96 | 8 | 5 | 0 | 87 | High |
| 2. | There are frequent contact and communication between employees and management. | 85 | 46 | 57 | 7 | 1 | 81 | High |
| 3. | Safety takes a back seat to production. | 24 | 48 | 22 | 98 | 4 | 59 | Above Average |
| 4. | Employees often get involved in developing or revising worksite safety and health practices. | 69 | 86 | 32 | 8 | 1 | 82 | High |
| 5. | My supervisor maintains a high standard of job safety performance. | 84 | 63 | 35 | 13 | 1 | 82 | High |
| 6. | Detailed inspections of the facilities are made at regular, frequent intervals. | 60 | 101 | 26 | 7 | 2 | 81 | High |
| 7. | Management’s views on the importance of safety are seldom stressed in employee communications. | 31 | 44 | 85 | 34 | 2 | 67 | Above Average |
| 8. | Safety meetings are held less often than they should be. | 42 | 96 | 28 | 25 | 5 | 75 | Above Average |
| 9. | Good teamwork exists among departments. | 82 | 91 | 19 | 3 | 1 | 86 | High |
| 10. | Management shows that it cares about employee safety. | 96 | 65 | 21 | 11 | 3 | 84 | High |
Table 2.
Safety support climate
| Components | Level of Agreement | Percentile Score (%) | Rate of Performance | |||||
|---|---|---|---|---|---|---|---|---|
| SA | A | N | D | SD | ||||
| 1. | I can protect myself and coworkers through my actions while on the job. | 65 | 105 | 17 | 8 | 1 | 83 | High |
| 2. | My supervisor’s behavior often goes against safe job procedures. | 8 | 66 | 28 | 87 | 7 | 58 | Above Average |
| 3. | Designated employees are well trained in emergency practices, including evacuation. | 43 | 119 | 17 | 13 | 4 | 79 | High |
| 4. | Management has published a written policy that expresses their attitude about employee safety. | 83 | 78 | 24 | 9 | 2 | 84 | High |
| 5. | Near miss accidents/incidents are thoroughly investigated. | 69 | 68 | 45 | 13 | 1 | 79 | High |
| 6. | Employee morale is poor. | 32 | 21 | 31 | 69 | 43 | 53 | Above Average |
| 7. | Management does no more than the law requires to keep employees safe. | 15 | 77 | 56 | 33 | 15 | 64 | Above Average |
| 8. | I understand the safety and health regulations relating to my job. | 106 | 62 | 16 | 12 | 0 | 87 | High |
| 9. | My supervisor enforces safe job procedures. | 98 | 70 | 21 | 6 | 1 | 86 | High |
| 10. | Standardized precautions are used by employees who deal with hazardous materials. | 55 | 88 | 22 | 31 | 0 | 77 | High |
Table 3.
Safety support activities
| Components | Level of Agreement | Percentile Score (%) | Rate of Performance | |||||
|---|---|---|---|---|---|---|---|---|
| SA | A | N | D | SD | ||||
| 1. | Management has provided adequate staff to manage and support its safety program. | 52 | 114 | 24 | 6 | 0 | 82 | High |
| 2. | Awards and recognition programs used in this company are not good for promoting safe employee behavior. | 29 | 33 | 39 | 93 | 2 | 59 | Above Average |
| 3. | Job performance standards are higher for production than for safety. | 27 | 41 | 68 | 60 | 0 | 64 | Above Average |
| 4. | My supervisor understands the job safety problems I face. | 61 | 106 | 20 | 9 | 0 | 82 | High |
| 5. | Employees are familiar with and follow regular lockout/tag out procedures. | 38 | 80 | 65 | 11 | 2 | 74 | Above Average |
| 6. | Safety training is part of every new employee’s orientation. | 80 | 93 | 16 | 4 | 3 | 85 | High |
| 7. | I believe management is sincere in its efforts to ensure employee safety. | 80 | 78 | 35 | 2 | 1 | 84 | High |
| 8. | My supervisor seldom acts on employee safety suggestions. | 105 | 53 | 21 | 13 | 4 | 85 | High |
| 9. | Emergency response procedures are almost never tested to ensure that they are working. | 33 | 25 | 45 | 75 | 18 | 58 | Above Average |
| 10. | The work of the employee and management safety committee improves safety conditions. | 69 | 89 | 28 | 8 | 2 | 82 | High |
Table 4.
Management involvement
| Components | Level of Agreement | Percentile Score (%) | Rate of Performance | |||||
|---|---|---|---|---|---|---|---|---|
| SA | A | N | D | SD | ||||
| 1. | Management sets a positive safety example through their words and actions. | 64 | 92 | 28 | 9 | 3 | 81 | High |
| 2. | My supervisor has successfully fit safety into the production process. | 106 | 52 | 24 | 13 | 1 | 85 | High |
| 3. | The system of preventive maintenance for facilities, tools, and machinery operates poorly. | 18 | 61 | 38 | 78 | 1 | 62 | Above Average |
| 4. | Management regularly participates in safety program activities. | 71 | 86 | 22 | 15 | 2 | 81 | High |
| 5. | The safety coordinator has high status in this organization. | 74 | 68 | 38 | 16 | 0 | 80 | High |
| 6. | Hazards that are not fixed right away by supervisors are often ignored. | 9 | 35 | 77 | 33 | 42 | 53 | Above Average |
| 7. | Employees take part when accident or incident investigations occur. | 27 | 60 | 63 | 38 | 8 | 66 | Above Average |
| 8. | The training provided by my supervisor helps me to do my job safely. | 38 | 105 | 25 | 18 | 10 | 75 | Above Average |
| 9. | Medical facilities are sufficient for treating the injuries that occur. | 54 | 101 | 16 | 14 | 11 | 78 | High |
| 10. | It is well known that management ignores a person’s safety performance when determining raises and promotions. | 75 | 70 | 33 | 16 | 2 | 80 | High |
Table 5.
Employees and supervisors participation
| Components | Level of Agreement | Percentile Score (%) | Rate of Performance | |||||
|---|---|---|---|---|---|---|---|---|
| SA | A | N | D | SD | ||||
| 1. | The safety coordinator is readily available to provide advice and assistance. | 63 | 96 | 24 | 11 | 2 | 81 | High |
| 2. | This organization has a stable workforce. | 95 | 52 | 34 | 9 | 6 | 83 | High |
| 3. | Employees are afraid to report safety problems to their supervisors. | 27 | 36 | 66 | 50 | 17 | 61 | Above Average |
| 4. | My supervisor always investigates lost workday cases. | 42 | 114 | 15 | 24 | 1 | 78 | High |
| 5. | Ventilation, lighting, noise, and other environmental conditions are kept at a good level. | 55 | 88 | 41 | 11 | 1 | 79 | High |
| 6. | Many employees do not use the PPE necessary to do their jobs safely. | 9 | 48 | 21 | 74 | 44 | 50 | Above Average |
| 7. | There are job stress problems from my coworkers. | 19 | 69 | 60 | 37 | 11 | 65 | Above Average |
| 8. | Management insists that supervisors think about safety when doing their jobs. | 101 | 60 | 20 | 11 | 4 | 85 | High |
| 9. | Management annually sets safety goals for which all employees are held accountable. | 55 | 88 | 30 | 19 | 4 | 77 | High |
| 10. | Employees rarely takepart in the development of safety requirements for their jobs. | 69 | 74 | 41 | 12 | 0 | 80 | High |
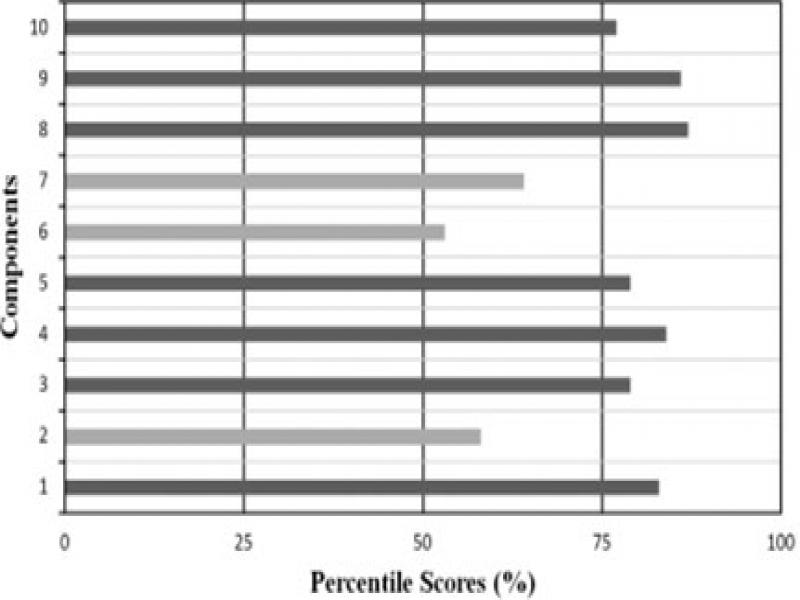
Figure 2.
Percentile scores for safety support climate components
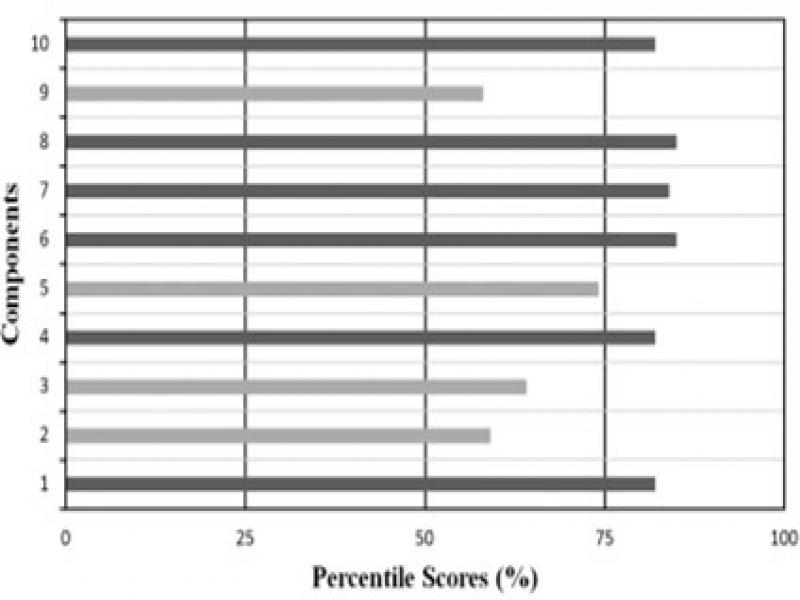
Figure 3.
Percentile scores for safety support activities components
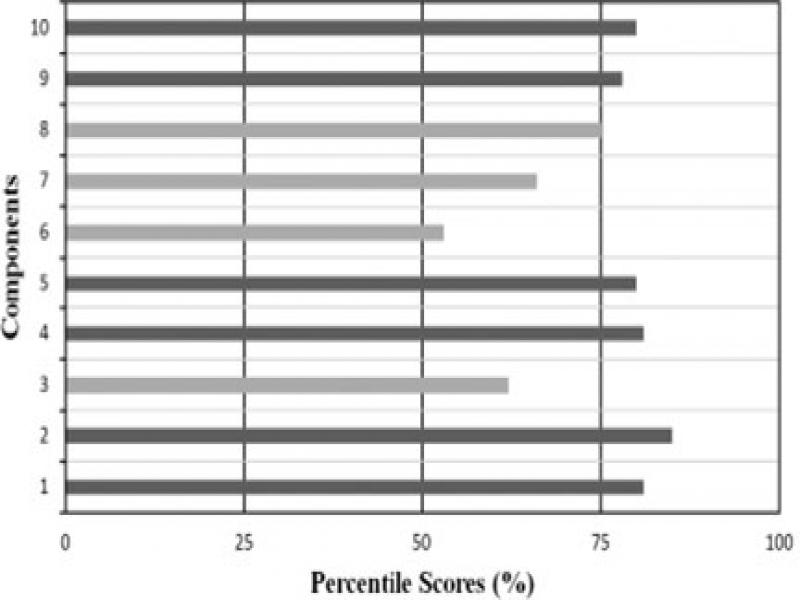
Figure 4.
Percentile scores for management involvement components
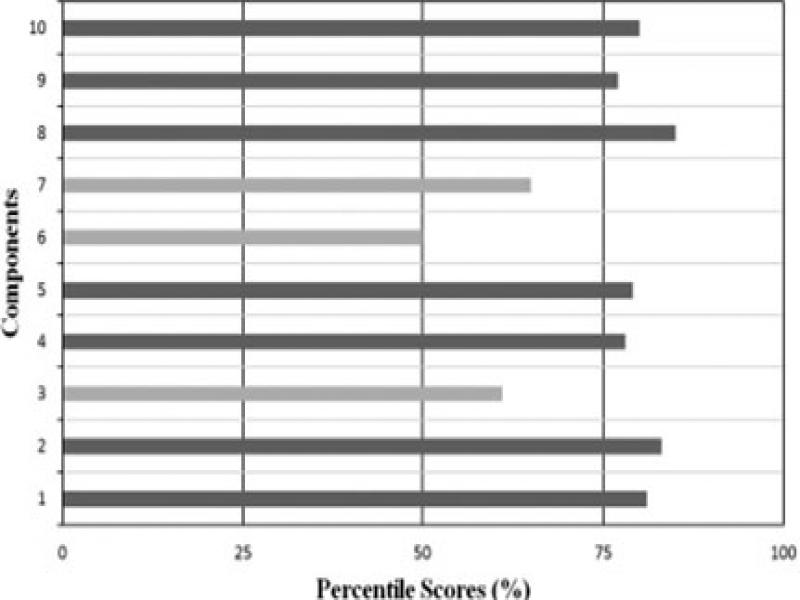
Figure 5.
Percentile scores for employees and supervisors participation
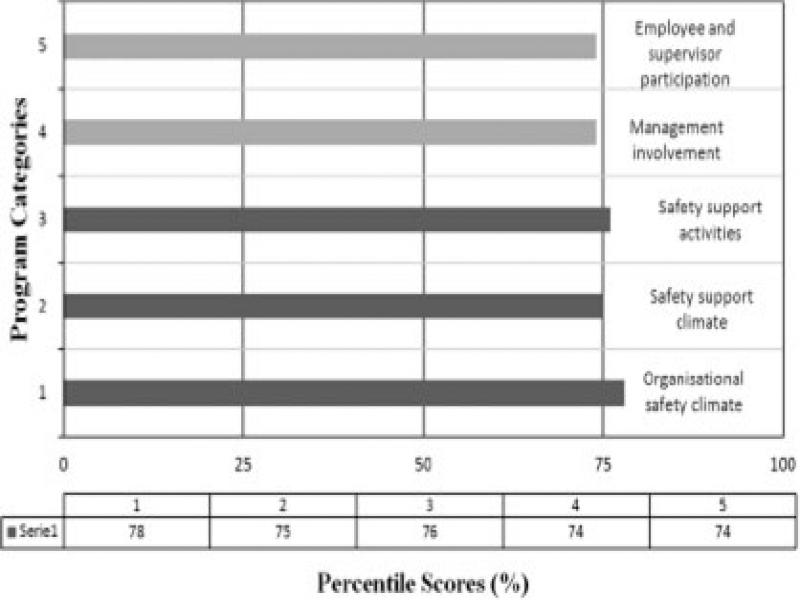
Figure 6.
Percentile scores by program category