
Table 1
Background Demographics of SSAFA Caseworker Respondents.
| RESPONDENTS | NUMBER | % |
|---|---|---|
| Questionnaires distributed | 76 | (100%) |
| Questionnaires returned | 21 | (27.6%) |
| Focus group membership offered | 76 | (100%) |
| Focus group members | 6 | (7.8%) |
| Sex of questionnaire respondents (n = 21) | ||
| Male | 15 | (71.4%) |
| Female | 5 | (23.8%) |
| Prefer not to say | 1 | (4.7%) |
| Ethnicity of questionnaire respondents (n = 21) | ||
| White – English/Welsh/Scottish/Northern Irish/British | 20 | (95.2%) |
| Prefer not to say | 1 | (4.7%) |
| Age range of questionnaire respondents (n = 21) | ||
| 45–54 years | 2 | (9.5%) |
| 55–64 years | 5 | (23.8%) |
| Over 65 | 14 | (66.7%) |
| Employment of questionnaire respondents (n = 21) | ||
| Full-time employment | 3 | (14.3%) |
| Part-time employment | 3 | (14.3%) |
| Not currently employed | 1 | (4.7%) |
| Retired | 14 | (66.7%) |
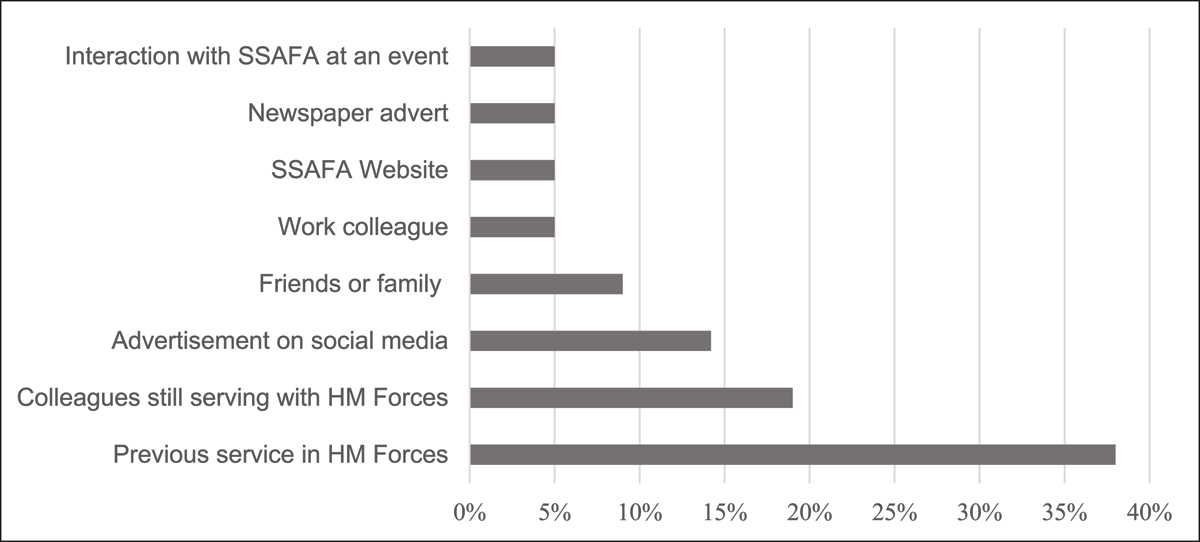
Figure 1
How SSAFA Volunteer Caseworkers First Become Aware of the Role.
Table 2
Respondents’ Motivations for Volunteering as a Caseworker.
| RESPONDENTS (n = 21) | NUMBER | % |
|---|---|---|
| Motivation | ||
| Wanting to put existing knowledge and experience to good use | 19 | (90.4%) |
| Wanting to help former military personnel | 17 | (80.9%) |
| Supporting veterans in their community | 17 | (80.9%) |
| As former military giving something back | 16 | (76.1%) |
| Supporting those less fortunate | 15 | (71.4%) |
| Developing confidence and experience of caring for people | 8 | (38%) |
| Exploring own strengths and developmental needs | 6 | (28.6%) |
| Increasing self-esteem | 5 | (23.8%) |
| A relative in the military | 5 | (23.8%) |
| A friend/relative volunteers with SSAFA | 4 | (19%) |
| I wanted to make new friends and/or for social aspects | 4 | (19%) |
| Good on my Curriculum Vitae and/or job applications | 1 | (4.7%) |