
I am a half-a-century-old economist and Marine Corps veteran who served in the First Gulf War at the age of 19. According to recent public opinion polls (Saad, 2023), I have been fortunate to serve when Americans had high levels of trust in United States institutions. I have also been fortunate to use my veteran’s benefits to attend college and obtain a Veterans Affairs (VA) home loan/mortgage to purchase a home in the United States. After reading some recent scholarly studies weighing the socioeconomic advantages and disadvantages of military service for the life course, I became curious about one shared experience with my peers who also transitioned to adulthood during the First Gulf War. Specifically, I wondered how many in this group achieved what Goodman and Mayer (2018) continue to describe as the American dream of homeownership and whether veterans within this group ended up with homes with higher or lower property values.
To explore such questions, I started with advice that researchers should pay close attention to differences in the era of service, especially exposure to combat, and the timing of the service during the veteran’s life course (MacLean & Elder, 2007). In other words, when considering the advantages or disadvantages of military service, I should not lump all veteran experiences together into a single grand narrative. Accordingly, I focused my study on individuals who joined the US all-volunteer force and transitioned to adulthood during the first large-scale military conflict since Vietnam—the First Gulf War (1990–1991). In this essay, I describe and interpret what I have found.
Since the United States adopted the all-volunteer force in 1973, many young adults have viewed military service as a pathway to meet future life goals (Kelty et al., 2010). Pointing to that pathway, many still ask me if I joined the Marine Corps directly from high school because of the economic advantages that it offered. I am confident I did weigh some of those pros and cons during that decision, but it did not involve a formal cost-benefit calculation. Still, even though it has been a long time ago and memories fade, I distinctly remember one “calculation” I made when trying to persuade my parents that enlisting was a good choice. By my reckoning, at 17, I would live to be 100 years of age, and four years of active duty would come out to four percent of my life. Hence, I could complete four years of honorable service in one of America’s trusted institutions and meet the American dream of a college education and homeownership. Yes, Mom and Pop, I hope the calculation persuades you that the pros outweigh the cons–please sign the permission line here. Of course, two years later, as I prepared to join the breach of Sadaam Hussein’s mine belts with the 2nd Battalion, 12th Marines, I wondered whether my young back-of-the-envelope life expectancy calculation might have been mistaken–off by a factor of five. However, I digress–forgive me.
In the last two decades, scholars have tried to formally categorize and count how military service has created life course advantages and disadvantages for young adults (e.g., marriage, crime, health, social, or economic outcomes) (Angrist, 1998; Coile et al., 2015; Dávila & Mora, 2012; Kleykamp, 2006; Kleykamp, 2013; MacLean & Elder, 2007; Teachman & Tedrow, 2007). One important economic outcome, homeownership, is the focus of this essay because it is an area I have studied as an economist. In addition, elected officials have recently tried to increase awareness of programs to help veterans looking to buy a home (VA Home Loan Awareness Act, 2023). For instance, the VA Loan Guaranty Program provides eligible veterans with mortgage insurance to reduce private lender loan risks. In fiscal year 2017, it supported 740 million purchase and refinance loans for veterans, with a total guarantee of $47 billion (Perl, 2018). Historically, programs like these have increased homeownership rates by accelerating when veterans become homeowners (Fetter, 2013). My experience is consistent with Fetter’s (2013) acceleration story because my wife and I would not have been able to qualify to purchase our home as early in our lives as we did without such programs.
Although homeownership with a mortgage is a first step in building housing wealth, a more significant life milestone occurs after paying off the mortgage. Although it is a less common practice in the United States today, many of us who transitioned to adulthood in the late 20th century may remember celebrations after a homeowner made their last housing payment. Historically, when this happened, homeowners often held a party with family and friends and set fire to a copy of the mortgage document to celebrate or “burn the mortgage” (Joffe-Walt, 2009). The practice was familiar enough to be written into the plots of several popular American television comedy dramas (Joffe-Walt, 2009). For example, in the M*A*S*H television series that depicted US military personnel serving in the Korean War, an episode uses the phrase “burn the mortgage” in the storyline. In the episode, the character Hawkeye receives a letter from Colonel Potter’s wife that she has paid off the mortgage and asks them to throw a surprise mortgage-burning party for him (Switzer, 1982). Including the practice in the plot suggests that the American target audiences would recognize it as important. As the series usually did, the primary plot creates dissonance for the audience between the light-heartedness of the surprise party preparation for economic achievement and the serious setting of the challenges service members face in a combat zone. I sensed a similar dissonance while completing the research project about economic incentives and military service and thinking about my own experiences during the First Gulf War. But I chose to keep my economist hat on and continue moving forward.
Today, paying off a mortgage is still considered an achievement, but mortgage-burning parties like Colonel Potter’s have all but disappeared (Joffe-Walt, 2009). Put another way, my wife and I will likely not celebrate paying off my VA mortgage by burning the copies of the associated paperwork. Nevertheless, I still wanted to know how many American homeowners who transitioned to adulthood during the First Gulf War achieved owned a home without a mortgage and whether veterans in this group owned homes with higher or lower property values. After searching for those numbers, I could reflect on what they mean to me, especially considering recent recruiting trends for the US all-volunteer force.
Data and Methods
To answer the research questions, I had to choose an accessible and well-known US individual-level survey that protects individual privacy, includes measures of veteran status, and uses a sampling design that provides a nationally representative sample of the US population. By using the data and sharing what I learned, I hope other veterans become more aware of these resources and are encouraged to explore other questions important to them. Since I focus on the United States, I selected the American Community Survey (ACS) created by the US Census Bureau. In their words, “The American Community Survey (ACS) helps local officials, community leaders, and businesses understand the changes taking place in their communities. It is the premier source for detailed population and housing information about our nation” (US Census Bureau, 2024a). One advantage of the survey is that it asks respondents about their veteran status and era of service, along with other relevant demographic and housing characteristics I wanted to consider.
The specific data version of the ACS data that I use is the Census Bureau’s American Community Survey Public Use Microdata Sample provided by IPUMS USA version 13 (Ruggles et al., 2023). I chose the latest 5-year estimates collected for 2017–2021, which the Bureau reports is the largest sample size and provides data for all areas (US Census Bureau, 2023).
I begin by identifying individuals who:
own their homes without a mortgage or loan and
were young adults (ages 18 to 23) during the First Gulf War.
The sample was limited in several ways. First, I restricted the group to individuals born between 1968 and 1973 who received a GED, high school diploma, or bachelor’s degree. At the time of the survey response, the homeowner was self-employed, or worked for wages or salaries. Their self-reported household income and home value1 was $10 thousand or above. Every homeowner in the sample reported owning a single-family residence “free and clear” without a mortgage or loan. To further narrow my selection of a veteran service profile, I used self-reported answers about their veteran status and era:
Veteran Status (VETSTAT): Veteran,
Veteran 1990–2001 (VET90X01): Yes, served this period, and
Veteran 2001 or later (VET01LTR): No.
Using the birth year restrictions, veteran status, and self-reported era of service, I was able to consider homeowners who were more likely to have served during the First Gulf War and spent less than ten years on active duty. Given the survey design, it is not a perfect solution, but it gets me as close as possible to the targeted sample population.
As shown in Table 1, the overall sample included over 50 thousand people who achieved the goal of owning a single-family home without a mortgage or loan. In terms of Census-defined social categories, just under half (47%) have a bachelor’s degree, 74% of the sample self-reported as white, and 47% self-reported as female. The sample includes 1,600 veteran homeowners (3%) who only served activity duty between 1990 and 2001.
Table 1
Homeowner Sample Who Transitioned to Adulthood During the First Gulf War: Comparing Homeowners Who Own Their Residence Without a Mortgage or Loan (2017–2021).
| VARIABLE | VETERAN | NO MILITARY SERVICE | DIFFERENCE |
|---|---|---|---|
| Self-reported single-family house value (1,000) | $233 | $303 | –$70 |
| (317) | (427) | (10.6) | |
| Bachelor’s degree (1 = yes; 0 = No) | 0.41 | 0.47 | –0.06 |
| (0.49) | (0.50) | (0.01) | |
| Total household income (1,000) | $119.3 | $128.5 | $–9.2 |
| (91.9) | (119.6) | (3.0) | |
| Female (1 = yes; 0 = no) | 0.12 | 0.48 | –0.36 |
| (0.33) | (0.50) | (0.01) | |
| White (1 = yes; 0 = no) | 0.79 | 0.74 | 0.05 |
| (0.41) | (0.44) | (0.01) | |
| Married | 0.65 | 0.65 | –0.01 |
| (0.48) | (0.48) | (0.01) | |
| Times married | 1.22 | 1.04 | 0.17 |
| (0.74) | (0.65) | (0.02) | |
| Number of bedrooms | 4.26 | 4.33 | –0.07 |
| (0.90) | (0.91) | (0.02) | |
| Number of own children in the household | 1.05 | 1.09 | –0.04 |
| (1.17) | (1.16) | (0.03) | |
| Lives in birth state (1 = yes; 0 = no) | 0.55 | 0.59 | –0.04 |
| (0.50) | (0.49) | (0.01) | |
| The number of respondents in the sample | 1,642 | 51,819 | 53,461 |
[i] Source: Ruggles et al. (2023).
Using the sample, I first compared veterans with peers without military service. The average self-reported home value shows significant differences between non-veterans and veterans. The average value for the non-veteran was $300 thousand compared to $233 thousand, a noticeable $70 thousand difference (See Table 1). Next, I considered several population characteristics to see if the two groups looked similar. The difference between average household income was about $9 thousand. Veterans in the sample were also more likely to be white men, less likely to have a bachelor’s degree, had more marriages, and were less likely to live in their birth state. In sum, the two groups look different in several ways. So, although we observe that veterans, on average, own homes with lower home values, we could not interpret the differences as being “caused” by military service.
Before moving forward with my analysis, I share one last reflection and limitation about my selected sample. As shown in Table 1, 79% of my veteran sample self-reported as white.2 However, for veterans in the American Community Survey, only 75% of all veterans self-reported that they were white alone, not Hispanic or Latino (US Census Bureau, 2024b). The quick comparison reminds us that the veteran experience of seeking the American dream of homeownership differs by race. We know that history shows government policy enforced residential segregation during the post-World War II housing boom and led to disparities in achieving homeownership for African American veterans (Rothstein, 2017). Today, other researchers have pointed to new barriers that have emerged after the all-volunteer force was adopted (Massey, 2005). For example, Williams et al. (2005, p. 204) conclude that “less desirable loan terms, exposure to predatory practices, and a lack of consumer protection” against low-income and racial groups have led to new disparities in home ownership. In sum, my sample analysis may miss questions important to veterans seeking homeownership today.
Next, I attempt to improve the estimate of the size of the difference in home values in my sample using multiple regression analysis. Regression analysis can get us closer to making a better apples-to-apples comparison that controls for the differences we observe in Table 1. The equation for the model is:
The dependent variable ln(valuei) is the log of the home’s value that the homeowner i reported. The matrix Xi includes control variables in Table 1:
bachelor’s degree,
current household income,
female (1 = yes; 0 = no),
white (1 = yes; 0 = no),
whether the person is married (1 = yes; 0 = no),
number of marriages,
number of rooms in the home,
number of children, and
whether they live in the state where they were born (1 = yes, 0 = no).
Two group controls are also included. The first group is geography, consisting of all 50 states and Washington, DC, which helps account for some but not all differences in regional housing markets. The second group control is the year the person responded to the ACS 5-year estimate, including 2017–2021, to account for year-to-year variation in housing prices that all respondents experienced. Lastly, ui is the error term.
The regression model parameter of interest is the percentage difference in the home value between veterans and non-veterans (β). As Eggleston and Holder (2017) have suggested, service member experiences such as frequent deployments and moves and short-term living arrangements may delay wealth-building activities like homeownership. In other words, if the value of β is negative and large, the data could indicate that these experiences may determine the type, location, and value of the single-family residence they ultimately own, and that value could be lower than a similar peer who did not have military service.
Results
In the sample used, over 1,600 veterans transitioned to adulthood during the First Gulf War and ultimately owned a single-family residence without a mortgage or loan after completing their service. Despite the achievement, joining the all-volunteer force was associated with lower values than similar peers without military service. As shown in Table 2, β, the coefficient for veterans is negative. Using the full regression model results that include demographic and state and year group effects (Model 3), the average veteran home value is about 10% lower than the non-veteran comparison group. Since the average home value in the sample was $300 thousand, 10% represents a difference of $30 thousand.
Table 2
All Homeowners Who Transitioned to Adulthood During the First Gulf War: Joining the All-Volunteer Force Was Associated with Lower Housing Wealth.
| DEPENDENT VARIABLE: LN (HOME VALUE) | |||
|---|---|---|---|
| INDEPENDENT VARIABLES | MODEL 1 | MODEL 2 | MODEL 3 |
| Veteran (β) | –0.147 | –0.155 | –0.109 |
| Robust standard error | (0.027) | (0.025) | (0.023) |
| % Δ home value = 100[exp(β)–1)] | –13.7% | –14.4% | –10.3% |
| Xi (see demographic characteristics in Table 1) | No | Yes | Yes |
| State and year group effects | No | No | Yes |
| Observations | 53,461 | 53,461 | 53,461 |
| R-squared | 0.116 | 0.301 | 0.447 |
[i] Note: The sample includes homeowners who own their single-family residence without a mortgage or loan. Standard errors are calculated using the Huber/White/sandwich estimator.
The size of the estimate is comparable with the only other housing wealth comparison found by Eggleston and Holder (2017). Their study used a 2013 sample that included similar-aged veteran homeowners (ages 45–54 in 2013) with and without mortgages and found the differences in median home equity of $40 thousand (expressed in 2021 dollars). To put that number in perspective, the median net worth for that group of veterans was $127 thousand (expressed in 2021 dollars).3
I also examined other sample characteristics associated with high self-reported home values. In Figure 1, the three control variables in Model 3 with the most economically significant positive associations with home values, with all effects exceeding 10%. The social categories are interesting because they illustrate differences in home values by the categories. The largest is completing a bachelor’s degree (34% higher than GED and high school only), followed by white (21% higher than non-white), and currently married (10% higher than non-married). In sum, college-educated, white, or married adults who transitioned to adulthood during the First Gulf War who own a home have significantly higher housing wealth (as measured by self-reported home values). In contrast, average home values for those with a GED or high school diploma who identify as non-white, and unmarried were lower.
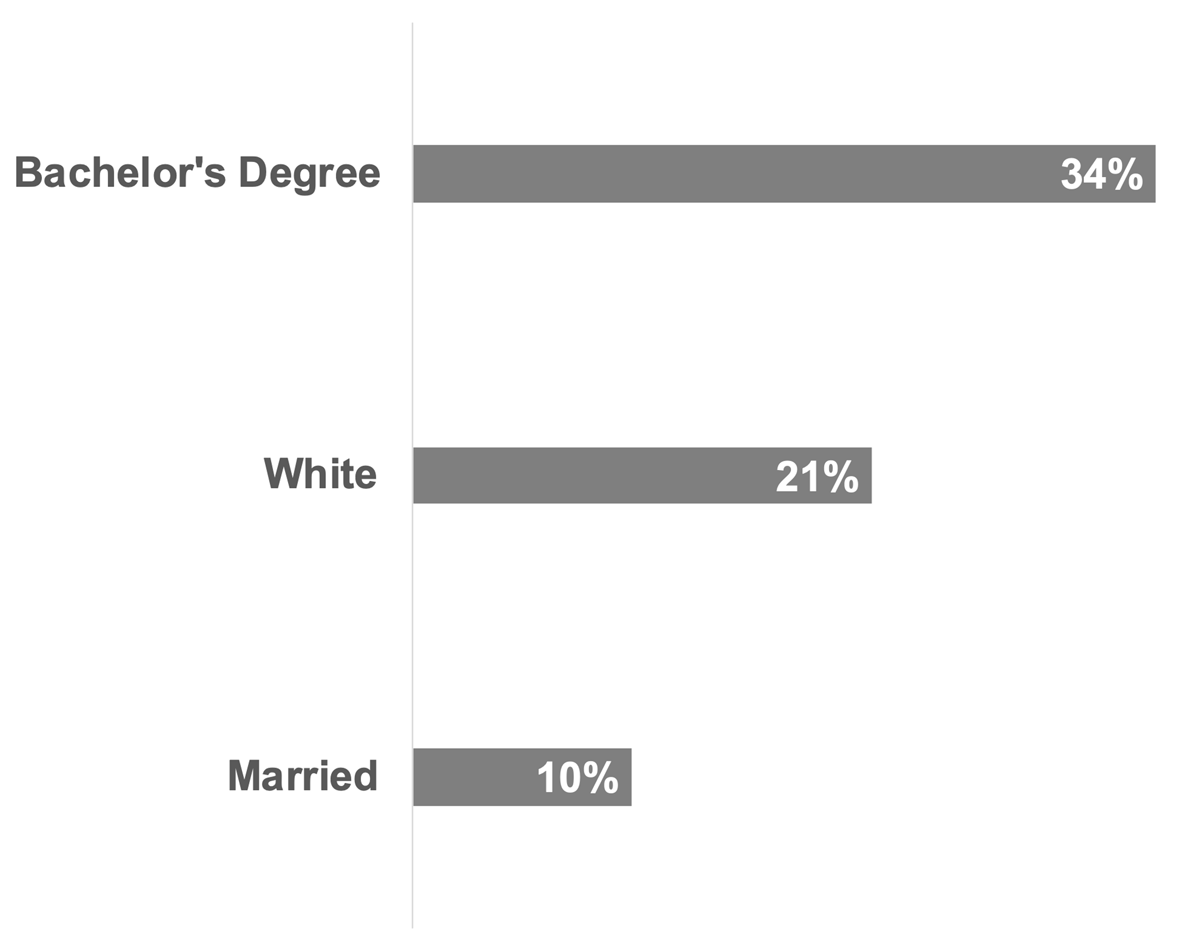
Figure 1
All Homeowners Who Transitioned to Adulthood During the First Gulf War: Variables with Economically Significant Positive Associations with Self-Reported Home Values (Percent Increase).
Discussion
What did I learn about some of my peer homeowners born between 1968 and 1973? First, many have achieved the American dream of homeownership and have paid off a mortgage. Data from the ACS (2017–2021) included a nationally representative sample of over 50 thousand people who have reached that milestone. Moreover, using statistical survey guidance and sampling weights provided by the census, the sample represents an estimated one million people across the US, including 30 thousand veterans who reported active-duty military service in the US armed forces between August 1990 and August 2001. Those homeownership numbers seem encouraging to me, and future work could examine and describe who these veterans are in more detail. Second, a comparison of the single-family home values of these veterans shows that, on average, veteran home values were $30 thousand lower (10%) than those of similar peers who did not serve. Given my experience with delays after service of wealth-building education and homeownership activities, the difference is consistent with my experience and not surprising. Despite achieving homeownership without a mortgage, I also observed significant disparities in home values by education and race. Exploring the descriptive results and reflecting on my sample made me wonder whether the veteran status of age-cohort peers made the disparities better or worse. It is a question worth exploring in the future.
With this information, let us return to my choice to volunteer for the Marines in 1989 and ask, “Would knowing this difference influence my decision to volunteer?” The home value difference is an interesting economic fact, but I doubt it would have influenced my decision. I wasn’t aware of any potential homeownership benefits when I enlisted. Although I knew of other potential economic advantages of America’s all-volunteer force, anticipated differences in future homeownership wealth did not tilt the cost-benefit scales when I volunteered. Instead, I thought voluntary military service would offer me a meaningful way to address my uncertainties about transitioning to adulthood, allow me to participate in a trusted American institution and tradition, and potentially lend me a helping hand toward higher education goals if I chose such a path. Reflecting on my experience, these factors, rather than pure economic calculations, were the primary driving force for me to volunteer.
Conclusion
In closing, when I entered the all-volunteer force 49% of US adults had a great deal or quite a lot of confidence in nine US institutions, as measured by Gallup (Saad, 2023). Today, that number stands at just 26%, its lowest point since 1973. Unlike the homeownership wealth differences I found in this essay, the size of the differences in institution trust is jarring. Moreover, the numbers led me to ask and seriously consider whether I would have the same enthusiasm for volunteering for military service today as I did in 1989. After completing this project, I concluded that such social trends–not future homeownership wealth differences—may be one of the most menacing long-term problems the US all-volunteer force has faced.
Notes
[3] For example, the American Community Survey question asks respondents: About how much do you think this house and lot, apartment, or mobile home (and lot, if owned) would sell for if it were for sale?
[4] Specifically, I use the IPUMS variable RACHSING (IPUMS USA, 2024). According to IPUMS, “RACHSING codes race and Hispanic origin responses into a simple, historically compatible scheme that includes only federally defined race and Hispanic origin (ethnicity) groups.”
[5] To adjust the 2013 values for inflation, I used the ratio of the average annual CPI (CUUR0000SA0) for 2021 and 2013 (271 and 233) and applied it to the values in Table 2 of Eggleston and Holder (2017). Since the study was approximately a decade earlier than my sample, I used the age group 45–54 years for comparisons.
Ethics and Consent
IPUMS is distributed for public use, and as a result, ethics approval is not required. I also agreed to IPUMS data terms of use as a registered user. I have agreed not to redistribute the data without permission. For IPUMS USA Sample data, I may publish a subset of the data to meet journal requirements for accessing data related to a particular publication.
Competing Interests
The author has no competing interests to declare.