
Introduction
The nature of learning activities in technology education can be quite varied, but design activities are a typical pedagogical approach within the field (Stables, 2020). Learning through design (Buckley et al., 2021) sees technology students produce creative works, and it is imperative that an assessment mechanism exists for these types of output which is valid, reliable, and feasible. Traditionally, and still in the majority of cases, learning has been assessed through criterion-referenced rubrics whereby qualities of learners’ work are graded, often numerically, against a series of pre-defined criteria. However, issues with this type of assessment exist for creative works. Two main limitations of the use of such rubrics as described by Sadler (2009) are that (1) the professional holistic impression a teacher holds of a piece of work may be categorically at odds with the outcome of that work when measured against a rubric, and that (2) a piece of work may have a quality that is deserving of reward, but the rubric is not sufficiently comprehensive to acknowledge it. In response to these issues with criterion-referenced assessment, the use of adaptive comparative judgement (ACJ) for assessment has been being explored for integration into technology education for the last two decades, initially through the e-scape project (cf. Kimbell et al., 2009), but there has been a notable increase in interest since a special issue on the topic was published in the International Journal of Technology and Design Education (Williams & Kimbell, 2012)
What makes ACJ different to criterion-referenced assessment is that, rather than ask examiners or assessors to assign numerical scores to pieces of work against criteria, they are instead asked to make binary decisions between pairs of pieces of work and select which of the two is better (see Hartell & Buckley, 2021 for a more detailed description). The idea of which piece of work is better is usually described with more nuance, such as which piece of work shows more evidence of learning or capability. How this is described will relate to the purpose of the assessment. For example, Whitehouse and Pollitt (2012) asked assessors to make comparisons based on “evidence of a higher level of development” when using ACJ for summative assessment in a geography task, while Bartholomew et al. (2022) used ACJ formatively in the middle of a design activity asking which piece of work was more “strong” in fulfilling specified criteria. By changing the assessment question from the assignment of a score against a criterion to a binary judgement the process becomes much more reliable by capitalizing on Thurstone’s (1927) Law of Comparative Judgment. Furthermore, ACJ usually involves a cohort of assessors or “judges” making these decisions individually on a sample of portfolios and these decisions are then combined to produce the results of the assessment process. As a process, it does not matter how many judges there are. The generation of a rank is based on the results of comparisons, not by how many people made comparisons. Where the number of judges comes into the decision process relates to feasibility. ACJ becomes more reliable as more comparisons are made and thus a certain level of reliability may be desired and require a corresponding number of comparisons to be made (see Verhavert et al., 2019 for a meta-analysis on this issue in the context of comparative judgement). If this is the case, and suppose 1,000 comparisons are required, increasing the number of judges reduces the load on any individual judge. Judges can also be along a continuum of novices to experts depending on the purpose of the assessment.
The outputs of the ACJ process include a ranking of all included work from best to worst, and misfit statistics which indicate judge agreement within the group and portfolios which had more or less disagreement in their position. The ranking of portfolios is relative in that absolute indicators of quality are not provided such that the range could be, in reality, all excellent work, all poor work, or a range from anywhere in-between. Usefully, the rank also indicates relative differences between pieces of work through ability scores (also known as parameter values). As ACJ typically involves several assessors all making these pairwise comparisons on a collection of student works, by incorporating the views of several people the process minimizes the biases of any one assessor. The validity of ACJ is therefore tied to the constitution of the assessor cohort (Buckley, Canty, et al., 2022; Buckley, Seery, et al., 2022).
The use of ACJ has been comprehensively examined in terms of utility for technology education (S. Bartholomew & Jones, 2021; S. Bartholomew & Yoshikawa-Ruesch, 2018) and excellent tools have been developed to enable the use of ACJ for assessment. For example, RM Compare (https://compare.rm.com/) currently offers an ACJ platform which is the platform most widely used in technology education, and for people interested there are free trial plans available. However, there is no open-source application available which has a limiting impact on the growth of ACJ as an open-source system allowing for experimentation and customization more easily than a commercial product. Given the consistent argument for the value of ACJ in technology education specifically, it would seem particularly useful to have such a tool available within the field which can be examined, critiqued, and developed to mirror the needs or desires of the field. Moreover, from this activity insights can be gained and potentially integrated into more developed systems. Having an ACJ tool designed to be responsive for technology education would permit the introduction and description of pedagogical innovations and good practices which are founded on the use of ACJ. An open source ACJ tool would also aid in increasing ACJ research transparency for technology education researchers, particularly as the underpinning algorithms can be openly described to permit replication studies (Buckley, Seery, et al., 2022).
Based on this need, an Alpha version in the form of an R shinyapp has been developed for this purpose and is described from a technical perspective in this article to facilitate transparency in future use. This is seen as a necessary step before further works regarding pedagogical refinement of the app and the pedagogical value of ACJ are continued to be explored. The following sections explain the underpinning functionality of the app, and a concluding discussion section outlines planned next steps.
Developing an ACJ Tool for Technology Researchers and Educators
The Alpha version of an ACJ tool has been developed as a shinyapp using the R programming language (The R Foundation for Statistical Computing, 2022). This Alpha version of the shinyapp is available for use at https://jeffbuckley1992.shinyapps.io/comparative_judgement/. Updates will be noted on the app over time, with one example of such being related to the used adaptive algorithm. The following sections demonstrate its current features with reference to the underpinning functionality, statistical modelling, and potential output usage. It should be noted that the app, currently in its initial version, is intended to be developed based on disciplinary needs and results from further research. Additionally, the current version does not permit use in a single ACJ session from multiple devices. Multiple assessors can contribute but their decision making must be captured on a single device. This is further described in the discussion section at the end of the manuscript. The overall process is organized around 7 stages. These include:
Preparation of portfolios
Initial random pairs for comparative judgement
Adaptive pairings for random judgement
Manual judgements
Viewing the results of paired judgements
Analyzing the results using the Bradley-Terry-Luce model
Displaying the outputs of the analysis
An important dimension to the app is that these stages are iterative and not sequential. For example, a user can begin an ACJ session with a collection of portfolios, complete a series of judgements, and return to the portfolio preparation stage to add more portfolios to the process. They can also iterate between making comparisons on portfolios manually specified, paired adaptively or paired randomly as they wish. This is currently not an option available in any existing ACJ systems.
Preparation of Portfolios
In typical ACJ software solutions, portfolios are digitized pieces of work, such as PDF files, slideshows, or webpages, which are uploaded to the system for computer-based and mobile-based assessment. This is one of two options available in the app. For this option a user needs to have the relevant files hosted on Google Drive and shared such that anyone with a link can view the file. The files do not need to be in the same folder or shared by the same Google account, but it may be logistically easier to compile the relevant files into a single Google Drive folder and make that folder visible to anyone with the link. That will ensure the files within that folder are shared correctly. Next, the links need to be uploaded to the app. For this, a user can upload an Excel worksheet (a downloadable template is available) or input the information manually. Whether put into an Excel worksheet or entered manually, each portfolio needs to be given a name and have a link provided. Users can name portfolios any way they choose, and if no link is provided the file viewers in the next steps will display a note that no file has been provided. Figure 1 shows an example of this step where an Excel worksheet was used to upload links for six portfolios.
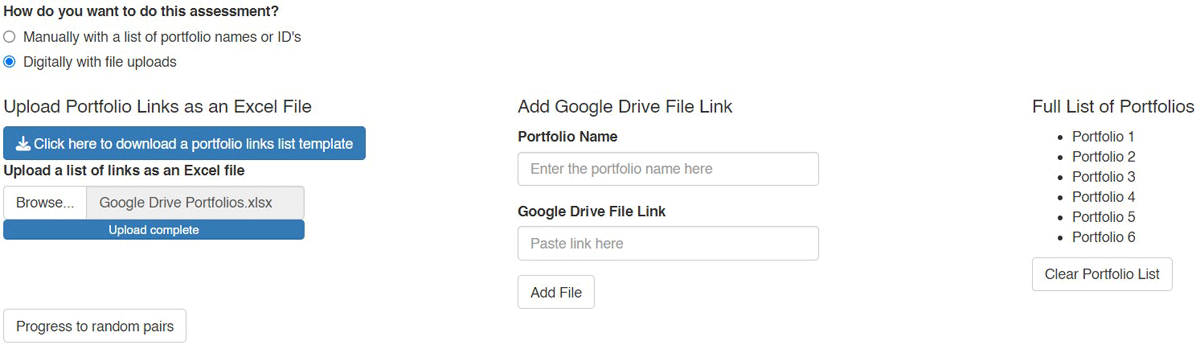
Figure 1
Digital portfolio upload page.
The other option is a manually defined list. In technology education, student work is often a manufactured physical artefact. This could be a prototype or finished product. Newhouse (2014), in a study using ACJ with digitized outputs from visual arts students, observed that assessors noted the quality of digital representations could be quite poor. For example, photographs of work could be blurry, or not accurately represent texture, details, scale, or dimensions of the actual work. Similar comments were made regarding video materials with assessors commenting on shaky videos. There was collective critique for both photographed and videoed works of distracting backgrounds, poor image resolution, and poor lighting, and one assessor noted the digitizing of physical works can make it more difficult to see issues with the work. This is not an argument against digitizing work in technology education. It is an acknowledgment that the use of ACJ should be considered beyond the existing computer-based paradigm and that when works are digitized, it is important that such representations are fair. For this approach, a user again has the option of uploading a list of portfolio names via an Excel worksheet or entering the names manually. Figure 2 shows an example of this step where an Excel worksheet was used to upload links for six portfolios.
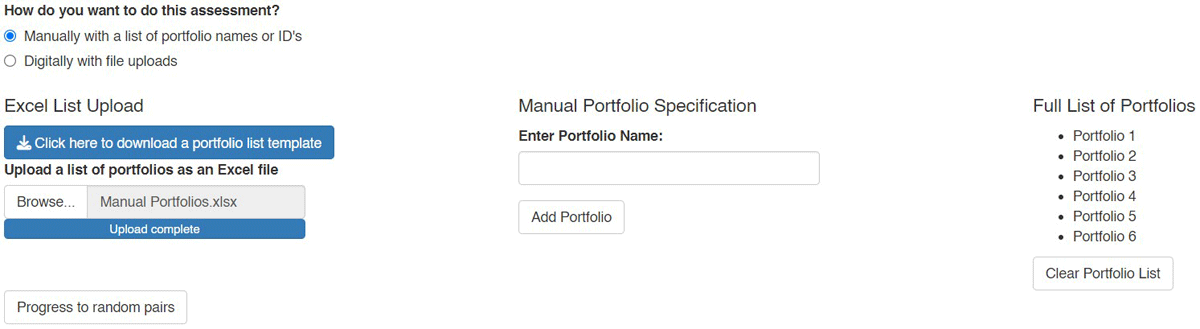
Figure 2
Manual portfolio upload page.
Random Pairs
Once a user has defined a list of portfolios to include in the ACJ process they can progress to either making random judgements or to making manual judgements. It is recommended that a selection of random judgements is completed first. There are three aspects of the random judgements phase that are important to note which relate to (1) the number of random judgements which should be completed, (2) portfolio chaining, and (3) how portfolios are selected for comparison.
In terms of how many random comparisons need to be made, this decision is made by selecting a number of rounds to complete. A round is defined as the creation of pairwise comparisons such that each portfolio in the sample is paired with one other portfolio. For example, if the ACJ process is being conducted with a sample of 10 portfolios, a round will include 5 comparisons with each portfolio included in one comparison. It is typical that six rounds of random judgements are used in this initial rough sorting round, possibly because this was the amount used in the e-scape project (Kimbell et al., 2009). That said, in this app, the user can select any number of random rounds to begin with, they can complete all specified random comparisons and then generate more, and they can progress to adaptive and manual pairings and then return to add more random comparisons.
A critical feature of the random pairings is portfolio chaining (Pollitt, 2012). Chaining is important for two reasons. As the primary output of the ACJ process is a rank order of included portfolios, it is important that each portfolio is connected to all other portfolios either directly or indirectly so that the rank can provide relative differences. Additionally, while the next section will explain in detail how adaptive pairings are determined, portfolios need to be chained for this step. To take the need away from users to plan for this, when any number of random pair rounds are determined the system checks at the end of those rounds whether from the created rounds the full sample of portfolios are chained or not. In other words, if six random rounds are specified, the full set of pairs for the six rounds are immediately determined and then the system checks to see whether, from these six rounds, all portfolios are chained or not. If they are, nothing occurs beyond presenting the user with the random pairs for these rounds. If they are not chained, pairs are automatically created purposefully to ensure full chaining is accomplished and these pairs are added to the end of the initially determined random rounds.
Figure 3 provides an illustration of this for five portfolios where each arrow illustrates a pair for comparison. In the left image, portfolio one is compared with portfolio four, portfolio four is compared with portfolio two, and portfolio five is compared with portfolio three. These three random pairings essentially create two chains, portfolios one, four, and two, and portfolios five and three. The goal instead is one singular chain. The image on the right shows the addition of one additional pair between portfolios one and five which results in the connection of all portfolios in the sample into a single chain.
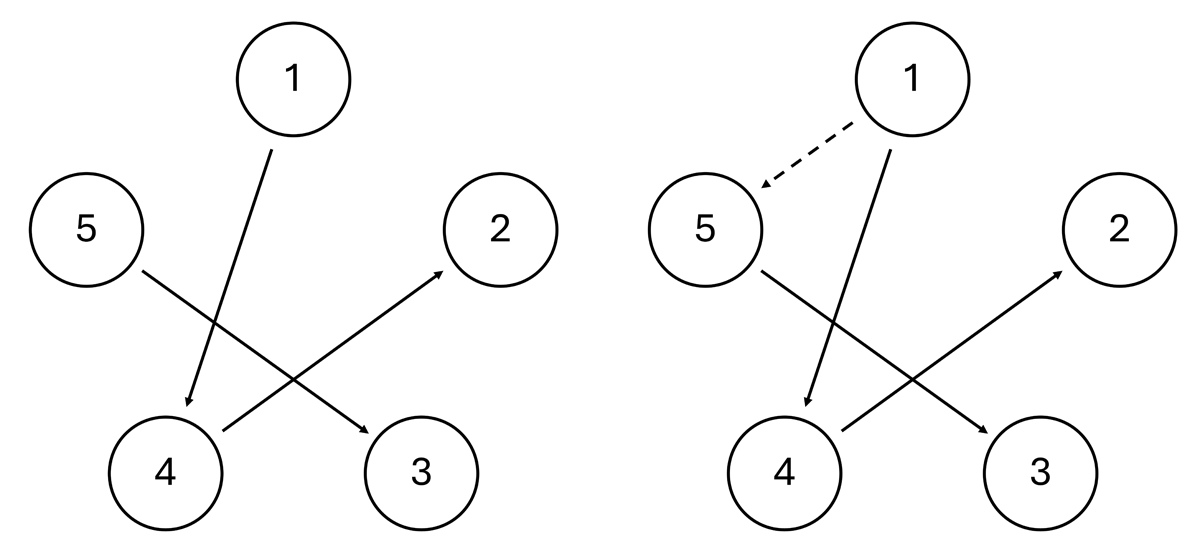
Figure 3
Portfolio chaining.
A final feature of the app relates to how portfolios are selected for comparison in these random pairs. In this app random pairs are completely random. In each round the first portfolio in the list is randomly paired with another portfolio from the list, and then these are excluded from future pairings in that round such that the next portfolio in the list is randomly paired with one of the remaining available portfolios. Once the pairs for the round are all decided, the process occurs the same way for subsequent rounds and there is no relationship between rounds.
In contrast to this process, Pollitt (in Kimbell et al., 2009) argues for a Swiss tournament approach due to increased efficiency and discriminability between portfolios. This approach to rough sorting has the same random approach to the initial round with the outcome being each portfolio having a score of 1 (if they were deemed the better of their pair) or 0 (if they were deemed the worse) at the end. In subsequent rounds, portfolios are randomly paired but, where possible, only with portfolios of the same score. In the second round, for example, portfolios with a score of 1 are paired randomly with others with a score or 1, and those with a score of 0 are paired with others with a score of 0. The current app may be less efficient than one which uses Pollitt’s recommended Swiss tournament approach at this stage, however this decision was based on bridging the arguments for and against the adaptive component in ACJ. Bramley (2015), on this issue, notes that:
When there are no ‘true’ differences among the scripts a random half of them lose in the first round. In the second round half of these losers will be paired against the other half (and likewise for the winners) and again a random half of them will lose, and a random half of the winners will win, and thus the estimates of script quality become spread out. However, because of the adaptivity, the scripts that have lost twice will not have the chance to show that they are just as likely to beat scripts that have won twice as they are to beat any others because they will not be paired against scripts that have won twice in the next round… in the context of ACJ, where there is so little data per script, it seems clear that it creates spurious separation among the scripts. (pp. 13-14)
While the proposed solution from Bramley (2015) was to explore a reference set against which new works are adaptively compared, and this has been investigated (Verhavert et al., 2022), the presented work relates to the development of an app to enable ACJ research as opposed to a methodology for how ACJ should be used for assessment. The use of complete randomness for this rough sorting instead aims at being a balance in these views on comparative judgement.
Beyond the decision making as to how portfolios will be selected for comparison, from a use perspective the user is initially presented with the decision to choose a number of random rounds. A note suggesting that six rounds are recommended is provided but the user can choose any amount they wish. Once they generate the list of comparisons, the portfolios for comparison are then presented on the screen (Figure 4). A feature not typical of existing ACJ tools is that the user can choose to see any number of upcoming comparisons in the list and cycle through these to make the comparisons in any order they wish. This was introduced for pedagogical reasons. It may be useful to generate several random rounds for example and assign a selection to students in a way that the students can simultaneously make comparisons and return their decisions to an educator for entry into the app in the order the students return them in. As the app is currently only a single user/device system, this feature at least allows for the several upcoming comparisons to be viewed such as they can be distributed physically to multiple judges and the decisions can be inputted on the single device for a close to multiple user experience.
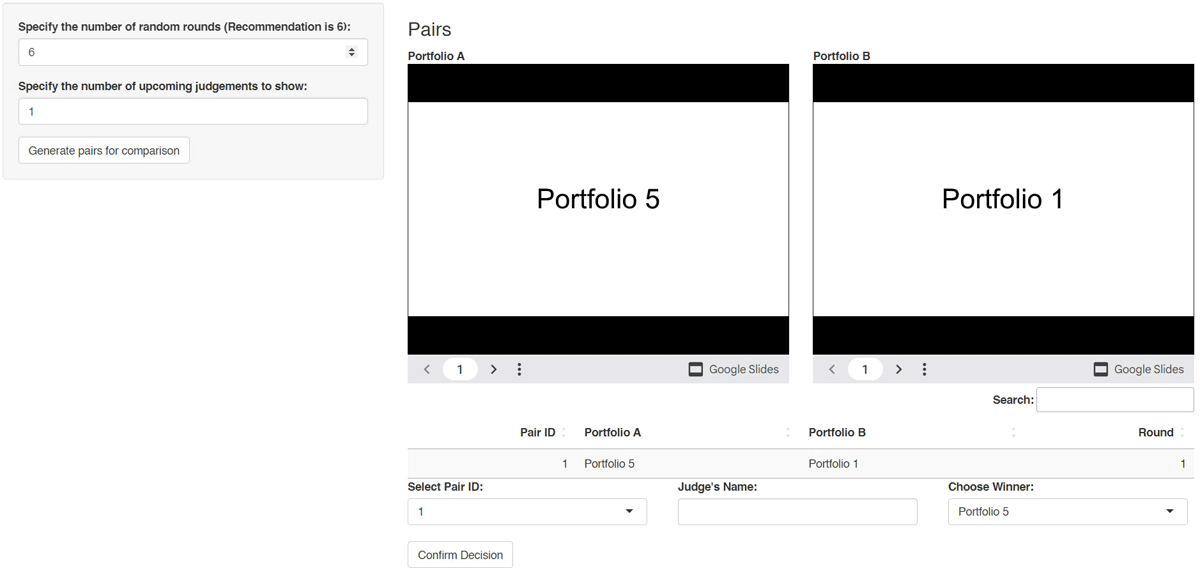
Figure 4
Random judgement page.
Once the random comparisons are made, a user can choose to generate more completely random rounds or progress to adaptively generated comparisons or to manually defined comparisons. There has yet to be any research on whether there is value in iterating between randomly and adaptively generated comparisons, so at this stage all that is being commented on is that the functionality is included to permit moving between the different types. Users should at least complete all initially specified random comparisons to ensure complete chaining, but after that they would be free to iterate. There may be a benefit to producing several random rounds to get a longer list of comparisons in the current version of the app as it does only run from a single device. In so doing, these random comparisons could be assigned to a group of people. In contrast, the adaptive comparisons are generated round by round so less pairs are generated at a time. Beyond this, there will need to be further research to clarify optimal types of comparison for different purposes.
Adaptive Pairs
After completing a set number of random pairwise comparisons to derive initial ability scores for each portfolio and to ensure chaining, users can progress to adaptive pairings if they wish. In terms of the judging experience this is equivalent to the random pairs in that a decision is to be made on which portfolio is the better/worse. As such, no figure is presented to illustrate this stage as it appears identical. The main difference at this stage lies solely in the process by which portfolios are paired for comparison. There are several algorithms which can be used to adaptively pair portfolios (e.g., Verhavert, 2018). The algorithm used in the app has limitations which are described later, but it is being used as a starting point for more systematic investigation of appropriate ways to manage this part of the process. Instead of random pairs, the adaptive rounds are generated for portfolios by pairing them based on the Fisher Information statistic. The Fisher Information statistic (Equation 3), in this case is the product of the probability of one portfolio in a comparison winning and the probability of the other portfolio winning. The most information is gained when the probability of either portfolio winning is 0.5, which would occur when the portfolios being compared are equal in perceived quality. In other words, more information is gained from a comparison between two portfolios that are close together than from a comparison between portfolios very far apart in the rank (Pollitt, 2012). For each round, initial ability scores are determined by fitting the Bradley-Terry-Luce (BTL) model, these are used to compute the Fisher Information statistic for each possible pair of portfolios, and then pairs are determined by selection of those which will provide most information. The process occurs as follows:
A number of rounds of random pairs are completed, such that each portfolio in the sample is connected directly or indirectly, and this results in a dataset in which the number of wins each portfolio gains is recorded, and the number of wins and losses each portfolio has gained against all other portfolios are recorded.
Based on this data, the BTL model is fit to derive ability scores by
where is the number of wins portfolio i has against portfolio j, is the number of wins portfolio j has against portfolio i, is the ability score estimate of portfolio i, and is the ability score estimate of portfolio j (Hunter, 2004). Initially, all ability scores are estimated as 1 and then normalized to maximum likelihood estimates. See Buckley (2024) Supplementary Material for a more detailed explanation of this formula in the context of technology education research.
These ability scores are converted to logits by
where is each ability score for set .
A matrix is then created which pairs each portfolio with all other portfolios, and the Fisher Information statistic (I) is computed for each pair of portfolios (e.g., portfolios i and j) by
where is the probability that portfolio i wins in a comparison with portfolio j, computed by
where is the ability score of portfolio i and is the ability score of portfolio j.
The matrix is examined, and the portfolio pair which has the highest Fisher Information statistic is set as the first pair in the adaptive pair round, and these portfolios are removed from the matrix. The matrix is then re-examined for the pair that provides the next highest Fisher Information statistic, which becomes the second pair for the adaptive pair round. This process repeats until all portfolios are put into pairs, and these pairs define the adaptive round.
Manual Judgements
Beyond random and adaptive judgements, the app permits the addition of manually defined judgements. This was included for both research and educational purposes. If being used in an educational setting, it may be valuable for an educator to ask a student(s) to compare two specific portfolios (Figure 5). This could be formative in that the educator may wish to see what students think about certain portfolios which have certain characteristics.
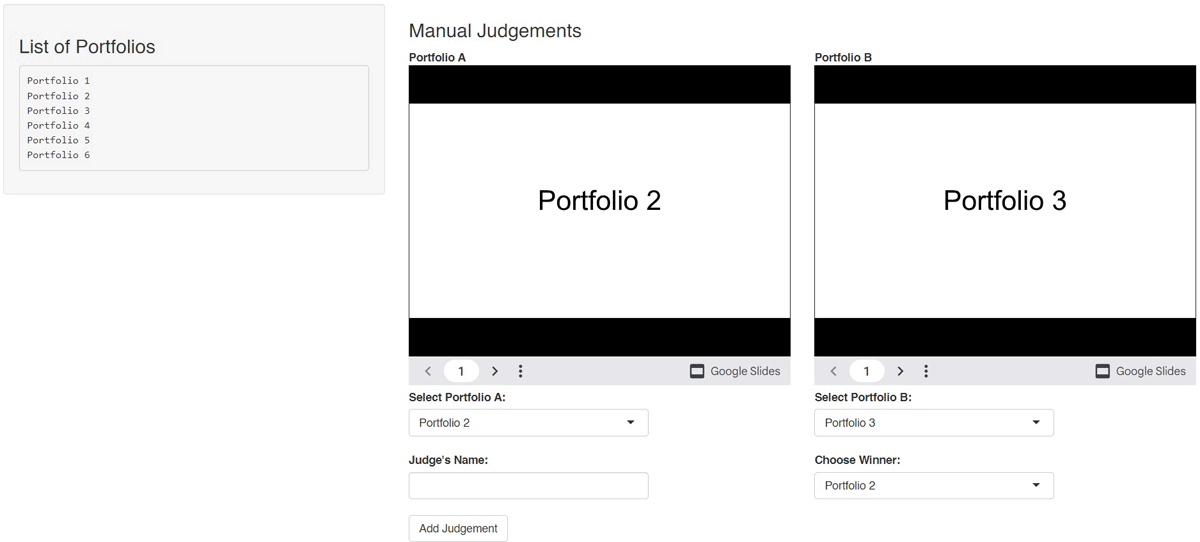
Figure 5
Manual judgement page.
From a research perspective there can be value in the capacity for making comparisons between specific portfolios, such as if two previously created ACJ ranks were being compared (cf. Buckley et al., 2023; Buckley & Canty, 2022; Seery et al., 2022; Verhavert et al., 2022). It may also be useful for judge calibration-type activities where assessors may be being trained or informed about standards and whomever was leading this activity may want to orchestrate which portfolios are presented for comparison. On this page of the app a user sees the full list of portfolios in the sample and can select two to compare based on dropdown menus. If this process is being done with digital portfolios the file viewers will update based on the dropdown menu selection (Figure 5).
Viewing the Results of Pairwise Comparisons
There is a page on the app where users can view the results of each pairwise comparison made and entered into the judging session. Each comparison made is recorded in a table which shows both portfolios (portfolio.a and portfolio.b), the result (1 indicates that portfolio.a won and 0 indicates that portfolio.b won), and the person or judge who made the comparison. This is illustrated in Figure 6, however it should be noted that from this stage onwards the Figures come from a trial session with nine portfolios instead of the six which have been shown thus far. And that viewing this information may not be very useful in and of itself.
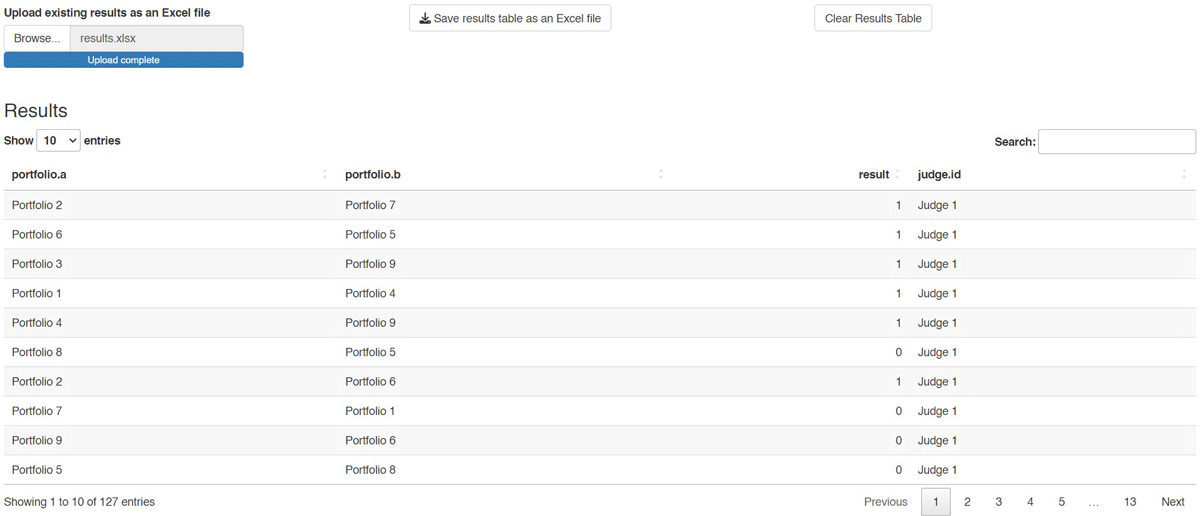
Figure 6
Results table for pairwise comparisons.
The reason for this page is for a different feature of the app. The table which can be viewed is simply a table from an Excel worksheet, and the information in this table is used for the analysis and ranking of portfolios in the next step.
A user can upload their own table to this view for analysis. This creates several possibilities:
A user who finished or paused a session could download this table, and at any later date resume making comparisons by uploading this table and picking up where they left off.
A user can download the results of a judging session and add/remove/edit any comparisons they want to. They could therefore, for example, remove all comparisons made by a particular judge simply by deleting rows in the Excel sheet and reuploading the table. Alternatively, they could create several tables following an ACJ session based on sub-groups of judges, and compare ranks produced by these different groups.
If two (or more) ACJ sessions were conducted with sets of portfolios {a1, a2, a3, a4, …, an} and {b1, b2, b3, b4, …, bn}, a user could merge the two results table into one and upload it on this section of the app and make a series of judgements to merge the ranks (Buckley et al., 2023). Alternatively, these different ACJ sessions may have the same portfolios but have been conducted with different groups of judges, opening possibilities for group comparisons for educational and research purposes.
Analyzing the Results
On the analysis page of the app the information from the results table from the previous step can be analyzed through fitting the BTL model as described in Equation 1. An important and novel aspect to the app is that any set of pairwise comparisons can be recorded in a table of the same format to the results table, be uploaded to the app and be analyzed to compute a rank of the included portfolios. The judgement capacities of the app do not need to be used. They are useful in the selection of portfolios for comparison and the viewing of portfolios, but this page enables BTL model fitting and analysis of data coming from a wider variety of sources beyond an ACJ process. This may be of particular interest to researchers or educators who can capture comparison-type decisions in a variety of ways and for a variety of purposes as this will enable data analysis and presentation.
Further, it also provides the specifications of the analysis in full. For example, the approach to fitting the BTL model in this app is through the sirt package in the statistical analysis software RStudio (Robitzsch, 2021). This package contains several functions for item response theory modelling. It is the btm() function which is of specific interest for ACJ as it can be used to compute a BTL model with a dataset of outcomes from pairwise comparisons (e.g. Buckley et al., 2023). The version of this package being used is noted on this page as well as the R version and date of analysis. Several pieces of statistical information are provided in raw format which may be of interest, although these are presented more clearly based on typical usage in technology education on at the next stage. For reference, scale separation reliability (SSR: Verhavert et al., 2018) is provided and denoted by “MLE Rel”, portfolio ability scores/parameter values are denoted by “theta”, and infit statistics are shown for portfolios and judges. It should be noted that the SSR reliability coefficient has been given different names throughout the literature (cf. Bramley & Wheadon, 2015), such as by Pollitt (2015) who referred to it as the “judge consistency coefficient”
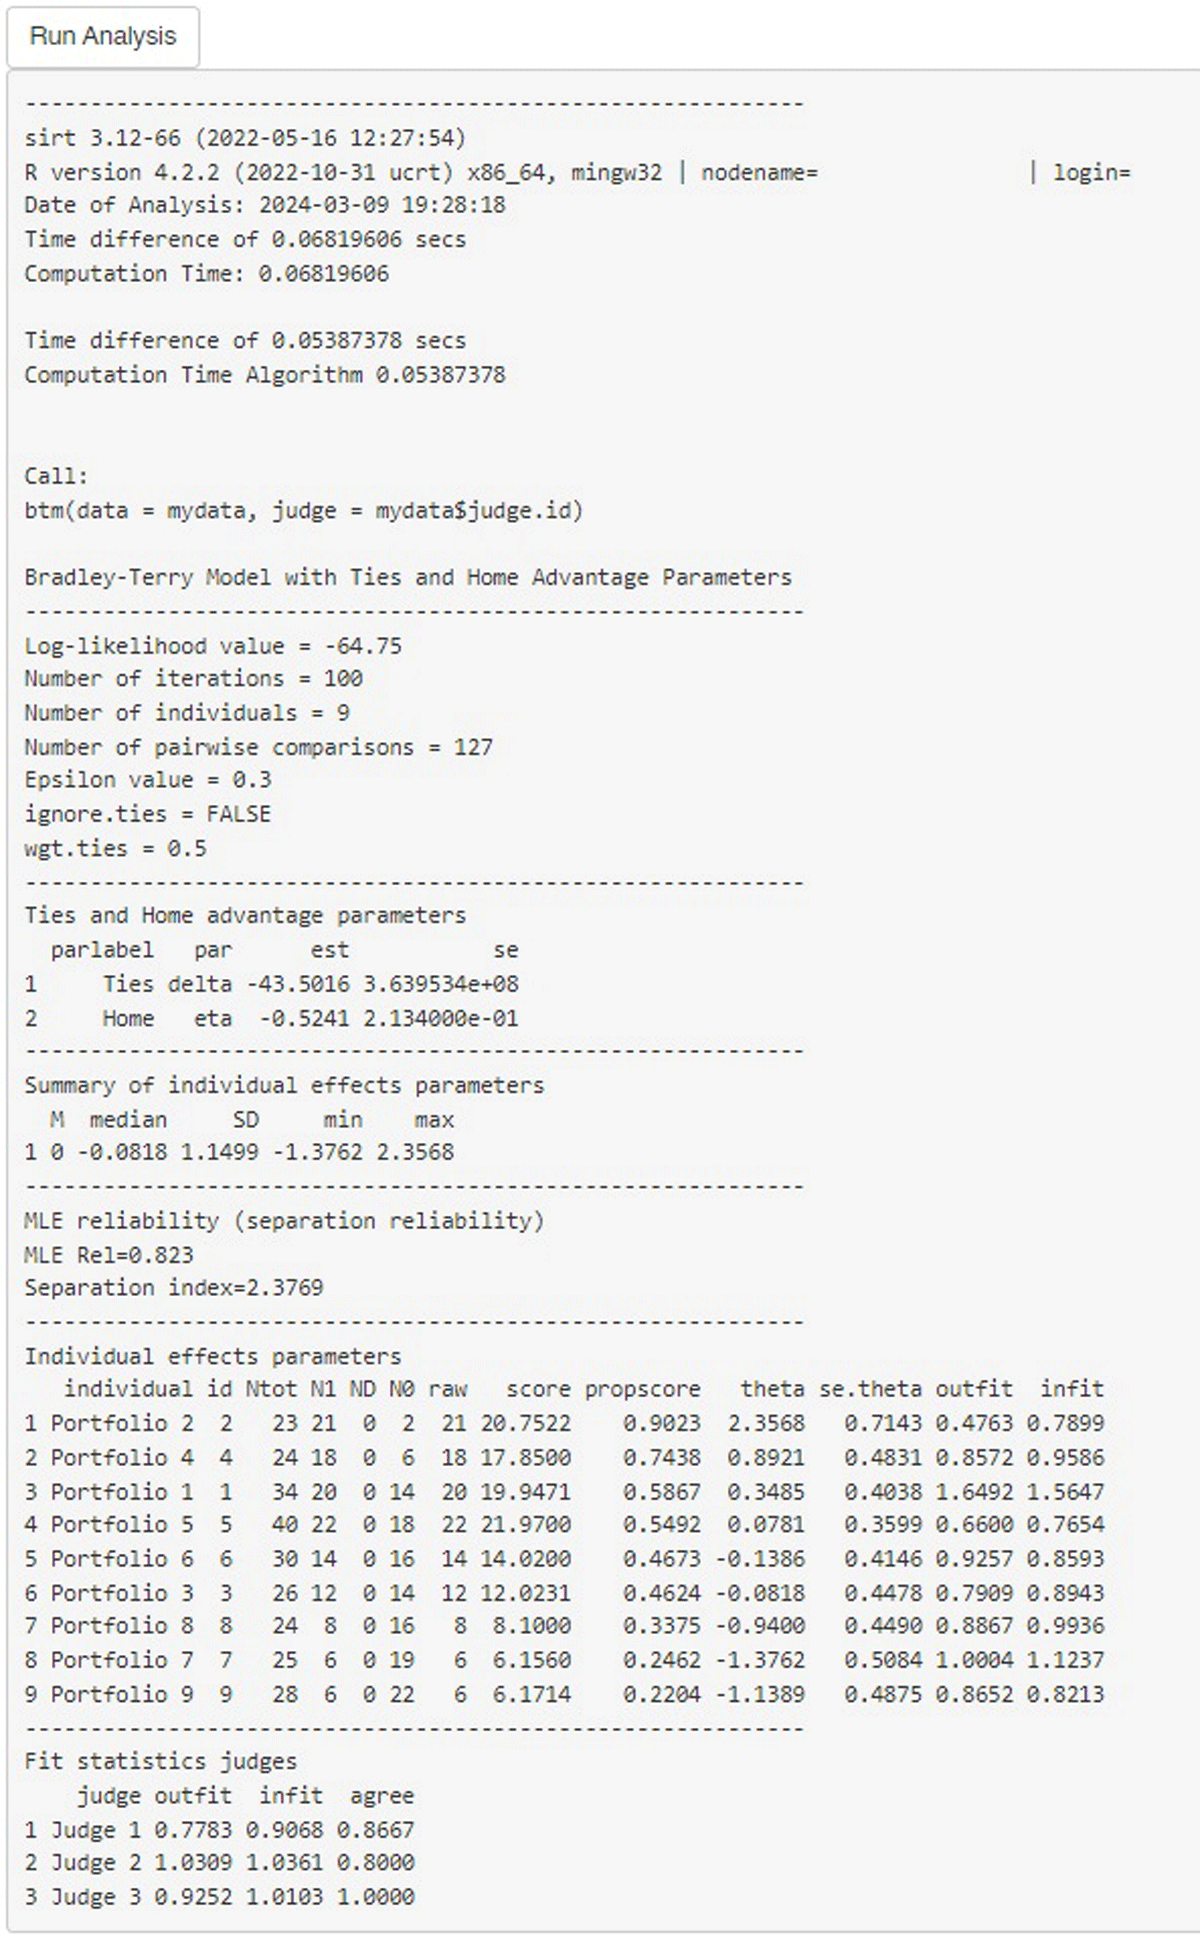
Figure 7
Analysis of the ACJ results using the sirt R package (Robitzsch, 2021).
Generating Outputs
On the final page of the app a user can select the option to generate outputs. This takes the analysis information from the previous page and converts it into a more accessible presentation. For example, Figure 8 illustrates a table providing the rank and ability score (denoted as “parameter value”) for each portfolio such that performance can be compared. Standard error and infit statistics for portfolios are also provided. This table is also downloadable such that users can analyze further if they wish.
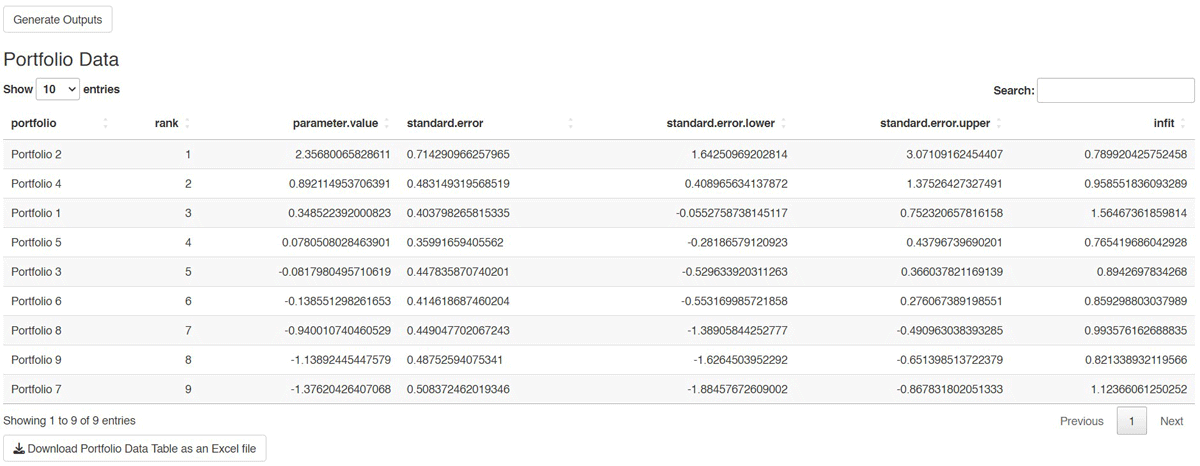
Figure 8
Final results for portfolios.
For ease of use and communication purposes, the information from this table also generates as a plot which can be downloaded as a PDF file (Figure 9). This plot also provides the SSR reliability estimate which in this case is SSR = 0.823.
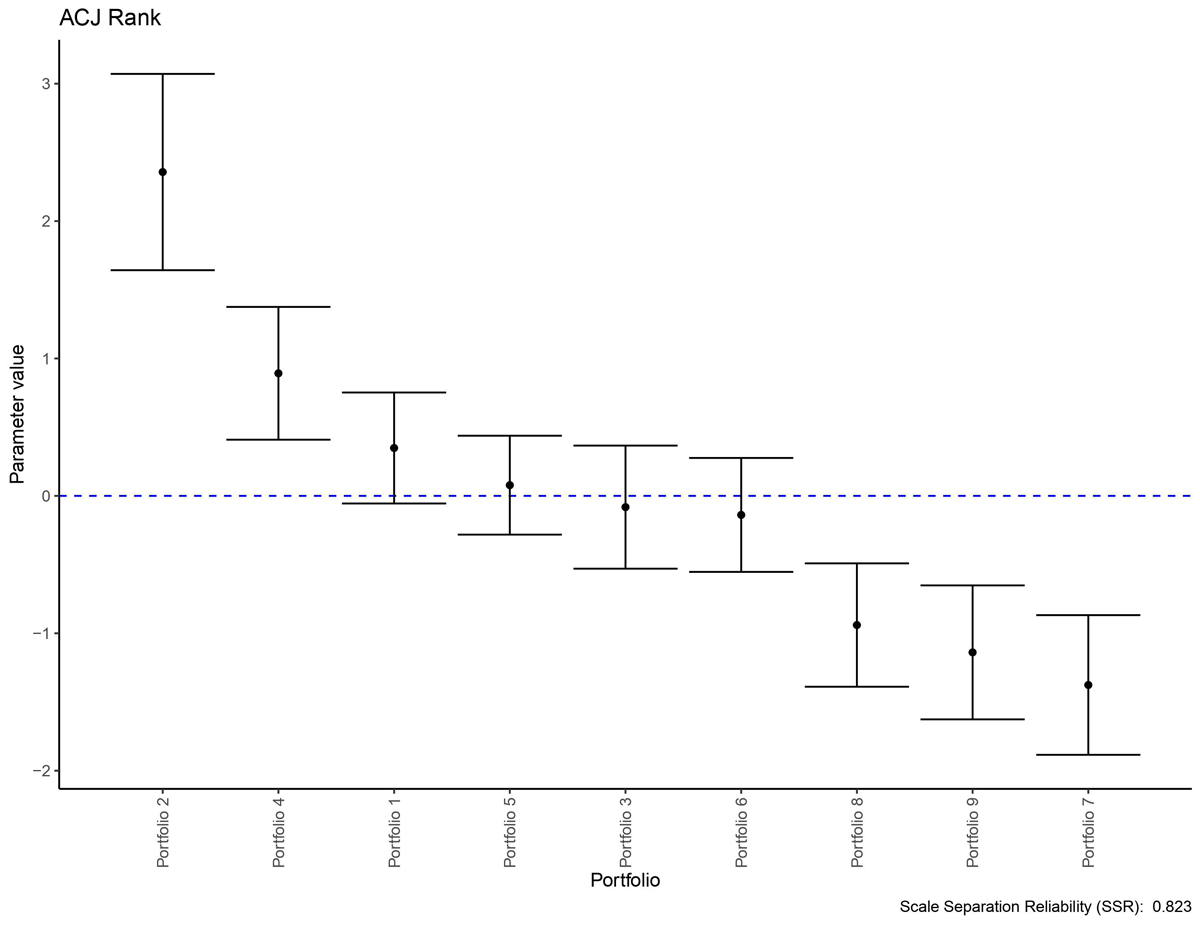
Figure 9
Sample portfolio results plot.
A table similar to the version shown in Figure 8 for judges is also produced. It includes judge agreement levels and misfit statistics. A plot for this table is also produced which provides details on the mean misfit value, the misfit threshold (mean misfit + 2 standard deviations), and the critical misfit value of 2 (Figure 10). Judge misfit statistics can be compared to these values to see whether any judges were particularly misaligned with the rest of the cohort and this can be investigated further to understand why this may have occurred.
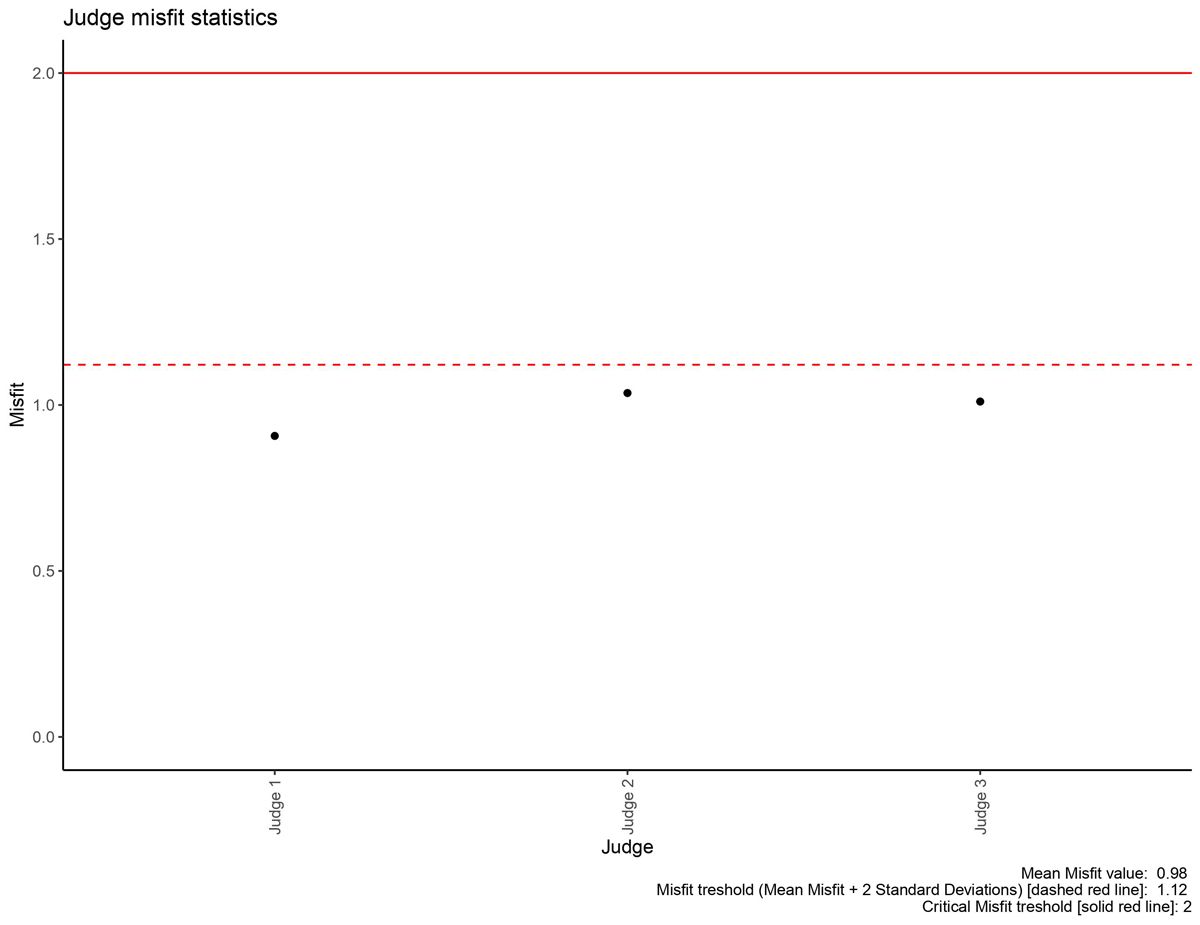
Figure 10
Sample judge results plot.
Discussion and Conclusion
The preceding sections describe the current functionality of the developed ACJ shinyapp. It is very much in an Alpha testing stage but provided it is used transparently and limitations are understood, it is openly usable. Now that it is available for use, the next step will involve Alpha testing. In this stage, from a functionality perspective, there will be a confirmation that all relevant file types work under different conditions. From pedagogical and research perspectives there will be qualitative inquiry into how technology teachers and researchers could use the app and what additional features would be of value. Based on the results of this phase the app can undergo a series of updates.
Irrespective of this, as the current app only allows one user at the moment, there is a planned development to have multiple judge profiles able to contribute to the same judging session. This will permit the ideal state of judges internationally being able to contribute to a single ACJ session (e.g., S. Bartholomew et al., 2020). It is planned that there will be more minor updates such as introducing comment boxes to allow for capturing data on reasons for judge decisions and Likert-type items to capture data on how easy/difficult it is to make judgements which can be used to inform the adaptive algorithm.
Finally, the current adaptive algorithm works, but has limitations. It is probable that all adaptive algorithms have limitations. The purpose for adaptivity is to reduce the number of judgements needed overall in an ACJ session by pairing portfolios which are useful/informative to compare. For example, after several rounds the value of comparing the top ranked portfolio with the bottom ranked portfolio is probably not much. When considering an adaptive algorithm there are several considerations, but primarily they relate to information and ease of judgement. The most information is gained from comparing portfolios which are close together in the rank, but this could be quite difficult and thus reduce the feasibility of ACJ. In the currently used algorithm portfolios are paired based on the potential informational value of their comparison. Starting with the pair predicted to provide the most information, the algorithm progressively selects pairs with diminishing informational returns. This method, while efficient, may lead to less informative comparisons towards the end of a round. Therefore, within a round, the information from the first comparison is the highest and this reduces over time, and the first pair is likely to be the most difficult to make a judgement on and this will get easier over time. The biggest limitation in this is that depending on how judgements are paired throughout the round, the last comparisons in particular could be between a portfolio at the top of the rank and one at the bottom, which would potentially have very limited value. An informal simulation of this not reported here found that this does occur, but it is not that frequent. The current algorithm could be classified as a greedy algorithm as it takes the best pair (defined by most information only) one at a time. It is locally optimal as opposed to globally optimal. As such, the algorithm will be compared with an exact algorithm which is more globally optimal. For example, the information from all possible pairs could be examined and rather than selecting pairs in isolation by most information pairs could be determined by which selection of pairs overall will provide the most collective information from the round. Further, additional variables such as ease of judgement can be added. Pollitt (2012) for example suggests that a balance between information and ease of judgement is achievable when the probably of a portfolio winning is approximately 66% as opposed to when there is most information at 50%. Alternatively, an adaptive algorithm could be trialed where diversity in comparisons is considered such that comparisons are made between portfolios within clusters of estimated ability level rather than continuously only to those closest to one another in the rank. There is a lot of debate within the ACJ literature on the use of adaptive algorithms (Bramley, 2015; Bramley & Vitello, 2019; Kimbell, 2022), and hopefully this app enables useful examination of potential algorithm types to determine which is best for technology education.
To conclude, the development of this ACJ app marks the first step in the establishment of an open source ACJ tool bespoke for technology education. Currently in an Alpha stage, the app will be developed further through an iterative process where the value of further updates is grounded in pedagogical and research utility. This particular article is limited in that it does not speak at length on the pedagogical affordances of ACJ, but that conversation has been had in general elsewhere (e.g., S. Bartholomew, Strimel, & Jackson, 2018; S. Bartholomew, Strimel, & Zhang, 2018; Hartell & Buckley, 2021; Kimbell, 2022). However, this work provides a platform for more systematic exploration of the pedagogical value of ACJ through the presentation of an ACJ app which itself is adaptable. Future work can now progress in two tracks; how should ACJ function (e.g., investigating appropriate adaptive algorithms, determining appropriate numbers of initial random rounds etc.), and how can ACJ be pedagogically useful (e.g., how can the rank of portfolios be formatively useful for students and teachers, how can misfit statistics be used to understand differences in student conceptions of quality, etc.). From this, while this app can be used in educational practice and for research, it would not be optimal as it has some user-experience limitations. It is envisioned that the biggest impact of this app will be in its function as a testbed to inform more developed and user-friendly systems.
Competing Interests
The author has no competing interests to declare.