
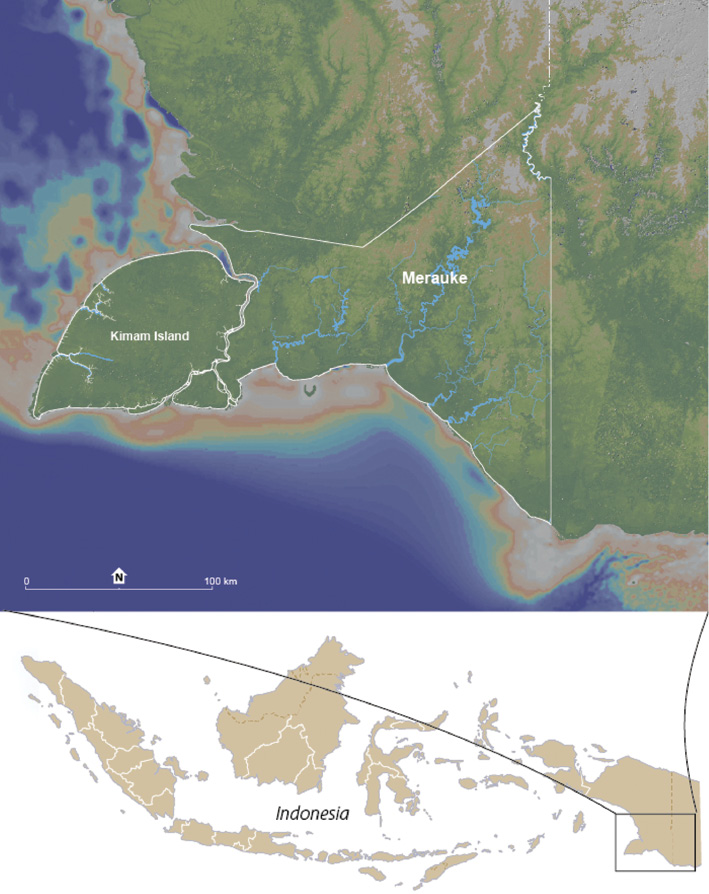
Figure 1:
Map of Merauke district, Indonesia.
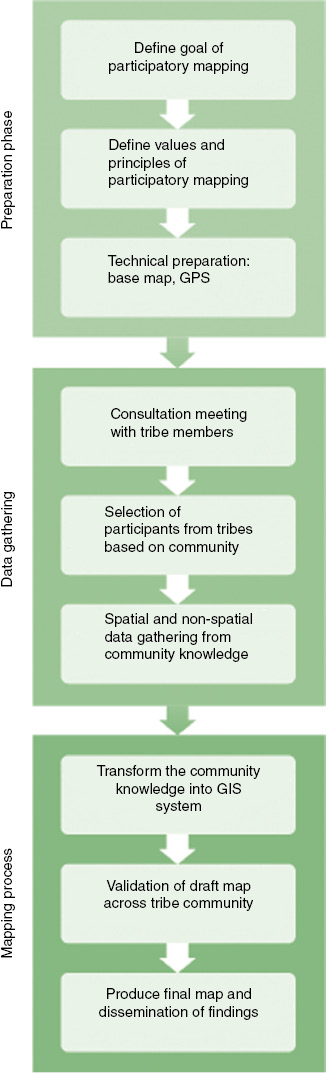
Figure 2:
The flow of PGIS mapping with indigenous people.
Table 1:
Spatial data needed for the analysis of district spatial planning.
| Biophysical data | Social data | Economics and infrastructure data |
|---|---|---|
| Forest cover, watershed, riparian forest, coastal forest, river systems, critical areas vulnerable to disasters e.g. flooding, drought and fire in peat forest areas, landform, soil types, climate, mud flats, swamp/wetland areas | Existing population and distribution, education level, health services e.g. number of nurses and doctors, important areas for supporting community livelihood and cultural areas | Market places, roads, settlement areas, offices area, bridge, electricity, power plant, clean water services, drainage system, and transportation systems via air, river, and sea. |
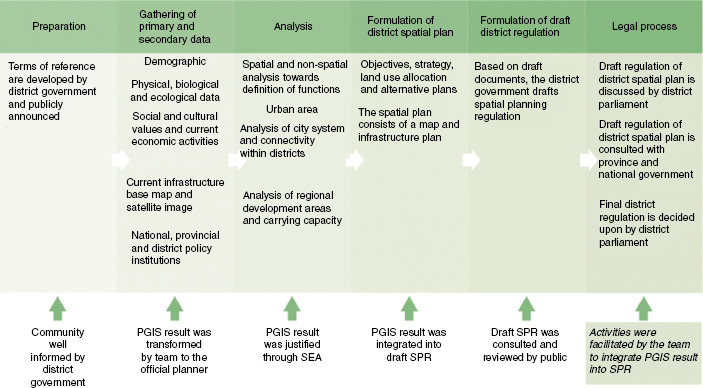
Figure 3:
The process of integration of the PGIS results into a formal framework for district spatial planning (Source of formal Spatial Planning Process: Ministry of Pubic Work 2009).
Table 2:
Mapping results for Tempat Penting Masyarakat or important community areas.
| No | Category of important community areas | Size (ha) | Share (%) |
|---|---|---|---|
| 1 | Ancestor route | 79,689 | 11.22 |
| Ancestor route associated with ancestor transit, traditional conservation areas, and water resources | 10,575 | 1.49 | |
| Total ancestor route | 90,264 | 12.71 | |
| 2 | Ancestor transit | 3110 | 0.44 |
| Ancestor transit associated with traditional conservation areas, and water resources | 632 | 0.99 | |
| Total ancestor transit | 3742 | 0.53 | |
| 3 | Sacred sites | 192,626 | 27.12 |
| Sacred sites associated with ancestor route, ancestor transit, traditional conservation areas, water resources, and cultivated sago palms | 86,936 | 12.24 | |
| Total sacred sites | 279,562 | 39.36 | |
| Subtotal cultural areas | 373,568 | 53 | |
| 4 | Cultivated sago palms | 157,945 | 22.24 |
| Cultivated sago palms associated with ancestor route, ancestor transit, traditional conservation areas, and water resources | 32,212 | 4.53 | |
| Total cultivated sago palms | 190,157 | 26.77 | |
| 5 | Traditional conservation areas | 84,616 | 11.91 |
| Total traditional conservation areas | 84,616 | 11.91 | |
| 6 | Water resources | 50,943 | 7.17 |
| Water resources, traditional conservation areas | 11,021 | 1.55 | |
| Total water resources | 61,964 | 8.72 | |
| Subtotal provisioning services | 336,737 | 47 | |
| Total | 710,305 | 100 |
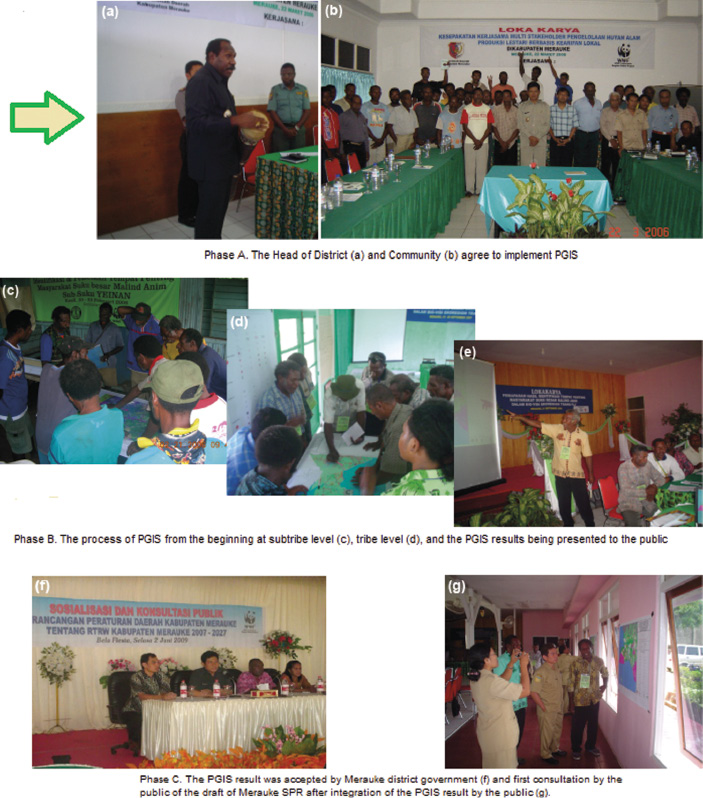
Figure 4:
The process of integration of PGIS results into spatial planning regulation was conducted in three phases.
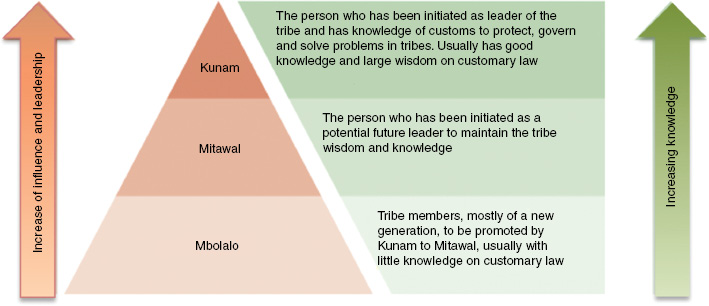
Figure 5:
Social structure of Marind Anim tribe.

Figure 6:
(A) Upper map; PGIS mapping result of important community areas of the Marind Anim tribe of Merauke district. (B) Lower map; PGIS mapping result as adopted by Spatial Planning regulation (RTRWK) of Merauke district.
Table 3:
Land use classes of Spatial Planning Regulation (RTRWK) of Merauke district.
| No | Land use class | Size (ha) | Share (%) |
|---|---|---|---|
| Protection areas | |||
| 1 | Coastal areas (Sempadan pantai) | 9654 | 0.21 |
| 2 | Nature reserve (Cagar Alam Darat) | 87,386 | 1.89 |
| 3 | Riparian areas (Sempadan sungai) | 149,934 | 3.24 |
| 4 | Mangrove forest area (Kawasan hutan bakau) | 274,659 | 5.93 |
| 5 | National Park (Taman Nasional Darat) | 323,466 | 6.99 |
| 6 | Protected forest (Hutan Lindung) | 393,910 | 8.51 |
| 7 | Water recharge areas (Resapan Air) | 492,333 | 10.64 |
| 8 | Wildlife reserve/santuary (Suaka Margasatwa) | 582,907 | 12.59 |
| 9 | Cultural preservation areas (Kawasan Perlindungan Budaya) | 608,581 | 13.15 |
| 10 | Coastal abrasion (Abrasi pantai) | – | |
| 11 | Vulnerable flood areas (Kawasan rawan banjir) | – | |
| Subtotal | 2,922,830 | 63.14 | |
| Development areas | |||
| 1 | Sand mining areas (Kawasan Galian Glongan C) | 2289 | 0.05 |
| 2 | Freshwater fisheries (Perikanan darat) | 3728 | 0.08 |
| 3 | Animal husbandry areas (Peternakan) | 9155 | 0.20 |
| 4 | Urban areas (Kawasan perkotaan) | 35,515 | 0.77 |
| 5 | Conversion production forest area (Hutan produksi yang dapat dikonversi) | 39,188 | 0.85 |
| 6 | Rural areas (Kawasan perdesaan) | 104,867 | 2.27 |
| 7 | Plantation (Perkebunan) | 169,875 | 3.67 |
| 8 | Dryland agriculture (Pertanian lahan kering) | 293,916 | 6.35 |
| 9 | Wetland agriculture (Pertanian lahan basah) | 388,069 | 8.38 |
| 10 | Limited production forest (Hutan produksi terbatas) | 659,625 | 14.25 |
| Subtotal | 1,706,227 | 36.86 | |
| Grand Total | 4,629,057 | 100 |
Sources: Bappeda-Merauke.5
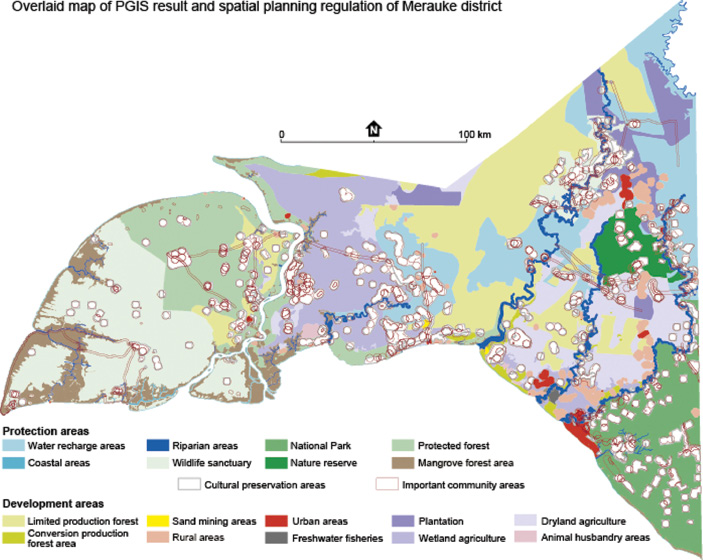
Figure 7:
Overlaid map of PGIS results that have been integrated into spatial planning regulation.
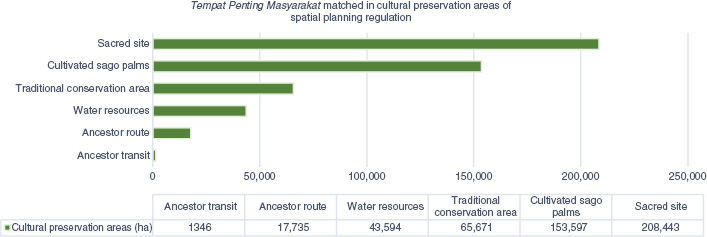
Figure 8:
Distribution of the TPM (%) in cultural preservation areas of district Spatial Planning Regulation and the area (unit in hectares) for each class of Tempat Penting Masyarakat (important community area) in the table.

Figure 9:
Distribution of the TPM (%) in protection areas of district Spatial Planning Regulation and the area (unit in hectares) for each class of Tempat Penting Masyarakat (important community area) in the table.
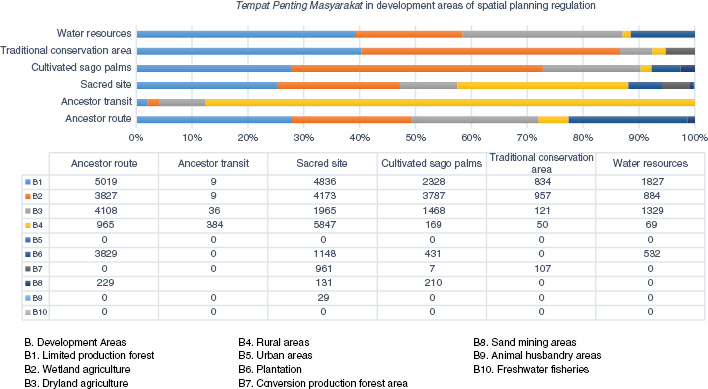
Figure 10:
Distribution of the TPM (%) in development areas of district Spatial Planning Regulation and the area (unit in hectares) for each class of Tempat Penting Masyarakat (important community area) in the table.