
Table 1
Mutualism in Europe (in thousands of members).
| 1904 | 1920 | 1924 | |
|---|---|---|---|
| Great Britain | 6164(i) | 7216 | 7246(ii) |
| France | – | 4300 | – |
| Italy | 926 | – | 885 |
| Spain | 84 | 338 | 431 |
(i) Data from 1905 (ii) data from 1926. Based on: Vilar 2010; Instituto de Reformas Sociales [IRS] 1908; [INP] 1927.
Table 2
Mutualism development and population covered.
| 1915 | 1920 | 1925 | |
|---|---|---|---|
| Friendly societies | 1274 | 1514 | 1770 |
| Members | 143,993 | 303,640 | 398,999 |
| Total population | 20,615,156 | 21,303,162 | 22,433,515 |
| Coverage | |||
| Sickness | 153,393 | 293,139 | 383,169 |
| Disability | 53,513 | 97,570 | 124,285 |
| Old age | 13,383 | 19,853 | 28,489 |
| Death | 82,743 | 174,573 | 237,360 |
| Maternity | 4894 | 10,609 | 15,440 |
| Medical care | 42,336 | 73,374 | 81,786 |
| Pharmaceutical care | 35,890 | 51,977 | 59,805 |
| Widows and orphans | 12,810 | 13,744 | 15,924 |
| Other risks | 2299 | 16,661 | 22,684 |
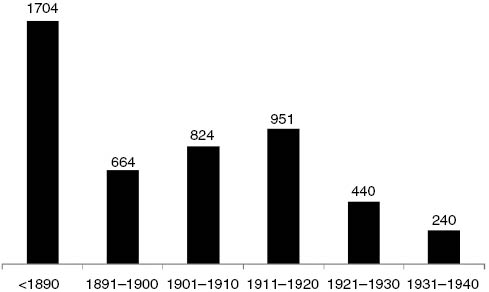
Figure 1
Friendly societies arranged by date of foundation in Barcelona (Solà 1994, 75).
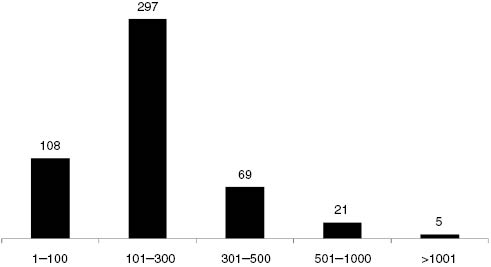
Figure 2
Federated societies by size, 1911 (Ayuntamiento de Barcelona 1911, 594–605).
Table 3
Financial indicators of federated societies, 1914 and 1926 (Constant pesetas of 1913).
| 1914 | 1926 | 1914 | 1926 | Evol (2) in % 1914–1926 | |
|---|---|---|---|---|---|
| Collector | 6.87 | 4.88 | 1.08 | 0.69 | −36.5 |
| Doctor | 1.24 | 0.64 | 0.19 | 0.09 | −53.8 |
| Physician visits | 0.32 | 0.23 | 0.05 | 0.03 | −33.6 |
| Pharmacy | 0.23 | 0.07 | 0.04 | 0.01 | −75.6 |
| Staff | 0.65 | 0.70 | 0.10 | 0.10 | −3.9 |
| Registered office | 0.50 | 0.38 | 0.08 | 0.05 | −31.7 |
| Assemblies | 0.13 | 0.18 | 0.02 | 0.03 | 29.6 |
| Printed material | 1.84 | 1.76 | 0.29 | 0.25 | −14.4 |
| Various | 1.70 | 16.86 | 0.27 | 2.37 | 788.8 |
| Community acts | 1.45 | 0.15 | 0.23 | 0.02 | −90.8 |
| Benefits paid | 85.07 | 74.14 | 13.38 | 10.41 | −22.2 |
| Income from premiums | 15.28 | 15.19 | −0.6 |
Author’s own after the Federation’s statistics for the years 1914 and 1926, El Porvenir de la Mutualidad, No. 112, p. 10, October 1916 and No. 193, p. 19, July 1929, respectively. Deflator: Maluquer de Motes 2009.
Table 4
Average society size and sickness rate among the federated societies.
| Year | No. of societies | Average size | Days on sick leave | Daily benefits per person (pesetas 1913) | % sick members |
|---|---|---|---|---|---|
| 1914 | 664 | 212 | 23 | 3.20 | 15.0 |
| 1915 | 538 | 236 | 23 | 2.91 | 12.0 |
| 1916 | 580 | 223 | 15 | 3.51 | 13.3 |
| 1917 | 726 | 244 | 22 | 1.89 | 12.1 |
| 1918 | 610 | 236 | 21 | 1.29 | 18.6 |
| 1919 | 600 | 211 | 22 | 1.13 | 11.9 |
| 1920 | 573 | 231 | 21 | 1.00 | 10.3 |
| 1921 | 564 | 237 | 23 | 1.28 | 9.3 |
| 1922 | 519 | 246 | 22 | 1.45 | 10.9 |
| 1923 | 653 | 259 | 23 | 1.51 | 11.2 |
| 1924 | 641 | 256 | 22 | 1.49 | 11.9 |
| 1925 | 555 | 267 | 22 | 1.51 | 10.7 |
| 1926 | 637 | 291 | 23 | 1.70 | 9.7 |
| 1927 | 732 | 291 | 25 | 1.78 | 10.2 |
| 1928 | 784 | 284 | 24 | 1.99 | 11.1 |
| 1929 | 741 | 308 | 23 | 1.73 | 11.3 |
The Federation’s statistical reports, 1928 and 1932.
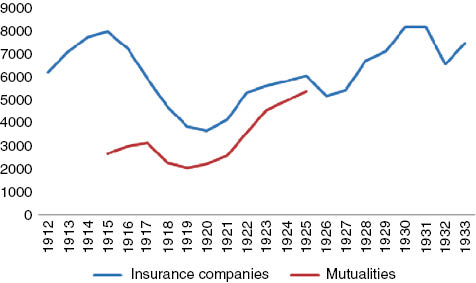
Figure 3
Premiums for sickness insurance in Spain, 1912–1933 (amounts expressed in thousands of pesetas. 1913). Instituto Nacional de Estadística (1919, 1930 and 1934); Pons and Vilar (2011, 81); [INP] 1927; Deflator: Maluquer de Motes (2009).
Table 5
Dates for the passing of laws making social welfare schemes compulsory.
| Accident | Sickness | Old-age pensions | |
|---|---|---|---|
| Great Britain | (1897) 1946 | 1911 | (1908) 1925 |
| France | (1898) 1946 | (1898) 1928 | (1895) 1910 |
| Germany | 1884 | 1883 | 1889 |
| Italy | 1898 | (1886) 1928 | (1898) 1919 |
| Spain | (1900) 1932 | 1944 | (1909) 1919 |
Dates in parentheses refer to subsidized voluntary insurance (Herranz 2010, 62–64).
Table 6
Evolution of public healthcare and federated societies’ sickness beneficiaries.
| Home visits | General medical visits | Accidents | Total assisted | |||
|---|---|---|---|---|---|---|
| 1919 | 272 | 135,311 | 16,537 | 152,120 | 11,817 | 20,855 |
| 1920 | 461 | 126,302 | 17,108 | 143,871 | 11,608 | 18,328 |
| 1921 | 1716 | 104,420 | 16,806 | 122,942 | 11,130 | 16,611 |
| 1922 | 2016 | 121,208 | 14,203 | 137,427 | n.d. | 19,076 |
| 1923 | 2361 | 108,302 | 12,930 | 123,593 | n.d. | 23,399 |
| 1924 | 2784 | 113,416 | 14,862 | 131,062 | 10,795 | 23,579 |
| 1925 | 3683 | 116,402 | 14,518 | 134,603 | 10,961 | 21,817 |
| 1926 | 3271 | 137,890 | 15,204 | 156,365 | 11,105 | 24,789 |
| 1927 | 3450 | 90,251 | 13,259 | 106,960 | 15,812 | 27,240 |
| 1928 | 3718 | 91,428 | 15,623 | 110,769 | 16,789 | 32,165 |
Instituto Nacional de Estadística (1916, 1919, 1920, 1921–22, 1922–23, 1923–24, 1924–25, 1925–26, 1927, 1928, 1929, 1930, 1931, 1932–33, 1934). The Federation’s statistical reports, 1928 and 1932.