
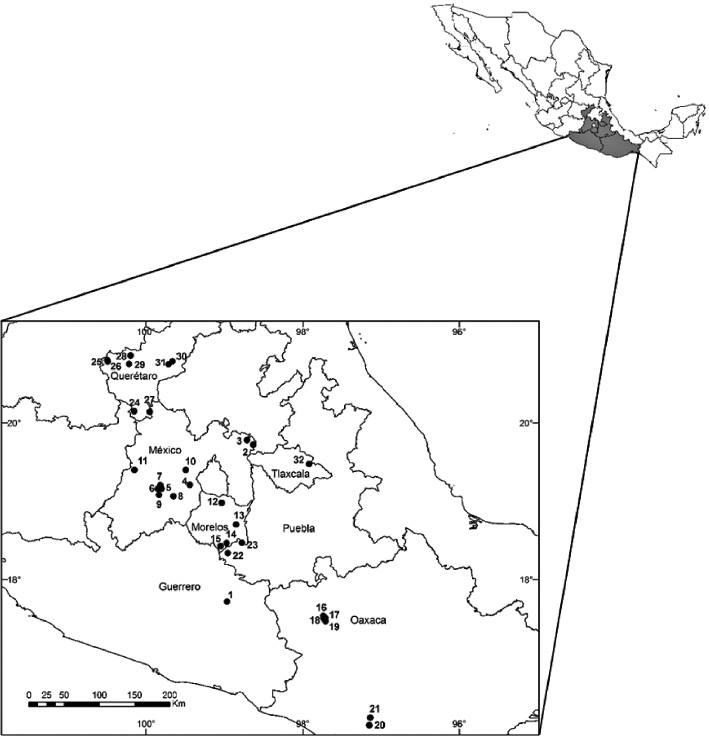
Figure 1
Location of the 32 agrarian centers where the interviews were conducted.
Table 1
Variables of the “level of conservation” indicator.
| Variable | Variable categories |
|---|---|
| Type of vegetation cover | Natural; mixed; other than natural |
| Density of vegetation cover§ | Typical; scarce; absent |
| Degree of soil displacement | No displacement due to lack of slope; no displacement due to vegetation cover; slight displacement; displacement and crack formation |
| Evidence of soil erosion | No evidence; cracks in the ground; rocky outcrops; other |
| Soil fertility | High; medium; low |
§This is a measure of the level of degradation to plant cover. Typical refers to little or no change, scarce refers to a medium change, and absent refers to a major change.
Table 2
Variables of the indicator “ability to continue conservation projects.”
| Variable | Variable category |
|---|---|
| Perception of the authorities on the ability to conserve without support | Yes; No |
| Perception of the civilian on the ability to conserve without support | Yes; No |
| Perception of the civilian on individual losses | None; Several |
| Perception of the civilian on communal losses | None; Several |
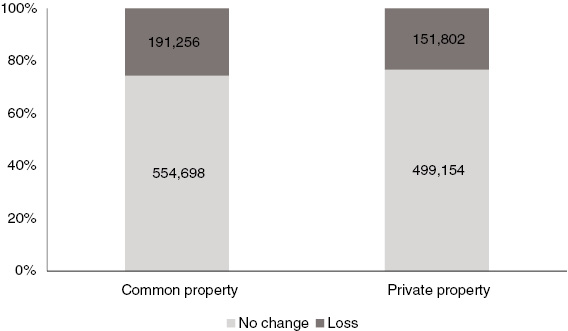
Figure 2
Percentage of change at the national level in primary and secondary vegetation on common and private property between 1976 and 2008. The transformed surface shown for each case is in km2.
Table 3
Biophysical, social and economic variables that had a significant relationship with the “level of conservation” indicator.
| Variable | Mean equality test (p) | High level of conservation | Medium and low level of conservation |
|---|---|---|---|
| Annual mean rainfall | 0.04 | 904 mm | 688 mm |
| Activities conducted in the CPR | 0.08 | Conservation and recreational uses, agricultural, livestock and extractive activities | Agricultural, livestock and extractive activities without conservation and recreational uses |
| Collective conservation workdays conducted in the agrarian centers | 0.01 | More collective conservation workdays | Fewer collective conservation workdays |
| Level of marginalization§ | 0.01 | Low marginalization | High marginalization |
| Distance to a town with more than 15,000 inhabitants | 0.03 | Less than 20 min and a travel cost of 6 cents | More than 20 min and a travel cost greater than 6 cents |
§The level of marginalization was calculated from the index of marginalization published in government statistics (SEGOB 2010).
Table 4
Biophysical, social and economic variables that had a significant relationship with the “ability to continue conservation projects” indicator.
| Variable | Means equality test (p) | Ability to continue (x_) | Without ability to continue (x_) |
|---|---|---|---|
| No. of agrarian centers members | 0.01 | 199 members | 373 members |
| Area of the CPR | 0.02 | 582 ha | 1705 ha |
| Collective conservation workdays conducted in the agrarian centers | 0.03 | More collective conservation workdays | Fewer collective conservation workdays |
| Percentage of total members who participate in meetings | 0.03 | More than 80% of community members are involved in local meetings | Less than 80% of community members are involved in local meetings |
Appendix 1
General characteristics of the agrarian centers where the interviews were conducted.
| State | No. of agrarian center | Total population | Altitude (masl) | Type of vegetation |
|---|---|---|---|---|
| Guerrero | 1 | 689 | 1320 | Lowland deciduous forest |
| México | 2 | 5001 | 2490 | Oak forest |
| México | 3 | 3467 | 2450 | Oak forest |
| México | 4 | 4941 | 2720 | Pine-Oak forest |
| México | 5 | 664 | 3500 | Pine forest |
| México | 6 | 655 | 3040 | Fir forest |
| México | 7 | 560 | 3100 | Fir forest |
| México | 8 | 5307 | 2850 | Pine forest |
| México | 9 | 113 | 3200 | Fir forest |
| México | 10 | 2009 | 1540 | Oak forest |
| México | 11 | 872 | 2500 | Pine forest |
| Morelos | 12 | 1029 | 1620 | Pine-Oak forest |
| Morelos | 13 | 495 | 1300 | Lowland deciduous forest |
| Morelos | 14 | 218 | 1060 | Lowland deciduous forest |
| Morelos | 15 | 113 | 1210 | Lowland deciduous forest |
| Oaxaca | 16 | 231 | 2240 | Pine forest |
| Oaxaca | 17 | 712 | 2360 | Pine forest |
| Oaxaca | 18 | 850 | 2440 | Pine forest |
| Oaxaca | 19 | 184 | 2660 | Pine forest |
| Oaxaca | 20 | 110 | 520 | Mesophyll forest |
| Oaxaca | 21 | 1195 | 600 | Mesophyll forest |
| Puebla | 22 | 145 | 920 | Lowland deciduous forest |
| Puebla | 23 | 1502 | 100 | Lowland deciduous forest |
| Querétaro | 24 | 820 | 2450 | Oak forest |
| Querétaro | 25 | 522 | 2110 | Crassicaule forest |
| Querétaro | 26 | 4089 | 2100 | Crassicaule forest |
| Querétaro | 27 | 3204 | 2390 | Pine-Oak forest |
| Querétaro | 28 | 183 | 2340 | Pine-Oak forest |
| Querétaro | 29 | 2617 | 1980 | Oak forest |
| Querétaro | 30 | 594 | 2550 | Desert scrubland |
| Querétaro | 31 | 1871 | 2330 | Crassicaule scrubland |
| Tlaxcala | 32 | 4967 | 2680 | Desert scrubland |
Appendix 2
Nineteen variables related to the physical, social, and economic characteristics used for discriminant analysis.
| Variables |
|---|
| Type of property (Ejido or communal) |
| Population sizeArea of the community (ha) |
| Area of the CPR (ha) |
| Ethnic membership (Population mainly mestizo, indigenous or mixed) |
| Percentage of migrants in the family |
| Distance to a town with more than 15,000 inhabitants |
| Productive sector (Population dedicated to the primary, secondary and tertiary sector) |
| No. of agrarian centers members |
| Dependence on CPR resources (frequency of resource use + proportion of income) |
| Activities conducted in the CPR (Agricultural, livestock and extractive activities, recreative and conservation) |
| Sanctions for breaking rules (yes, no) |
| No. of government programs |
| Level of participation in social groups (short, medium, high) |
| Environmental degradation (natural vegetation cover, fertility and soil erosion) |
| Level of marginalization (Index. SEGOB 2010) |
| Collective conservation workdays conducted in the agrarian centers (yes, no) |
| Percentage of agrarian centers members who participate in meetings |
| Annual mean rainfall (mm) |
The variables highlighted in bold were those statistically significant (see Tables 3 and 4).