

Figure 1:
Mikania micrantha climbing a tree in Chitwan. (Photo by the authors).
Table 1
Profile of CF characteristics.
| CF | Tamur | Ghaghara | Trishuli | Koshi | Gandaki | 21 CFs surveyed | Data source |
|---|---|---|---|---|---|---|---|
| Total survey respondents (HHs) | 39 | 44 | 50 | 47 | 51 | 1041 | 2014 HH survey |
| Median 2014 HH income (USD) | 700–1400 | 700–1400 | 700–1400 | 700–1400 | 1400–3600 | 700–1400 | 2014 HH survey |
| % minority HHs | 67% | 95% | 80% | 21% | 27% | 49% | 2014 HH survey |
| % HHs own dairy animals | 72% | 73% | 68% | 81% | 45% | 71% | 2014 HH survey |
| Urban? (within in 5 km of nearest city) | No | No | No | No | Yes | 3/21 are urban | geographic data and participant observation |
| Level of trust in national park | Low | Moderate | Low-moderate | Low-moderate | Moderate | N/A | semi-structured interviews and participant observation |
| Level of trust in CFGC | Moderate | Low | Moderate | Moderate | Moderate | N/A | semi-structured interviews and participant observation |
HH, household; CF, community forest; CFGC, community forest governance committee; USD, United States dollars. Survey was conducted in late 2014, response rate was 98%; the ethnographic fieldwork was conducted in mid-2014 and partially informed the survey.
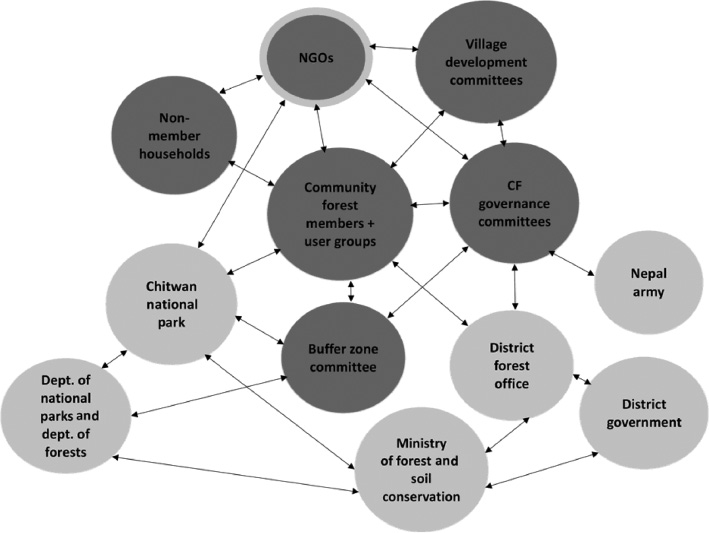
Figure 2:
Governance relationships involved in Mikania management in the buffer zone community forests in the de jure situation. Darker grey circles are local level actors, while lighter grey circles represent district or national level actors (non-governmental organizations – NGOs – are both).

Figure 3:
The Institutional Analysis and Development Framework, adapted from Ostrom et al. (1994).

Figure 4:
Governance relationships involved in Mikania management in the buffer zone community forests in the de facto situation. Faded circles and lines (the lightest grey) represent actors and relationships formally present that do not exist, or are significantly weaker, in practice.

Figure 5:
Perceptions of change in Mikania abundance over the past year, by community forest
Table 2
Major problems identified in each community forest.
| Tamur | Ghaghara | Trishuli | Koshi | Gandaki | |
|---|---|---|---|---|---|
| Flooding | ✓ | ✓ | ✓ | ✓ | |
| Wildlife: Rhinos | ✓ | ✓ | ✓ | ✓ | |
| Wildlife: Elephants | ✓ | ✓ | |||
| Wildlife: Tigers | ✓ | ||||
| Wildlife: Deer and boar | ✓ | ✓ | ✓ | ✓ | ✓ |
| Mikania | ✓ | ✓ | |||
| Stressed/Limited CF resources | ✓ | ||||
| Industrial pollution | ✓ |
Table 3
Presence of Mikania and removal methods.
| Tamur | Ghaghara | Trishuli | Koshi | Gandaki | |
|---|---|---|---|---|---|
| Mikania (presence) | ✓ | ✓ | ✓ | ✓ | ✓ |
| Burning | ✓ | ✓ | |||
| Cutting | ✓ | ✓ | ✓ | ✓ | ✓ |
| Pulling | ✓ | ✓ | ✓ | ✓ | ✓ |
| Pesticides | ✓ | ✓ |

Figure 6:
Percentages of interviewees expressing distrust by community forest
Table 4
Community forest-level differences in information availability via regular communication with NGOs, Chitwan National Park (CNP), and community forest governance committees (CFGC).
| CF members communicate with: | NGO A | NGO B | CNP | CFGC | Overall information availability |
|---|---|---|---|---|---|
| Tamur | ✓ | Medium | |||
| Ghaghara | ✓ | Medium | |||
| Trishuli | ✓ | Medium | |||
| Koshi | Low | ||||
| Gandaki | ✓ | ✓ | ✓ | High |