
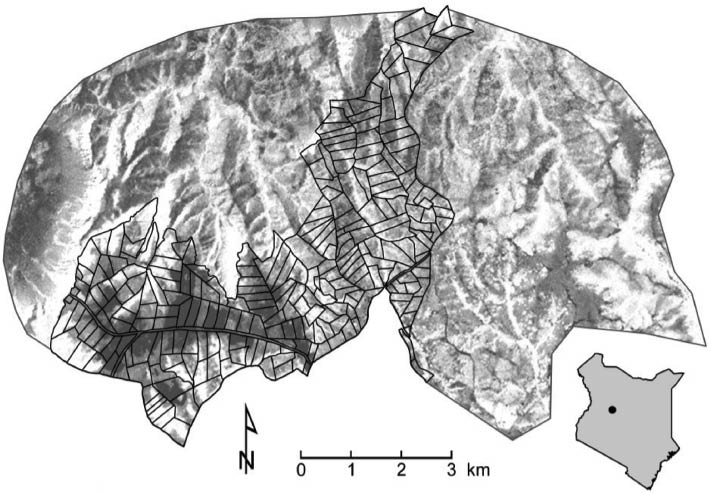
Figure 1
Map of Siambu in Samburu County, Kenya with individual parcels marked. The group ranch extends north and west of the private parcels. Land to the east includes a government forest and other group ranches.
Source: authors’ data.
Table 1
Siambu livestock holdings by wealth quintile, 2010 (n=64).
| Wealth quintile | Total TLU | Percent of total TLU | Mean per adult equivalent TLU |
|---|---|---|---|
| Q1 | 415 | 51.09 | 5.37 |
| Q2 | 195 | 24.00 | 2.05 |
| Q3 | 116 | 14.25 | 1.19 |
| Q4 | 61 | 7.55 | 0.72 |
| Q5 | 25 | 3.07 | 0.18 |
Source: authors’ data.
Notes: Wealth quintiles calculated by ranking all households by household TLU with cutpoints at 20% intervals. TLU is tropical livestock units; 1 cow=1 TLU; 1 sheep=0.12 TLU; 1 goat=0.13 TLU. Per adult equivalent converts as follows: adult male=1; adult female=0.86; children 11–17=0.96; 6–10=0.85; 0–5=0.52.
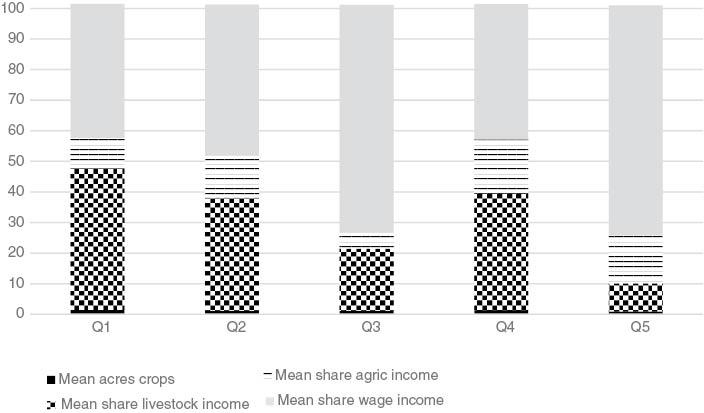
Figure 2
Income shares and crop acreage by wealth quintile (Siambu, 2010, n=60).
Source: authors’ data.
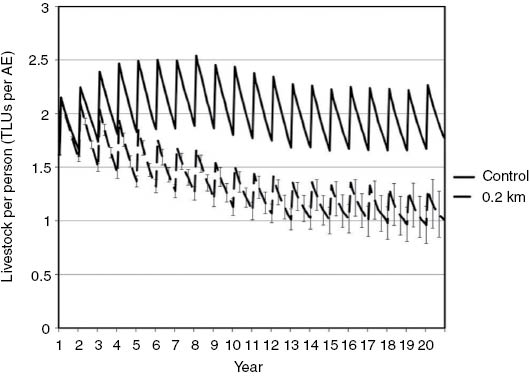
Figure 3
TLU per AE comparing grazing orbit of 10 km (control) and 0.2 km (representing fully fenced individual parcels).
Source: authors’ data.
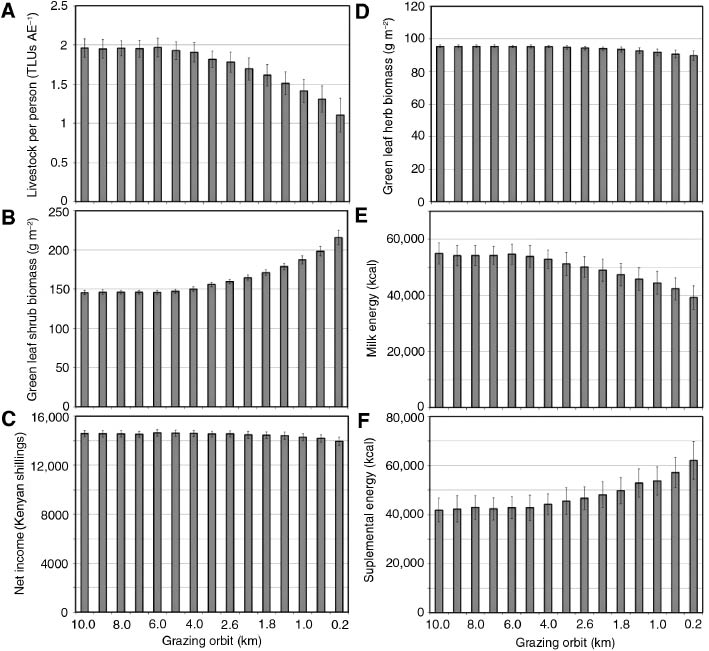
Figure 4
Changes in selected variables by length of grazing orbit.
Source: authors’ data.
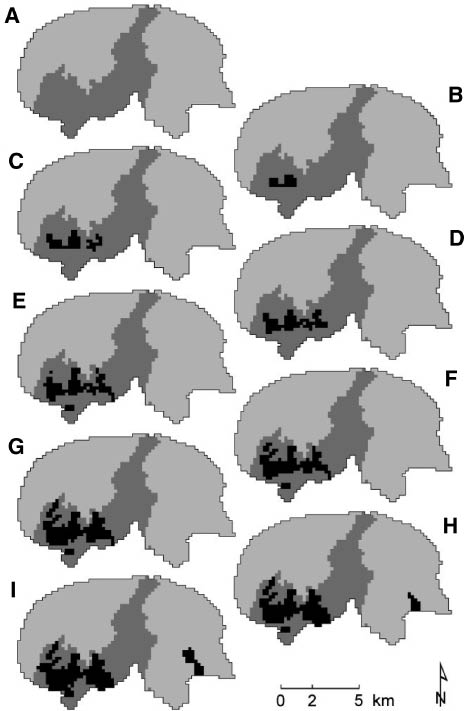
Figure 5
Maps of Siambu showing increased area under wheat cultivation (black shading) from 0% (5A) to 200% of current cultivation (5I).
Source: authors’ data.
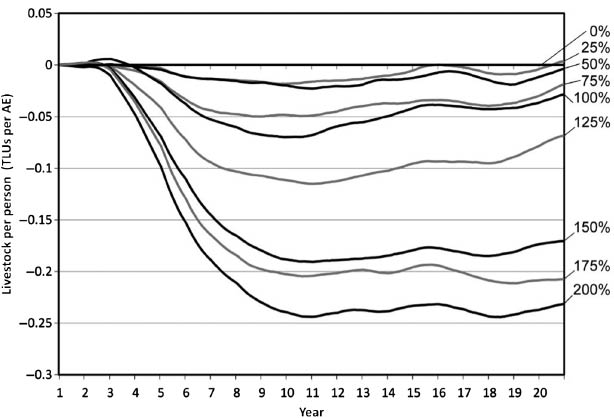
Figure 6
Change over time in TLU per AE comparing different amounts of wheat cultivation from 0% of current cultivation to 200% of current cultivation.
Source: authors’ data.
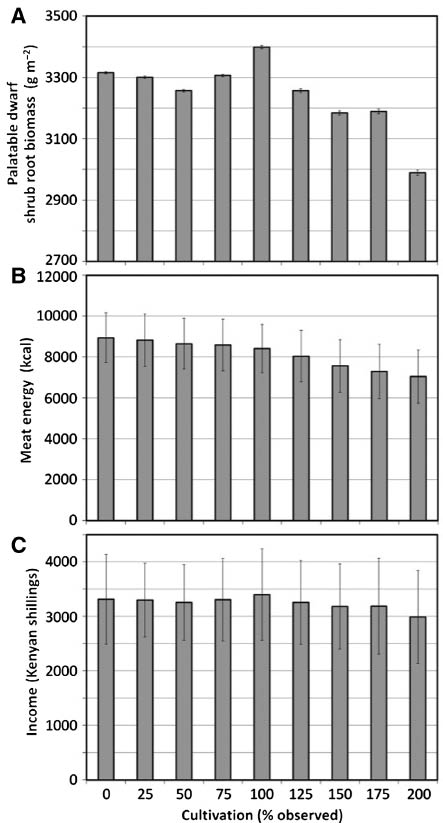
Figure 7
Effects of different levels of cultivation on selected ecological and household variables.
Source: author’s data.