
Table 1
Description of the sample CFUGs.
| Cluster | Name of CFUG | Establishment date | Area in hectare (ha) | No. of Households (hh) | Forest area (ha/hh) |
|---|---|---|---|---|---|
| I | Chelibeti | 2010 | 59.00 | 171 | 0.34 |
| Debidhunga | 2010 | 179.84 | 171 | 1.05 | |
| II | Janakalyan | 2006 | 495.91 | 238 | 2.08 |
| Nibuwatar | 2006 | 491.52 | 195 | 2.52 | |
| III | Pashupati-Kailashpuri | 2001 | 144.71 | 324 | 0.44 |
| Shivapuri | 2001 | 127 | 261 | 0.48 | |
| IV | Parewashori | 1996 | 1316 | 680 | 1.93 |
| Surdevi | 1996 | 199.56 | 456 | 0.43 |
[i] (Source: District forest office, Chitwan).
Table 2
Descriptive statistics of sample CFUGs.
| CFUG | Male | Female | Age (years) | Education (years) | Family size | Native | Migrant | Income Agr | Income off-farm |
|---|---|---|---|---|---|---|---|---|---|
| Chelibeti | 38 | 37 | 38.26 (12.92) | 2.08 (1.38) | 5.36 (1.72) | 8 | 67 | 55 | 20 |
| Debidhunga | 32 | 43 | 38.76 (14.59) | 2.19 (0.85) | 5.49 (1.80) | 63 | 12 | 64 | 11 |
| Janakalyan | 60 | 15 | 44.27 (12.80) | 2.00 (1.15) | 6.26 (1.95) | 20 | 55 | 32 | 43 |
| Nibuwatar | 46 | 29 | 41.33 (12.99) | 1.97 (1.55) | 5.30 (1.81) | 58 | 17 | 45 | 30 |
| Pashupati-Kailashpuri | 39 | 36 | 43.73 (17.35) | 2.53 (1.61) | 6.02 (2.24) | 31 | 44 | 63 | 12 |
| Shivapuri | 33 | 43 | 42.91 (15.77) | 2.34 (1.28) | 6.14 (2.72) | 22 | 54 | 63 | 13 |
| Parewashori | 38 | 36 | 41.13 (17.34) | 2.36 (1.99) | 6.59 (2.57) | 38 | 36 | 58 | 16 |
| Surdevi | 38 | 37 | 44.29 (16.11) | 2.52 (1.99) | 5.84 (2.19) | 19 | 56 | 61 | 14 |
[i] Age, education and family size are average values with standard deviation in the parentheses. The statistics of rest of the variables are in number of households.
Table 3
Households collecting forest products.
| Timber | Fuelwood | Fodder | Grass | Timber (cft) | Fuelwood (Quintal) | Fodder (Bhari ) | Grass (Bhari) | |
|---|---|---|---|---|---|---|---|---|
| Chelibeti | 4 (5) | 58 (78) | 43 (58) | 53 (72) | 21.25 | 9.68 | 80.19 | 71.57 |
| Debidhunga | 3(4) | 66 (88) | 46 (61) | 65 (87) | 1.00 | 69.19 | 160.84 | 158.85 |
| Janakalyan | 2 (2) | 72 (91) | 60 (76) | 65 (82) | 22.50 | 2.29 | 76.75 | 204.26 |
| Nibuwatar | - | 75 (100) | 65 (87) | 63 (84) | - | 1.45 | 66.25 | 105.90 |
| Pashupati-Kailashpuri | 11 (15) | 67 (89) | 39 (52) | 49 (65) | 26.55 | 3.07 | 45.33 | 64.55 |
| Shivapuri | 14 (18) | 62 (82) | 42 (55) | 48 (63) | 16.07 | 14.28 | 89.38 | 78.83 |
| Parewashori | 40 (53) | 66 (88) | 35 (47) | 52 (69) | 65.68 | 39.00 | 139.74 | 247.06 |
| Surdevi | 17 (23) | 72 (96) | 32 (43) | 49 (65) | 34.29 | 8.90 | 49.22 | 86.82 |
Table 4
Description of annual household costs of forest management (in NRs).
| CFUG | Annual fee | Transaction | Forest management | Material | Forest products (‘000) | Opera. Plan revise | Total (‘000) | Cost/ ha (‘000) |
|---|---|---|---|---|---|---|---|---|
| Chelibeti | 10 | 568 (1) | 795 (2) | 517 (1) | 45 (95) | 373 (1) | 47 | 60 |
| Debidhunga | 10 | 435 (2) | 1676 (9) | 487 (3) | 16 (84) | 373 (2) | 19 | 8 |
| Janakalyan | 20 | 362 | 719 (1) | 747 (1) | 71 (97) | 427 (1) | 73 | 11 |
| Nibuwatar | 10 | 309 (1) | 1551 (3) | 638 (1) | 51 (95) | 400 (1) | 53 | 8 |
| Pashupati | 20 | 436 (2) | 1198 (4) | 478 (2) | 25 (91) | 400 (1) | 27 | 14 |
| Shivapuri | 30 | 779 (1) | 843 (1) | 370 (1) | 54 (96) | 395 (1) | 56 | 33 |
| Parewashori | 25 | 4114 (5) | 1242 (2) | 742 (1) | 61 (77) | 12,162 | 67 | 4 |
| Surdevi | 50 | 813 (3) | 990 (3) | 528 (2) | 28 (91) | 400 (1) | 31 | 11 |
[i] Figure in the parenthesis indicates percentage of total household costs.
Table 5
Annual household benefits from CF management in NRs.
| CFUG | Other activities | Forest management | Forest products | CFUG support | Total |
|---|---|---|---|---|---|
| Chelibeti | 30 | 0 | 50,623 (99) | 427 (1) | 51,080 |
| Debidhunga | 48 | 0 | 16,291(96) | 579 (4) | 16,918 |
| Janakalyan | 30 | 185 | 73,171 (100) | 0 | 73,386 |
| Nibuwatar | 182 | 542 (1) | 51,382 (99) | 0 | 52,106 |
| Pashupati | 78 | 0 | 39,448 (99) | 420 (1) | 39,946 |
| Shivapuri | 107 | 7740 (11) | 64,771 (89) | 76 | 72,694 |
| Parewashori | 386 | 34 | 165,509 (99) | 719 | 166,649 |
| Surdevi | 223 | 1 | 54,772 (99) | 307 (1) | 55,303 |
[i] Figure in the parenthesis indicates percentage.
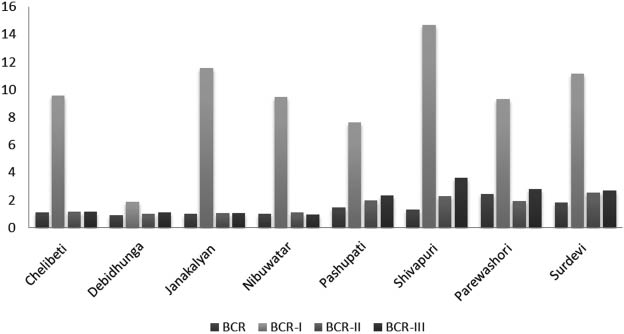
Figure 1
Benefit-cost ratio under different scenarios.