
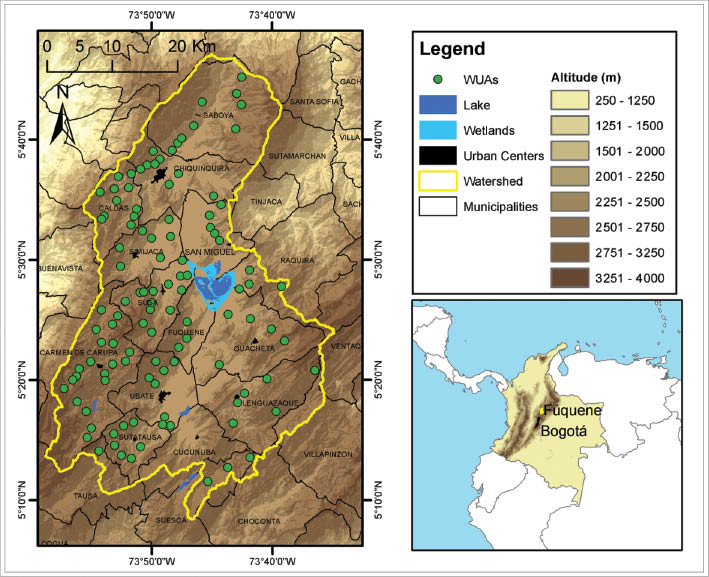
Figure 1
Fúquene Watershed location.
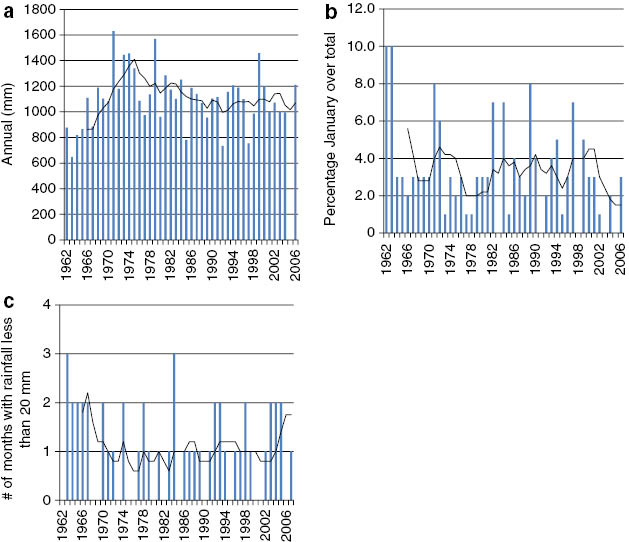
Figure 2
Precipitation trends in northern station: (a) annual rainfall (mm), (b) January fraction (%) and (c) dry spells (# of months with rainfall <20 mm). (Black line is 5-year moving average).
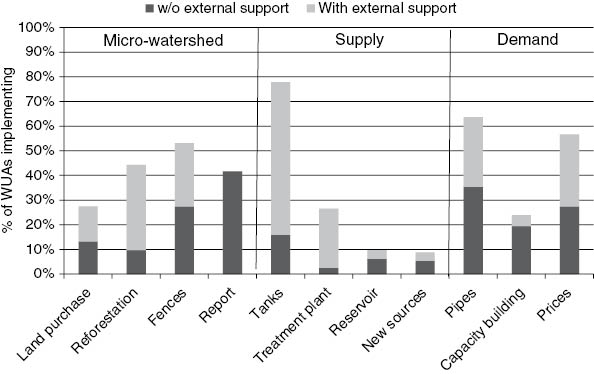
Figure 3
Percentage of WUAs implementing adaptation strategies.
Table 1:
Summary independent variables.
| Variables | Description | Expected | Mean | S.D. | Min. | Max. |
|---|---|---|---|---|---|---|
| Socio-economic settings | ||||||
| Mun. water invest | 5-Year avg $US/hab | + | 30.3 | 11.6 | 13.1 | 55.5 |
| Rural poverty | % of households | – | 36.4 | 10.3 | 24.0 | 62.3 |
| Rural pop density | Pop/Km2 | + | 51.9 | 28.0 | 23.3 | 141.5 |
| Resource systems and units | ||||||
| Summer rainfall | % of total annual rain | – | 16.2 | 0.9 | 15.1 | 18.6 |
| Land cover change | % of change 1987–2005 | – | –16.2 | 24.1 | –54.9 | 24.3 |
| Governance system | ||||||
| Legal registry | 1=yes | + | 0.6 | 0.4 | 0.0 | 1.0 |
| Actors | ||||||
| WUA size | # users | ± | 126.1 | 121.8 | 12.0 | 575 |
| WUA income | US$/month/user | + | 1.1 | 1.1 | 0.0 | 6.3 |
| WUA experience | Years | + | 16.9 | 9.5 | 0.1 | 43 |
| Leader education | Years | + | 8.3 | 4.8 | 1.0 | 16 |
| Leader resides inside community | 1=inside | ± | 0.8 | 0.3 | 0.0 | 1.0 |
| Interactions | ||||||
| Request external support | % of total strategies | + | 33.4 | 19.4 | 0.0 | 70 |
| WUA political connections | % | + | 60.9 | 36.3 | 0.0 | 100 |
Table 2
OLS regression results.
| Model 1 | Model 2 | Model 3 | Model 4 | |
|---|---|---|---|---|
| Socioeconomic settings | ||||
| Municipal water investment | 0.002 | –0.002 | 0.008 | 0.006 |
| Rural poverty | –0.018 | –0.029* | 0.005 | 0.021 |
| Rural population density | –0.003 | –0.005 | –0.001 | –0.005 |
| Resource systems and units | ||||
| Summer rainfall | –0.078** | –0.057 | –0.057 | –0.161*** |
| Land cover change | –0.008** | –0.010** | 0.001 | 0.007 |
| Governance systems | ||||
| Legal registry | 0.244 | –0.031 | 0.390* | 0.268 |
| Actors | ||||
| WUA size | 0.000 | 0.000 | 0.002** | 0.002** |
| WUA income | 0.024 | 0.044 | 0.019 | 0.261*** |
| WUA experience | 0.029*** | 0.014 | 0.023** | 0.014 |
| Leader education | 0.002 | –0.011 | 0.033 | 0.007 |
| Leader resides inside community | 0.238 | 0.363 | –0.166 | –0.481* |
| Interactions | ||||
| Request external support | 2.829*** | 2.688*** | 0.378 | 0.281 |
| WUA political connections | 0.497** | 0.376 | 0.481** | 0.003 |
| Constant | 0.831 | 1.560 | –0.327 | 3.591* |
| Adjusted R2 | 0.553 | 0.358 | 0.198 | 0.205 |
[i] N=104. Table shows regression coefficients. *p<0.1, **p<0.05, ***p<0.01.
Dependent Var: Model 1 (Overall Adaptation Index), Model 2 (Micro-Watershed Strategies), Model 3 (Water Supply Strategies), and Model 4 (Water Demand Strategies) Index.
Table 1:
Index weights (based on Principal Component Analysis).
| Overall Adaptation Index | Watershed Strategies Index | Supply Strategies Index | Demand Strategies Index | |
|---|---|---|---|---|
| Land Purchase | 0.671 | 0.564 | ||
| Reforestation | 0.673 | 0.776 | ||
| Fences | 0.495 | 0.707 | ||
| Report | 0.513 | 0.592 | ||
| Tanks | 0.294 | 0.218 | ||
| Treatment Plant | 0.215 | 0.776 | ||
| Reservoir | 0.351 | 0.629 | ||
| New Sources | 0.212 | 0.581 | ||
| Pipes | 0.501 | 0.311 | ||
| Capacity Building | 0.058 | 0.635 | ||
| Prices | 0.000 | 0.778 | ||
| % of variance explained by 1st component | 17.876 | 44.273 | 34.583 | 36.812 |
[i] Note: The Overall Adaptation Index has a relatively low percentage of variance explained by the first component. Other components also explain some of the variability, but only the first component has positive coefficients. This result is similar to previous studies (Vyas and Kumaranayake 2006), and could be explained by the relatively higher number of variables used in the analysis (Vyas and Kumaranayake 2006).
Table 2:
Correlation among independent variables.
| Municipal Water Investment | Rural Poverty | Rural Population density | Summer Rainfall | Land cover change | Legal registry | WUA Size | WUA Income | WUA experience | Leader education | Resides | Request external support | WUA Political connections | |
|---|---|---|---|---|---|---|---|---|---|---|---|---|---|
| Mun. Water Inv. | 1.000 | ||||||||||||
| Rural Poverty | –0.666 | 1.000 | |||||||||||
| Rural Pop.density | 0.426 | –0.413 | 1.000 | ||||||||||
| Summer Rainfall | 0.259 | –0.323 | –0.010 | 1.000 | |||||||||
| Land cover Ch. | 0.663 | –0.437 | 0.053 | 0.159 | 1.000 | ||||||||
| Legal registry | –0.214 | 0.065 | –0.162 | –0.140 | –0.167 | 1.000 | |||||||
| WUA Size | –0.222 | 0.081 | –0.008 | 0.066 | –0.254 | 0.274 | 1.000 | ||||||
| WUA Income | 0.147 | –0.321 | 0.111 | 0.320 | 0.008 | 0.153 | 0.101 | 1.000 | |||||
| WUA experience | 0.173 | –0.283 | 0.284 | 0.127 | 0.004 | –0.147 | 0.118 | 0.034 | 1.000 | ||||
| Leader education | 0.036 | –0.221 | 0.110 | 0.036 | 0.014 | 0.226 | 0.234 | 0.286 | –0.049 | 1.000 | |||
| Resides | 0.134 | 0.002 | 0.015 | –0.064 | 0.189 | –0.030 | 0.070 | –0.209 | 0.091 | –0.267 | 1.000 | ||
| Request external | –0.035 | 0.131 | –0.025 | –0.072 | –0.022 | 0.234 | 0.138 | –0.056 | –0.020 | 0.016 | –0.035 | 1.000 | |
| WUA Political | 0.042 | –0.039 | –0.012 | 0.080 | 0.051 | –0.132 | 0.132 | –0.100 | 0.062 | 0.066 | 0.026 | 0.313 | 1.000 |