
Table 1
State of the pastoral sector in CCA transition countries in 2008
| 1000 ha | % Of agricultural area | Small ruminants (heads) | Cattle | TLUi | |||
|---|---|---|---|---|---|---|---|
| % (1995–2008) | ha per TLU1 | ||||||
| Armenia | 1244 | 71 | 637,101 | 629,146 | 599,280 | 0.2 | 2.08 |
| Azerbaijan | 2669 | 56 | 8,109,713 | 2,212,800 | 3,281,543 | 4.5 | 0.81 |
| Georgia | 1940 | 77 | 797,100 | 1,031,000 | 932,670 | 0.3 | 2.08 |
| Kazakhstan | 185,000 | 89 | 16,080,000 | 5,840,900 | 7,596,675 | –2.3 | 24.35 |
| Kyrgyzstan | 9374 | 87 | 4,251,816 | 1,168,030 | 1,726,386 | –1.2 | 5.43 |
| Mongolia | 114,887 | 99 | 38,331,700 | 2,503,400 | 9,543,890 | 5.1 | 12.04 |
| Tajikistan | 3856 | 82 | 3,798,430 | 1,702,540 | 2,036,591 | 2.9 | 1.89 |
| Turkmenistan | 30,700 | 94 | 18,274,900 | 2,157,700 | 5,273,255 | 8.7 | 5.82 |
| Uzbekistan | 22,000 | 83 | 12,625,000 | 7,458,000 | 8,118,500 | 1.9 | 2.71 |
Data source: FAOSTAT (2011).
iTLU, Tropical livestock unit; 1TLU, 0.75 cattle or 0.2 small ruminants (FAO 1999).
Table 2
Economic development indicators in 2008 for CCA countries.
| In billions of 2005 US$ | In 2005 US$ per capita | % Change per year | Agriculture | Industry | Services | |
|---|---|---|---|---|---|---|
| Armenia | 7 | 2192 | 6.9 | 17.4 | 44.5 | 38.1 |
| Azerbaijan | 25 | 2758 | 10.8 | 6.2 | 69.4 | 24.4 |
| Georgia | 8 | 1834 | 2.3 | 10.2 | 21.5 | 68.4 |
| Kazakhstan | 71 | 4530 | 3.3 | 5.4 | 41.5 | 53.1 |
| Kyrgyzstan | 3 | 574 | 8.4 | 28.8 | 19.1 | 52.1 |
| Mongolia | 3 | 1127 | 8.9 | 22.3 | 38.0 | 39.7 |
| Tajikistan | 3 | 428 | 7.9 | 23.2 | 30.3 | 46.5 |
| Turkmenistan | 12 | 2424 | 10.5 | 22.6 | 41.9 | 35.5 |
| Uzbekistan | 18 | 658 | 9.0 | 26.2 | 30.4 | 43.4 |
Data source: ESCAP (2010, 2012).
Table 3
Legal reorganisation and implementation of pasture access in CCA countries.
| Country | Year of legal reorganisation | Legal regulations | State of implementation | Reference (year of data collection) |
|---|---|---|---|---|
| Armenia | N/A | N/A | N/A | |
| Azerbaijan | 2000 | Individualised lease contracts | Full implementation | See case study (2007/2008) |
| Georgia | 1996, 1998, 2010 | Leasing of state land, between 1996 and 2005 through district administrations, since 2006 through municipalities | Partly implemented, unregulated competencies of land ownership between state and municipalities led partly to annulment of contracts; regulation of competencies urgently needed | Gvaramia 2013 (N/A; newest information cited from 2012) |
| Kazakhstan | 2003 | Private ownership possible, shared lands remain under state ownership | Insufficient due to lack of staff and lack of skills | Schillhorn van Veen et al. 2004 (N/A; newest information cited from 2003) |
| Kyrgyzstan | 2002, amended 2004; changed approach in 2009 | State land leased to users; after 2009: Management responsibility lies with user commitees | Most remote land under de facto community use, administrative procedures too complicated; no information on implementation after 2009 | Undeland 2005 (N/A; newest information cited from 2005); for changes after 2009: Crewett 2012 (2008/2009) |
| Mongolia | 1994; amendements 2002 and (2008) | Possession of campsites by individuals, possession and management of pastures in groups; regional and local administrations shall regulate pasture use | Allocation of campsites widespread; no effective regulation of pasture management and mobility | Fernandez-Gimenez and Batbuyan 2004 (1999); Fernandez-Gimenez et al. 2008 (2006) |
| Tajikistan | 2004 | Variety of leasing options for state land: individual/collective; permanent heritable/long term/short term | Majority of herders hold pasture shares in collective farms; physical distribution has begun; remote pastures remain unused | Robinson and Whitton 2010 (N/A; earlier than 2007) |
| Turkmenistan | 1994/1995, amendements 1999, 2000 | Management rights with collective farms; use rights for single plots distributed to herders of state-owned animals | Implemented, persistence of structures from Soviet period | Behnke et al. 2005 (2003/2004) |
| Uzbekistan | N/A | N/A | Persistence of structures from Soviet period | Zanca 2000 (1998) |
Source: own compilation.
Table 4
Number of contracts issued each year in Gedebey district (study site 4).
| Year | 2000 | 2001 | 2002 | 2003 | 2004 | 2005 | 2006 | 2007 | 2008 |
| Number of contracts | 0 | 1 | 0 | 0 | 0 | 13 | 38 | 16 | 0 |
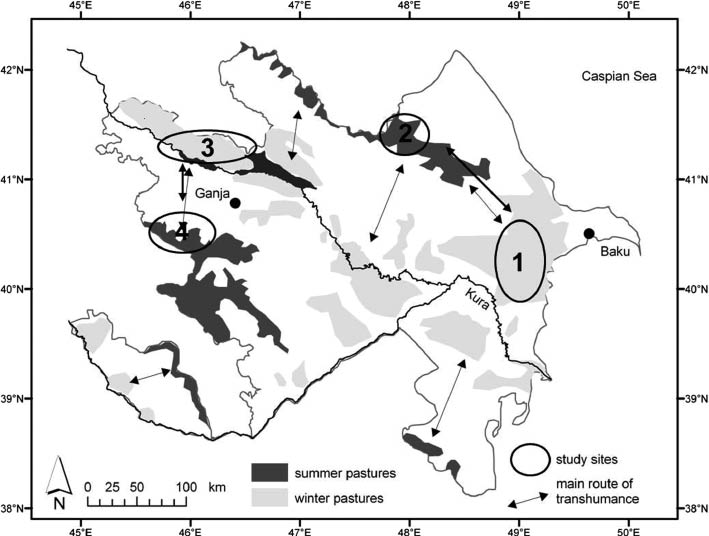
Figure 1
Pastures in Azerbaijan and study sites.
1: Gobustan, 2: Shahdag, 3: Jeiranchel, 4: Gedebey.
Map source: Aliyev et al. 1965.
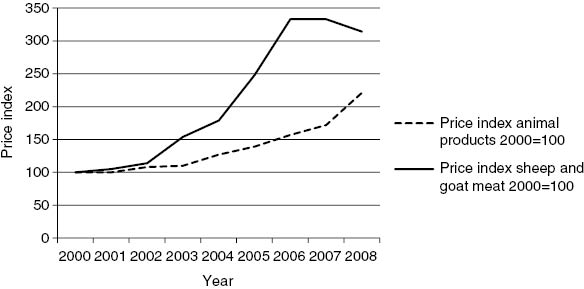
Figure 2
Development of price indexes for livestock products in Azerbaijan.
Data source: SSCA 2008.