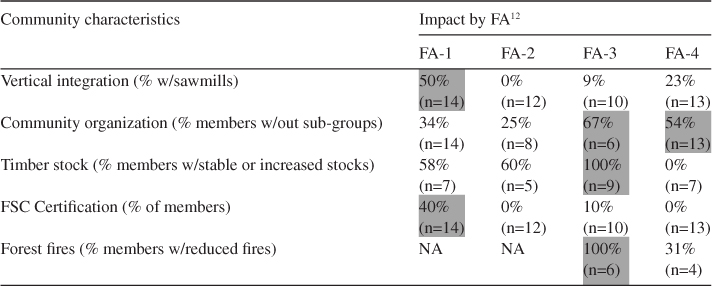
Figure 1
Durango.
Source: SRNyMA (2006).
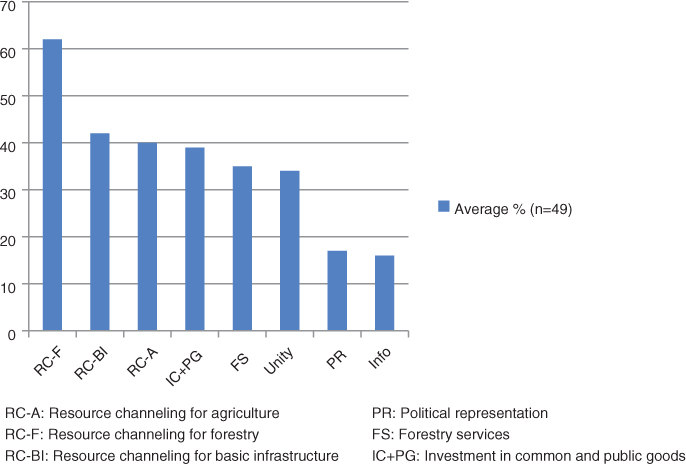
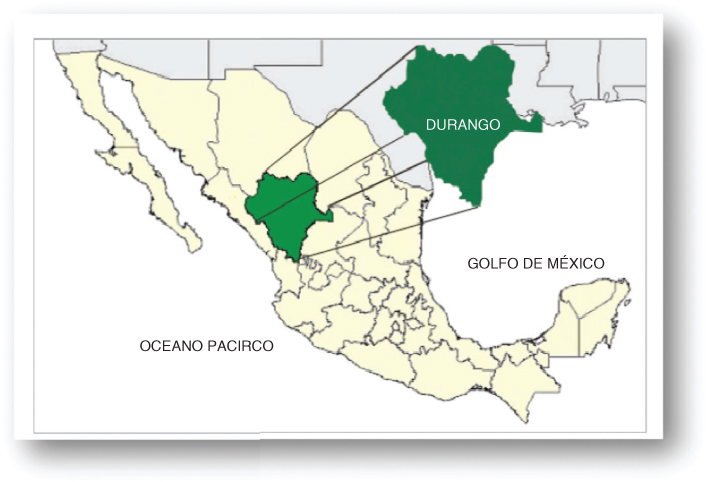
Figure 2
Average percentage of member communities perceiving benefits across the four FAs, by category.
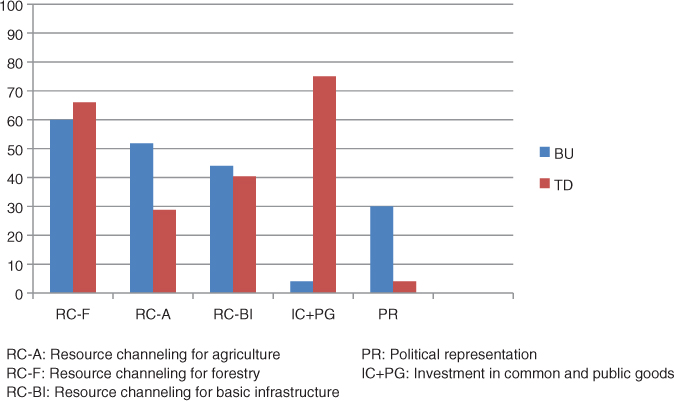
Figure 3
Differences in perceived benefits between the TD and BU FAs.
Table 1
Basic characteristics of 4 FAs in sample
| Name | Year | Origins | Forestry services | Members | Total forest area (ha) | Timber volume (m3) |
|---|---|---|---|---|---|---|
| FA-1 | 1968 | BU | No | 40 coms*, | 474,543 | Pine: 385,521 |
| 33 pp** | Oak: 102,739 | |||||
| (77 tot) | TOT: 504,914 | |||||
| FA-2 | 1994 | BU | Yes | 12 coms | 52,833 | Pine: 39,477 |
| (12 tot) | Oak: 16,900 | |||||
| TOT: 56,377 | ||||||
| FA-3 | 1986 | TD | Yes | 10 coms, | 186,000 | Pine: 167,825 |
| 178 pp | (approx.) | Oak: 39,901 | ||||
| (188 tot) | TOT: 216,933 | |||||
| FA-4 | 2003 | TD | No | 13 coms, | 56,638 | Pine: NA |
| 8 pp | Oak: NA | |||||
| (21 tot) | TOT: 73,831 |
*coms, communities.
**pp, private (smallholder) properties.
Table 2
Perceived benefits from member communities in the four FAs in the study, by category
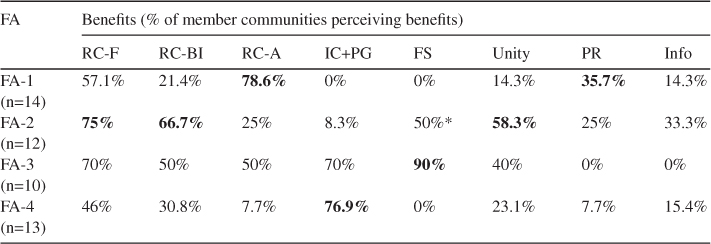
*n=8, The number of member communities that actually contract with the FAs’ forestry services.
RC-A, Resource channeling for agriculture; RC-F, Resource channeling for forestry; RC-BI, Resource channeling for basic infrastructure; PR, Political representation; FS, Forestry services; IC+PG, Investment in common and public goods.