Figure 1:
Average contribution in the PGGs, separated for each round and experimental condition.

Figure 2:
Average punishment (above) and reward (below) assigned (left) and carried out (right) for different deviations from the average contribution of other group members, separated for each experimental condition.
Table 1:
Tobit regression on contribution decisions with random effects at subject level (5460 decisions, of which 2376 censored, by 182 subjects).
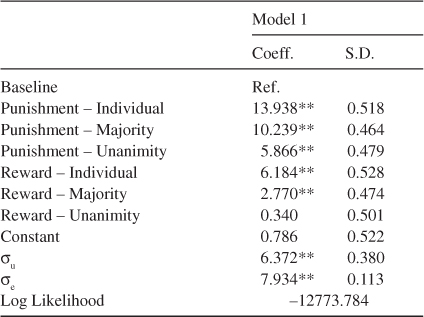
*Significant at .05-level; ** Significant at .01-level (2-sided).
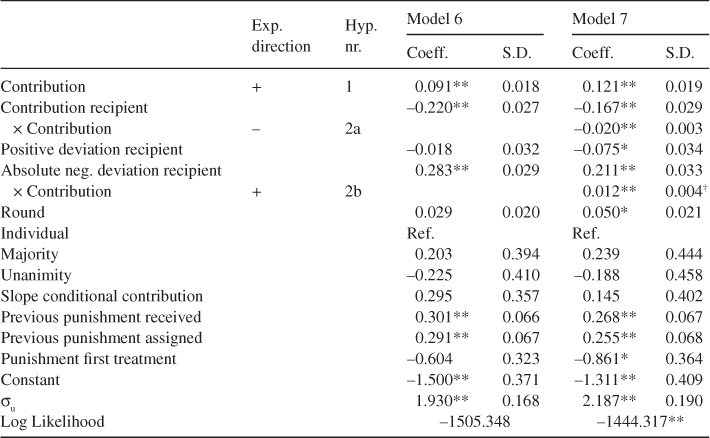
Table 2:
Tobit regression on contribution decisions in the punishment conditions with random effects at subject level (1638 decisions, of which 345 censored, by 182 subjects).

*Significant at .05-level; ** Significant at .01-level (2-sided).
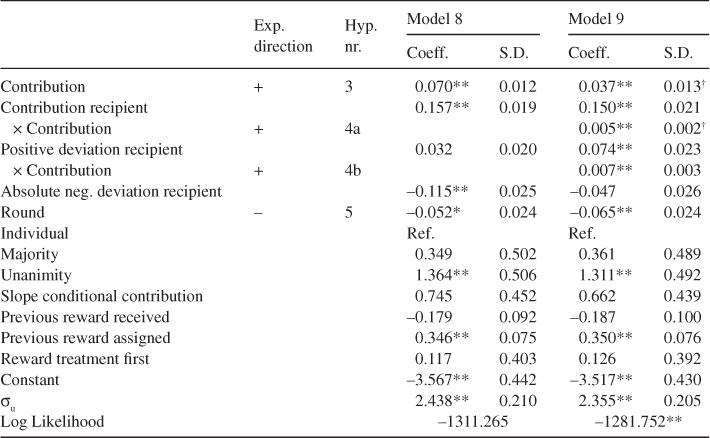
Table 3:
Tobit regression on contribution decisions in the reward conditions with random effects at subject level (1638 decisions, of which 981 censored, by 182 subjects).

*Significant at .05-level; ** Significant at .01-level (2-sided).