
Table A1:
Synthetic list of CPR variables as applied to Rhine case.
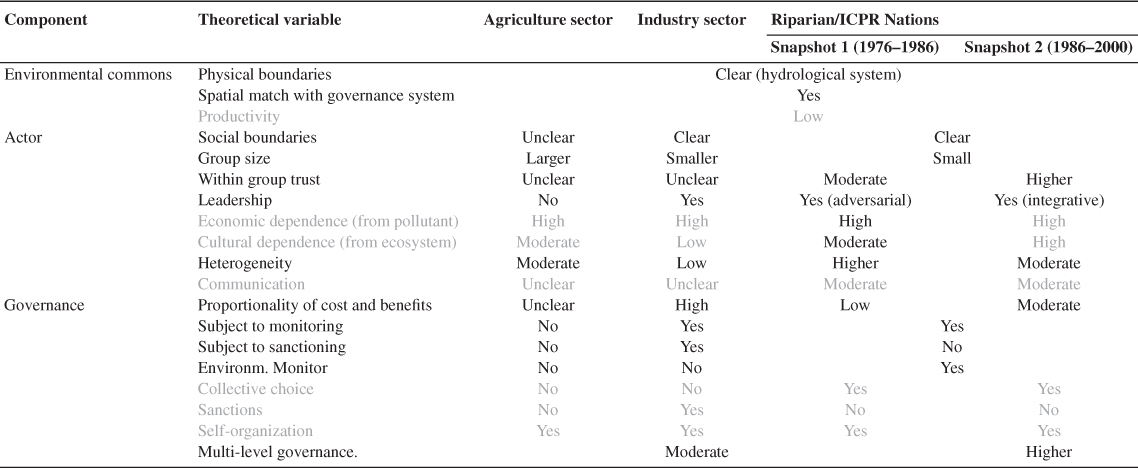
Note: Irrelevant or inconclusive variables are in grey.
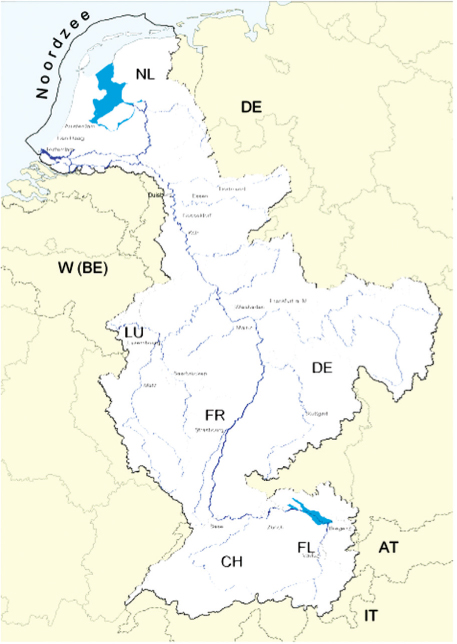
Figure 1:
Map of the Rhine watershed.
Source: Elaborated from (ICPR 2012d)
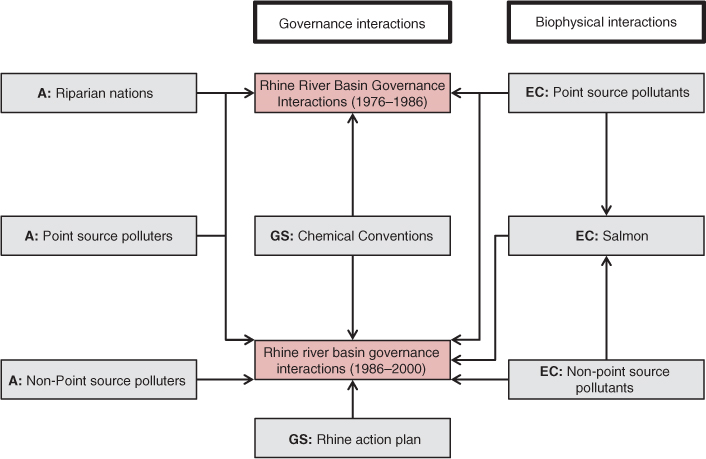
Figure 2:
Structure of the Rhine SES during the two snapshots coded. The figure highlights the interaction between components.
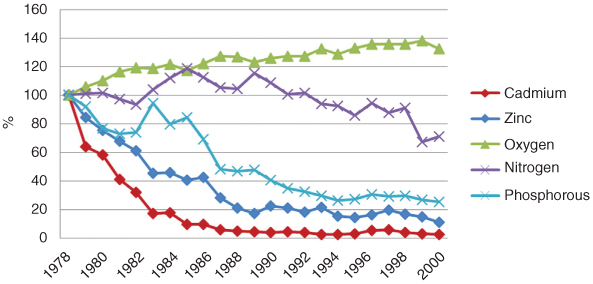
Figure 3:
Changes in concentration levels of selected substances pre- and post-1986 (base year=1978).
Source: elaborated from (ICPR 2012b).
Table 1:
Major events characterizing the governance of the Rhine.
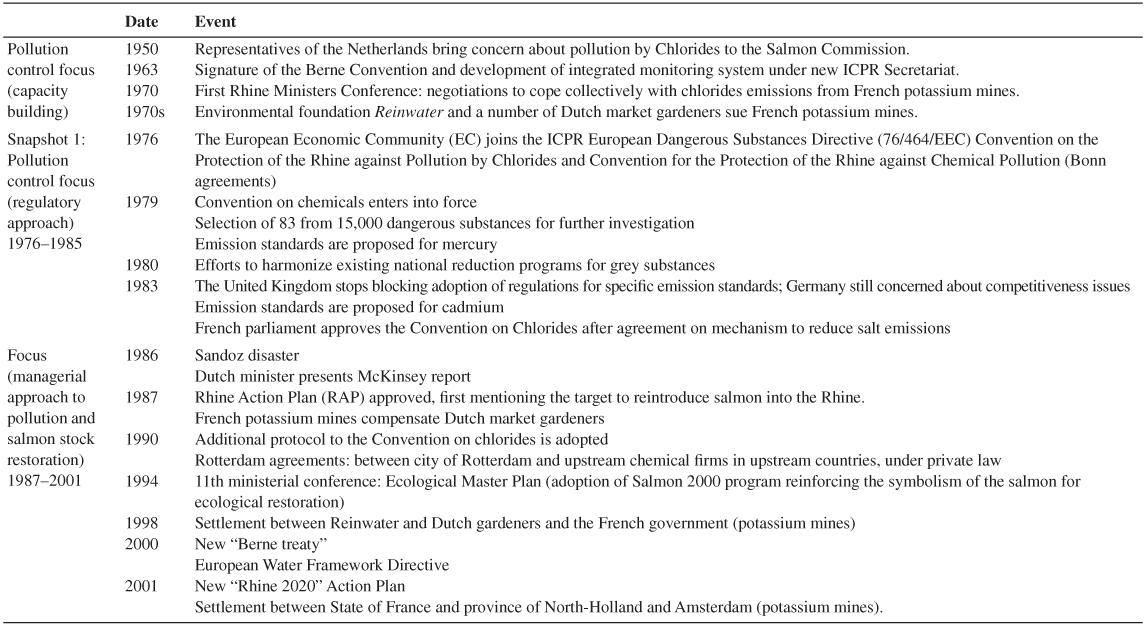
Note: “Snapshot” refers to relevant governance periods used in the analysis of this case (see Methods section for further explanation).
Table 2:
Relevant variables in the Rhine case.
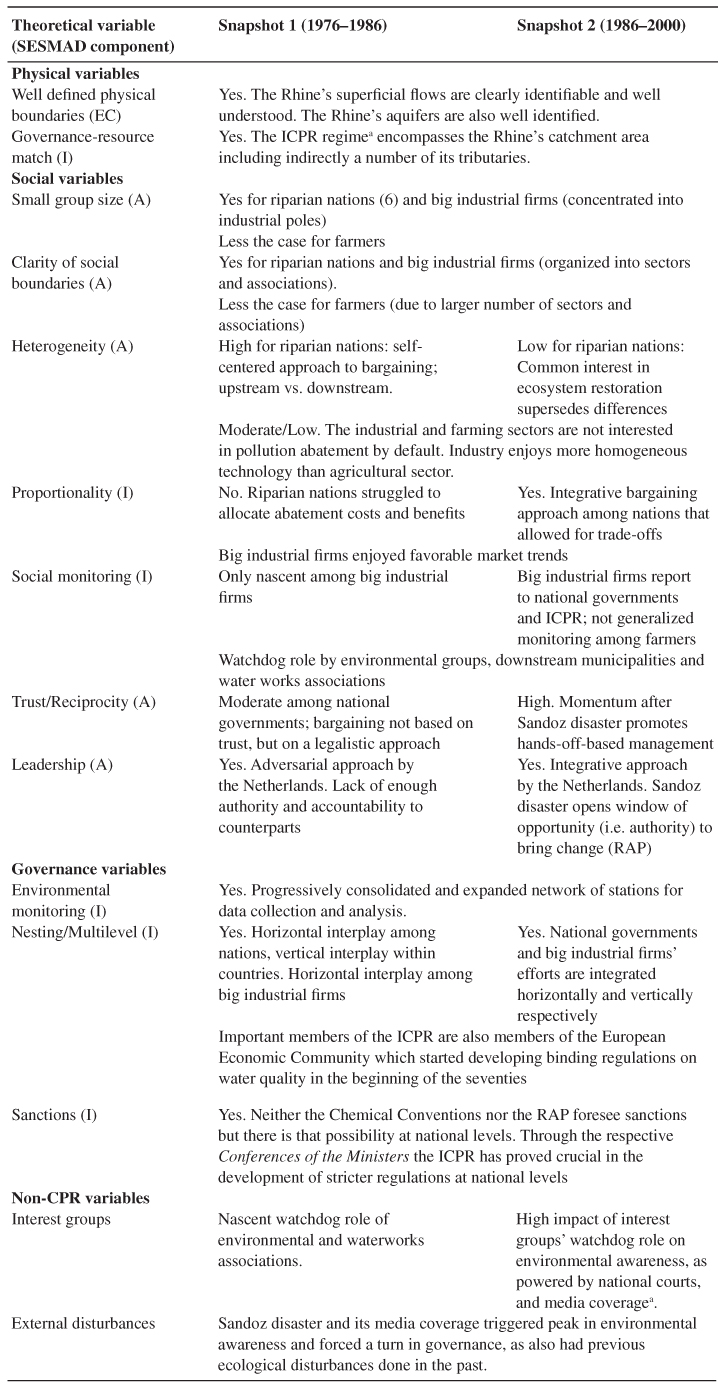
aThe ICPR does not directly encompass the whole catchment area. However, for the benefit of the Rhine and its main tributaries like Moselle and Sarre, the members of the ICPR (Switzerland, France, Germany, Luxemburg, Netherlands and the European Commission) successfully co-operate with Austria, Liechtenstein, the Belgian region of Wallonia and Italy (Mostert 2009).
Note: A: Actor table; EC: Environmental Commons table; I: Interactions table.