
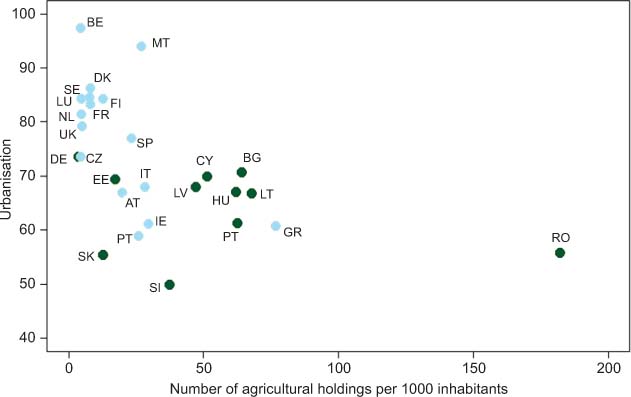
Figure 1
Number of agricultural holdings per thousand inhabitants compared to percentage urban population for each country in the EU27, in 2007. Blue circles = Western Europe, green circles Central and Eastern Europe. Points are labelled with country abbreviations (RO=Romania). (Source: Eurostat 2011 for agricultural holdings, FAOSTAT 2012 for urban population).
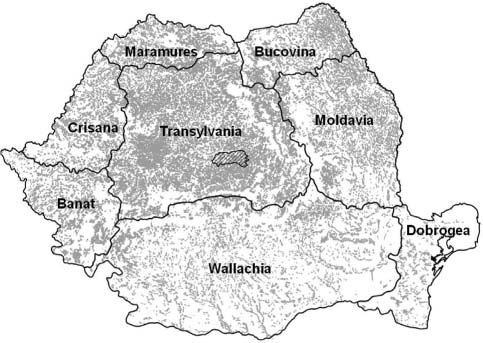
Figure 2
Map of Romania showing the location of the Târnava Mare study region (hatched). Grey shading shows distribution of pasture taken from CORINE Landcover Data 2006 (European Environment Agency 2010).
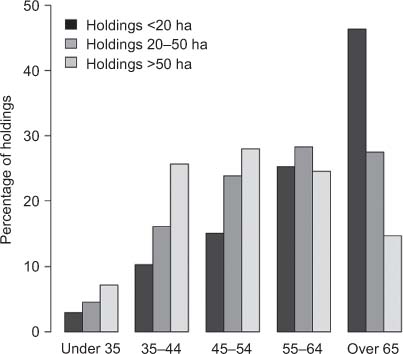
Figure 3
Distribution of small (under 20 ha, average size for this size class is 4.5 ha), medium (20–50 ha, average 30 ha), and large (over 50 ha – average 300 ha) farm holdings in Romania per age-group of farm manager. Source: Eurostat 2009.
Table 1:
Overview of the three main types of common pasture use in Romania (based on Mantescu 2009).
| Commons type | Property rights | Use rights | Administration | Main distribution |
|---|---|---|---|---|
| Composesorat | Private property of the local community | Can be restricted to members (although not always); membership usually inherited | Elected members | (Hungarian speaking) Transylvania and Northern Romania |
| Obşte | Private property of the local community | Restricted to members; membership sometimes inherited, sometimes through residence | Elected members | Regions of Wallachia and Moldavia |
| Izlaz | Public property of the local community | Any inhabitant of the municipality | Mayor and elected pastoral committee | Throughout Romania |