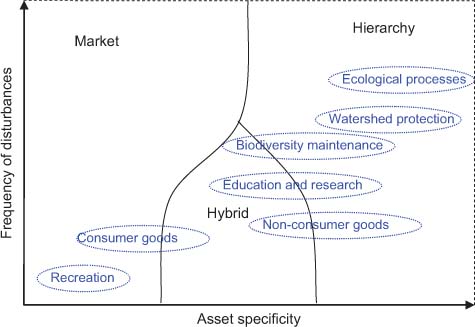
Figure 1
Location of goods and services provided by protected areas on the chart presenting organization form responses to changes in the frequency of disturbances and asset specificity (the chart of organization forms adapted from Williamson (1996, 117).
Table 1
Examples of natural goods and services provided by protected areas that benefit human life (adapted from Dixon and Sherman 1991, 70)
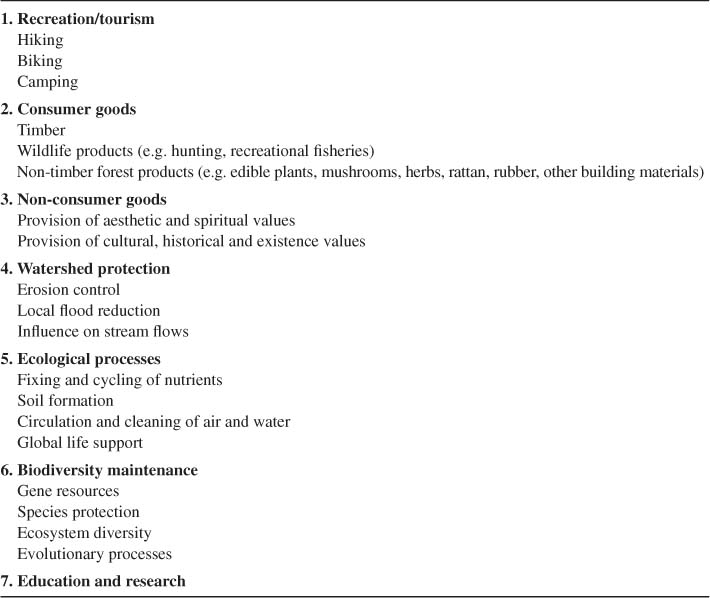
Table 2
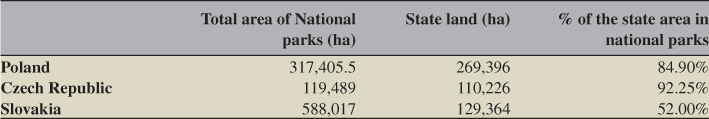
Protected areas in Poland, Czech Republic, Slovakia in 2011, excluding Natura 2000 sites
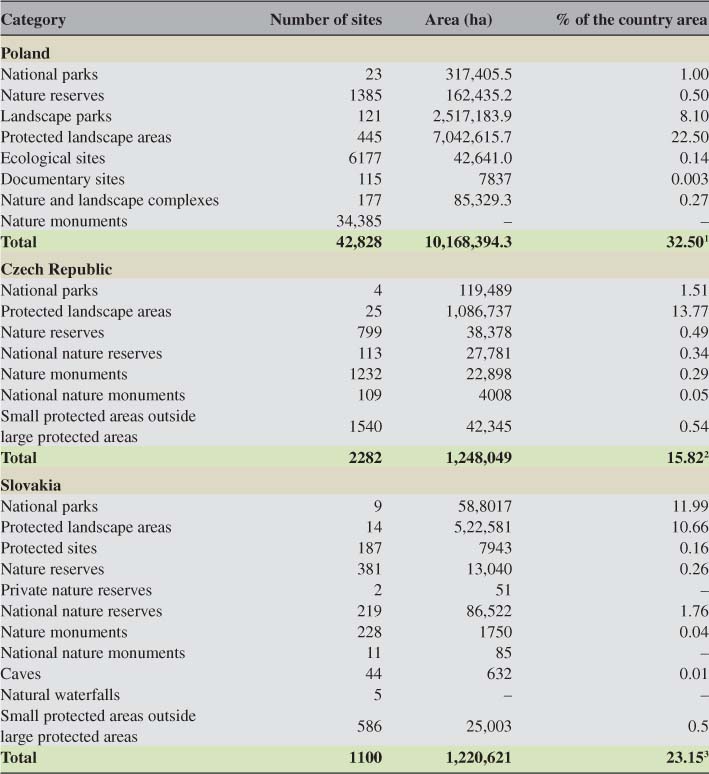
Source: adapted from Walczak et al. 2001; AOPK CR 2011; Enviroportal 2011.
1In the table small protected areas located within large protected areas were not included in order to eliminate the double counting of one area (it pertained to approx. 1% of legally protected areas).
20.65% of the size of small-protected areas in the Czech Republic is in large protected areas.
31.73% of the size of small-protected areas in Slovakia (Nature Reserves, National Nature Reserves, Nature Monuments, and National Nature Monuments) is located in large protected areas (National Parks or Protected Landscape Areas).