
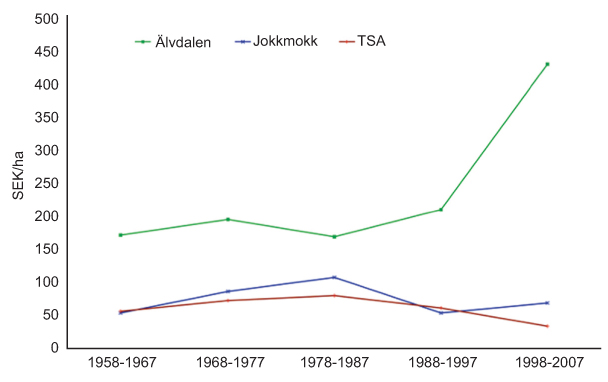
Figure 1
Average dividend per year per hectare in the Älvdalen, Jokkmokk and Tärna-Stensele (TSA) FCs during the five 10-year periods between 1958 and 2007, converted to 2006 prices. 1SEK= 0.15 USD.
Sources: Forest management reports and annual reports provided by each FC for the period 1958–2007, except Jokkmokk in the period 1958–1967, for which the source was Liljenäs (1977).
Box 1
Attributes of successful common property regimes (adapted from McKean 1998). These also generally correspond to the “design principles” for long surviving commons (Ostrom 1990)

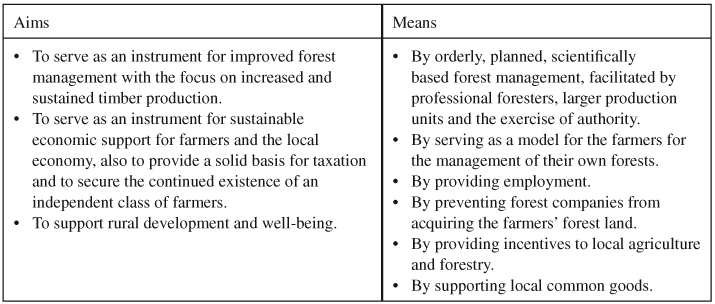
Table 1
Proportion of shareholders stating participation and use of their Forest Common (%). The percentage figures are rounded to the nearest integer
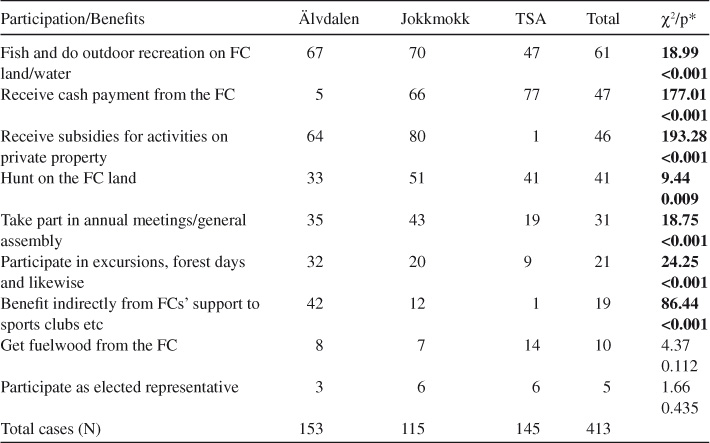
*Pearson χ2(2)/Bonferroni adjusted p-values; significant difference at p<0.05 in bold.
Table 2
Perceived benefits from the FCs by individual shareholders. The figures represent the proportion (%) of affirmative response to specific benefits by the respondents (local shareholders). The table only includes perceived benefits with 20% or higher total response. The percentage figures are rounded to the nearest integer
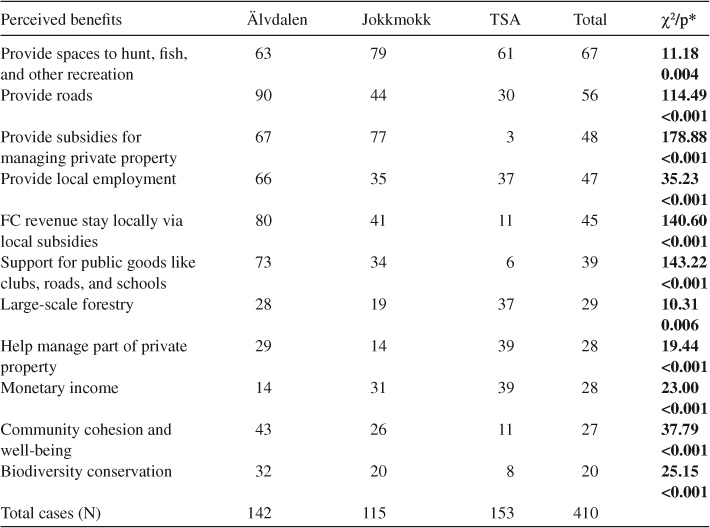
*Pearson χ2(2)/Bonferroni adjusted p-values; significant difference at p<0.05 in bold.
Table 3
The perceived contribution of the FC to local community by the shareholders. The figures represent the proportion (%) of affirmative response to specific benefits by the respondents (local shareholders). The table only includes perceived benefits with 20% or higher total response. The percentage figures are rounded to the nearest integer
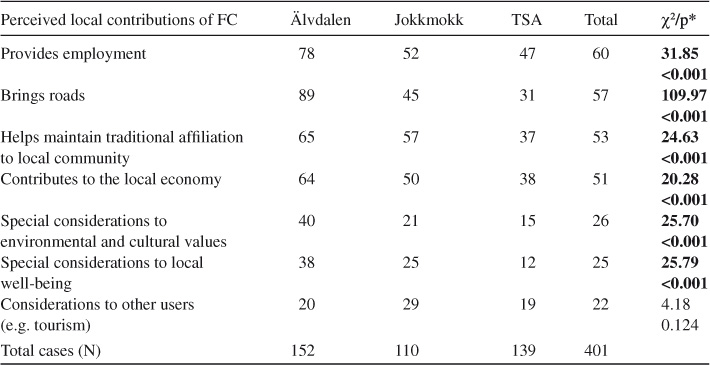
*Pearson χ2(2)/Bonferroni adjusted p-values; significant difference at p<0.05 in bold.
Table 4
Local shareholders’ opinions about their FC in Älvdalen, Jokkmokk and Tärna-Stensele (TSA). Responses to the statements are: A=Totally agree; B=Partly agree; C=Do not agree; and D=Have no opinion. Figures across each response indicate the proportion (%) of respondents choosing that response, rounded to the nearest integer. ‘Cases’ shows the total number of respondents (N)
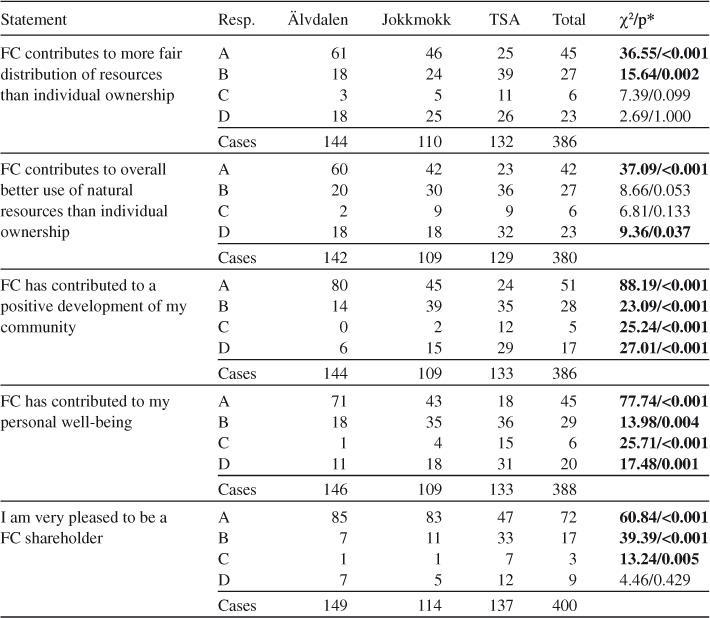
*Pearson χ2(2)/Bonferroni adjusted p-values; significant difference at p<0.05 in bold.