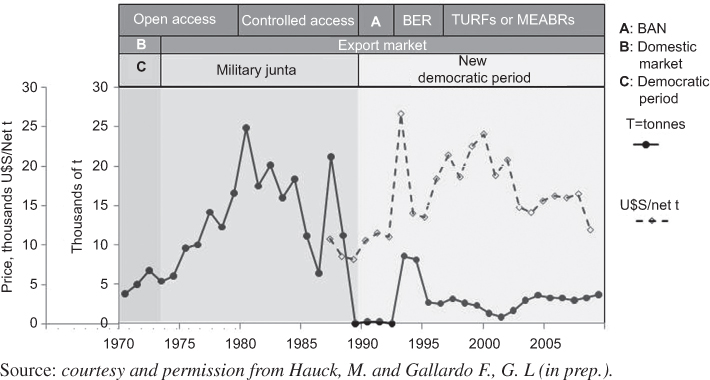
Figure 1
Loco landings, export prices and fisheries regimes (1970–2009).
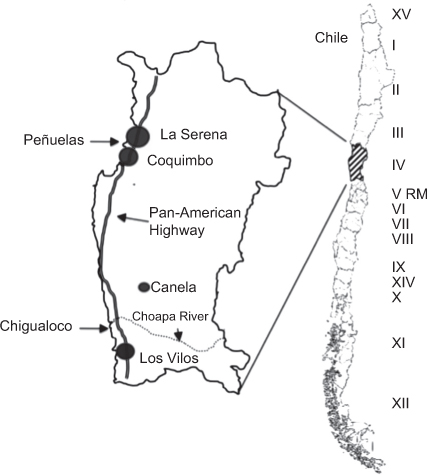
Figure 2
Location of the coquimbo region and the caleta study cases.
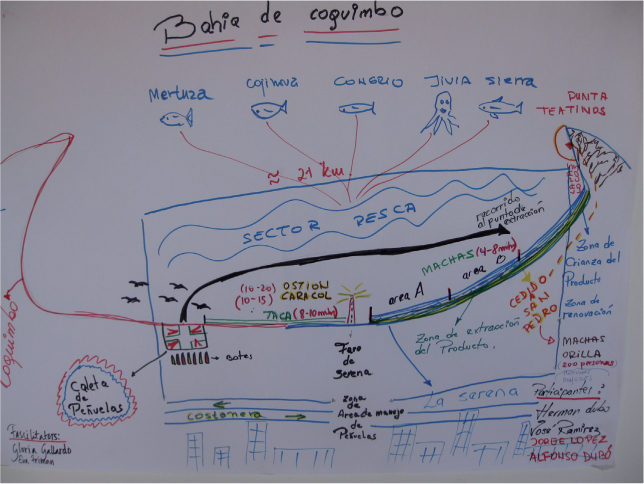
Figure 3
Caleta Map Peñuelas.
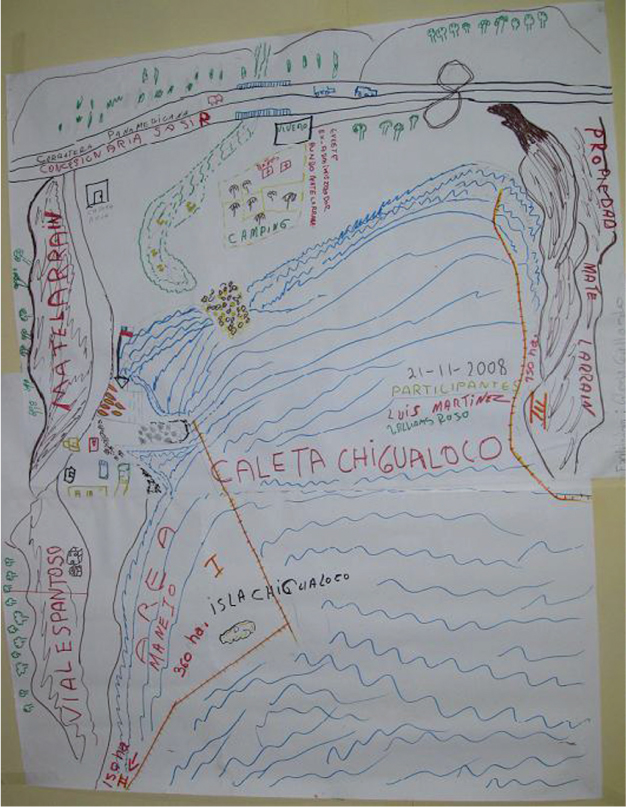
Figure 4
Caleta Map Chigualoco.

Loco landings, export prices and fisheries regimes (1970–2009).
Location of the coquimbo region and the caleta study cases.
Caleta Map Peñuelas.
Caleta Map Chigualoco.
© 2011 Gloria L. Gallardo Fernández, Eva Friman, published by Igitur Publishing
This work is licensed under the Creative Commons Attribution 4.0 License.


