
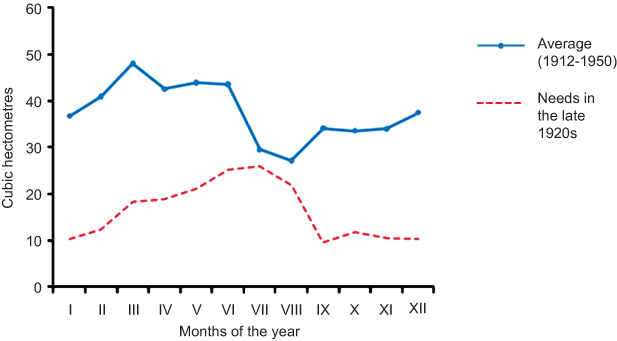
Figure 1
Water available and water needed on the huerta of Valencia.
Sources: http://hercules.cedex.es/anuarioaforos/afo/estaf-datos.asp?indroea=8022 (used to know the flow rate of the Turia) and Bellver (1933, 26–28).

Figure 2
Water available and water needed in August on the huerta of Valencia.
Sources: See Figure 1.

Figure 3
Water available and water needed on the huerta of Vila-real.
Sources: Garrido (2004, 163) provides information about what was cultivated on the huerta of Vila-real, and Ministerio de Fomento (1918, I, 413–415) offers data about the amount of water needed by each crop. Information about the flow rate of the river Mijares from 1915 onwards can be consulted at http://hercules.cedex.es/anuarioaforos/afo/estaf-datos.asp?indroea=8005 The Vila-real weir diverted 23.33% of the river’s discharge, and I have considered that 30% of that water was lost by evaporation and seepage.

Figure 4
Water available and water needed in August on the huerta of Vila-real.
Sources: See Figure 3.

Figure 5
Number of water rotations delivered in Alicante and the minimum number of rotations needed by some crops (1914–1969).
Source: For the number of rotations, Maass and Anderson (1978, 108–109). For the water needs, Ministerio de Fomento (1918, I, 443–445).

Figure 6
Water availability and maximum number of times it was possible to irrigate per year on 9700 hectares of the huerta of Lorca (1929–1947).
Source: http://hercules.cedex.es/anuarioaforos/afo/estaf-datos.asp?indroea=7033, Dirección General de Agricultura (1891, II, 452–453), and Ministerio de Fomento (1918, II, 471–474).