
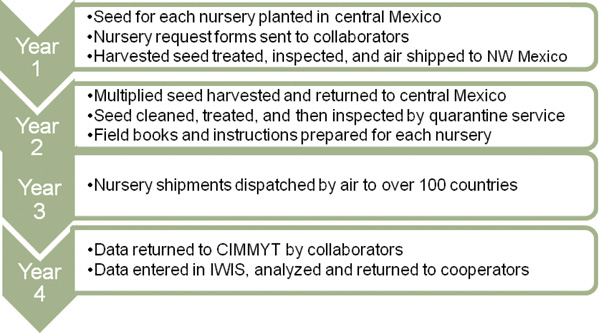
Figure 1
The Four-Year Cycle of the International Nurseries.
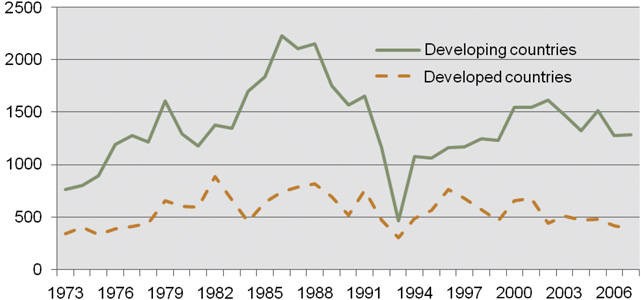
Figure 2
Annual Number of Wheat Nurseries Shipped, 1973–2007.
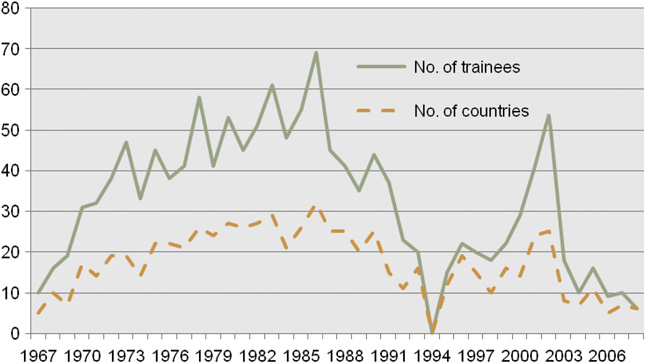
Figure 3
Annual Number of Wheat Trainees and Countries of Origin, 1967–2008.
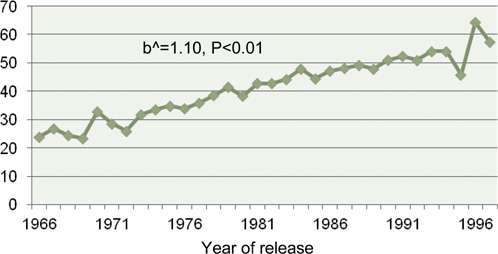
Figure 4
Average Number of Landrace Ancestors for Spring Bread Wheat Varieties in Developing Countries, 1965–1997 (Source: Smale et al. 2002).
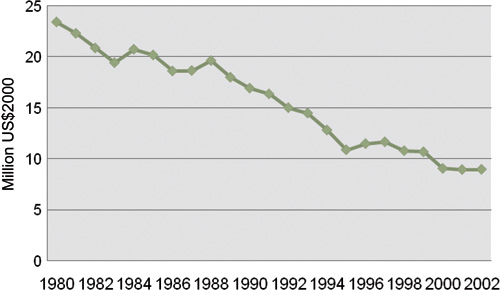
Figure 5
Trends in Real Budget of CIMMYT’s Wheat Program, 1980–2002.
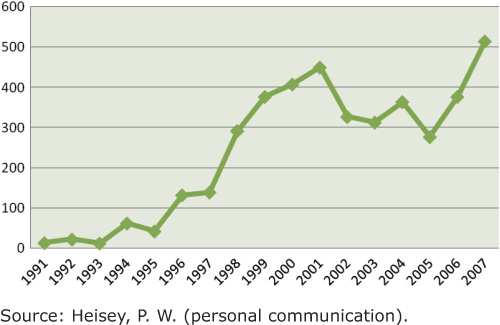
Figure 6
Number of patents issued annually on varieties and research tools and processes for major crops in the USA. Source: Heisey, P. W. (personal communication).
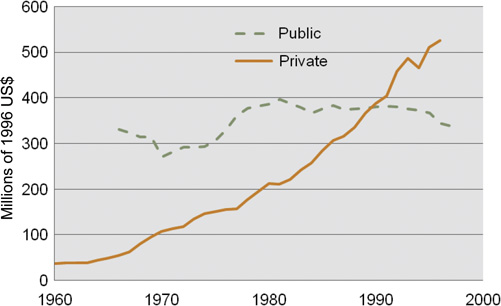
Figure 7
Real Public and Private Sector Expenditures on Plant Breeding, USA.
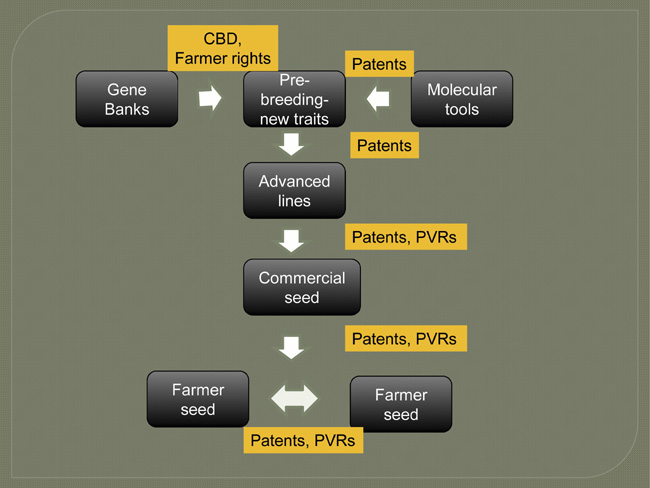
Figure 8
Impacts of ‘New Rules’ of the Game on Germplasm Flows.
Table 1
Evolution of international spring wheat nurseries, 1950s–2000s.
| Decade | Main focus | Main nurseries added |
| 1950s (USDA) | Rusts | International Stem Rust Trial for North and South America |
| 1960s Pre-CIMMYT and early CIMMYT | Provide best available wheat germplasm to cooperating programs with broad adaptation, high yield potential, and multiple disease resistance and test these qualities over time and space | First International Spring Wheat Yield Trial; Int Durum Yield Trial; Int Bread Wheat Screening Nursery; Int Triticale Yield Trial; Int Triticale Screening Nursery |
| 1970s CIMMYT era | Provide high yielding, broadly adapted, daylength insensitive, multiple disease resistant germplasm. Start of spring by winter wheat breeding program. Specialty nurseries particularly for disease resistance | Crossing blocks; F2’s irrigated and dryland; International Septoria Screening Nursery; Elite Spring Wheat Yield Trial; Regional Disease Trap Nursery |
| 1980s | As before but with additional adaptation for diverse environments, designated as mega-environments. Large program on wheat for non-traditional, warmer climates | Semi-Arid Wheat Screening Nursery; Acid Soils Wheat Screening Nursery; High Rainfall Wheat Screening Nursery; International Disease Trap Nursery; Karnal Bunt Screening Nursery |
| 1990s | As before with additional stratification of environments including higher latitudes with daylength sensitive wheat for eastern Europe and central Asia | High Rainfall Wheat Yield Trial; High Temp Wheat Yield Trial; Semi-Arid Wheat Yield Trial; Warmer Area Wheat Screening Nursery. High Latitude Wheat Screening Nursery |
| 2000s | Additional specialty nurseries for diseases and other traits | Scab Resistance Screening Nursery International; South Asia Micronutrient Yield Trial; International Adaptation Trial; Global Adaptation Wheat Yield Trial. Other special ones such as Stem Rust Screening Nursery |
Table 2
Number of visiting scientists to CIMMYT by region, 1966–2000 (Source: Villareal, 2001).
| Origin | Number |
| Sub-Saharan Africa | 133 |
| West and North Africa | 177 |
| East, South and Southeast Asia | 451 |
| Latin America | 499 |
| Eastern Europe, Central Asia, Caucasus | 60 |
| High-income countries | 546 |
| Total | 1866 |
Table 3
Origin of Spring Bread Wheat Varieties Released in Developing Countries, 1966–1997 (Source: Heisey et al. 2003).
| CIMMYT cross | CIMMYT parent | CIMMYT ancestor | Other origin | ||
| 1966–1970 | 37.7 | 20.4 | 6 | 35.9 | 100 |
| 1971–1975 | 48.2 | 23.9 | 6.2 | 21.7 | 100 |
| 1976–1980 | 40.9 | 38.5 | 6.1 | 14.5 | 100 |
| 1981–1985 | 45.8 | 32.0 | 9.1 | 13.1 | 100 |
| 1986–1990 | 52.3 | 28.6 | 10.1 | 9.0 | 100 |
| 1991–1997 | 52.7 | 29.2 | 8.3 | 9.8 | 100 |
Table 4
Percent origin of land race ancestors of bread wheat varieties grown in the developing world in 1990. (Based on Smale and McBride 1996.)
| Origin of base land races (%) | SS Africa | N. Africa | W. Asia | South Asia | Mexico and CA | Southern Cone |
| SS Africa | 12 | 9 | 7 | 9 | 10 | 7 |
| N. Africa | 2 | 4 | 2 | 3 | 2 | 1 |
| W. Asia | 2 | 1 | 7 | 2 | 1 | 1 |
| S. Asia | 10 | 8 | 7 | 21 | 6 | 6 |
| Mexico and CA | 4 | 3 | 7 | 6 | 9 | 5 |
| Southern Cone | 14 | 16 | 8 | 11 | 17 | 32 |
| Transitional | 15 | 21 | 16 | 18 | 21 | 14 |
| High-income | 27 | 27 | 33 | 20 | 17 | 27 |
| Other-unknown | 14 | 11 | 13 | 10 | 5 | 7 |
| Total | 100 | 100 | 100 | 100 | 100 | 100 |
Table 5
Trends in yield potential of spring bread wheats by environment, 1979–1999. (Source: Lantican et al. 2001).
| Irrigated | High rainfall | Dry | Hot | |
| Growth rate (%/year) | 0.82 | 1.16 | 3.48 | 2.10 |
| Growth (kg/year) | 53.5 | 62.5 | 87.7 | 46.1 |
Table 6
Summary of estimates of economic benefits to international wheat breeding research.
| Study | Period covered | All breeding | Attributed to CIMMYT-national network |
| Byerlee and Traxler (1996) | 1966–1990 | $3.0 billion per year Internal rate of return of 53% | $1.5 billion per year |
| Heisey et al. (2002) mid-range estimate | 1996–1997 | $2.4 billion per year | $1.1 billion per year |
| Lantican et al. (2005) – mid-range estimate | 1988–2002 | $3.4–4.8 billion per year | $1.0–1.8 billion per year |
| Marasas et al. (2004) – leaf rust resistance only | 1973–2007 | $5.4 billion net present value | |
| Evenson and Rosegrant (2002) | 1965–2000 | With no breeding research: • 9–14% reduction in output • 29–61% increase in price | With no CGIAR • 5–6% reduction in output • 19–22% increase in price |