
Table 1
Representativeness of the cinema set.
| City | Number of cinemas | Number of cinemas with programming info | Number of cinemas seating capacity known |
|---|---|---|---|
| Antwerp | 46 | 31 (67%) | 46 (100%) |
| Gothenburg | 40 | 30 (76%) | 40 (100%) |
| Rotterdam | 13 | 13 (100%) | 13 (100%) |
Table 2
Comparative statistics cinemas in the three cities in 1952.
| City | Population | Total number of cinemas | Cinemas in analysis (nodes) | Total seating capacity | Average seating capacity | Median seating capacity | Inhabitants per seat |
|---|---|---|---|---|---|---|---|
| Antwerp | 526,440 (1950) | 46 | 31 | 40,124 | 872 | 800 | 13 |
| Gothenburg | 353,580 (1950) | 40 | 30 | 17,640 | 441 | 412 | 20 |
| Rotterdam | 765,87943 (1952) | 13 | 13 | 10,104 | 777 | 743 | 76 |
Table 3
Comparative statistics of film screenings in the three cities in 1952.
| absolute | as % of number of unique films | absolute | as % of unique films | mean | std | |||
|---|---|---|---|---|---|---|---|---|
| Antwerp | 785 | 10,395 | 187 | 24% | 17 | 2% | 8 | 11 |
| Gothenburg | 800 | 21,355 | 268 | 34% | 108 | 14% | 15 | 56 |
| Rotterdam | 444 | 4,568 | 48 | 11% | 24 | 5% | 7 | 12 |
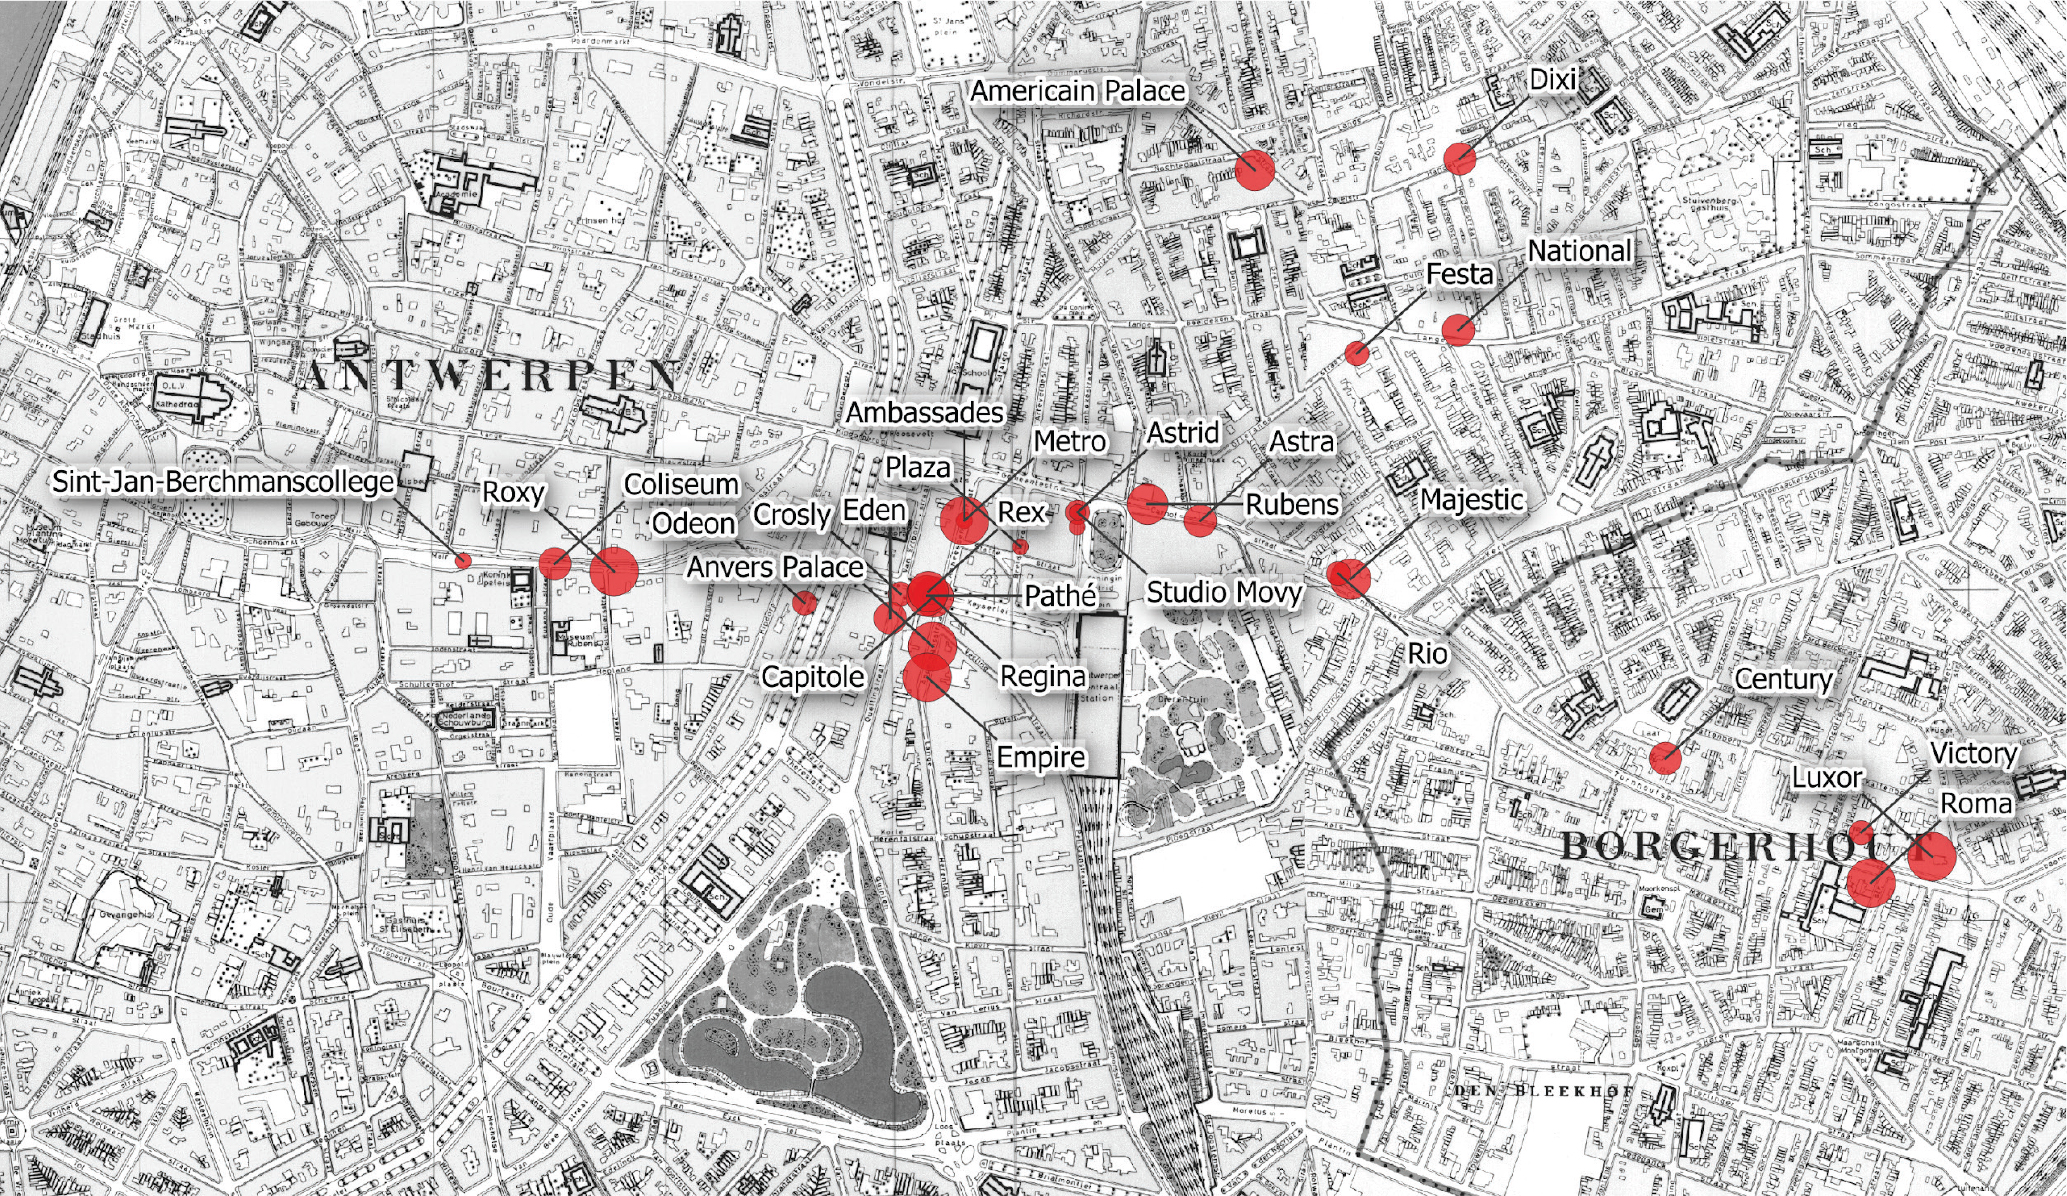
Figure 1
Map of Antwerp, showing the location of the cinemas included in the programming analysis. The size of the dots refers to the relative size of the cinema as measured by its seating capacity. Map: FelixArchief/stadsarchief Antwerpen, 1963: Ministerie van Openbare Werken (1:5000), inventory nr. BE SA 312291.
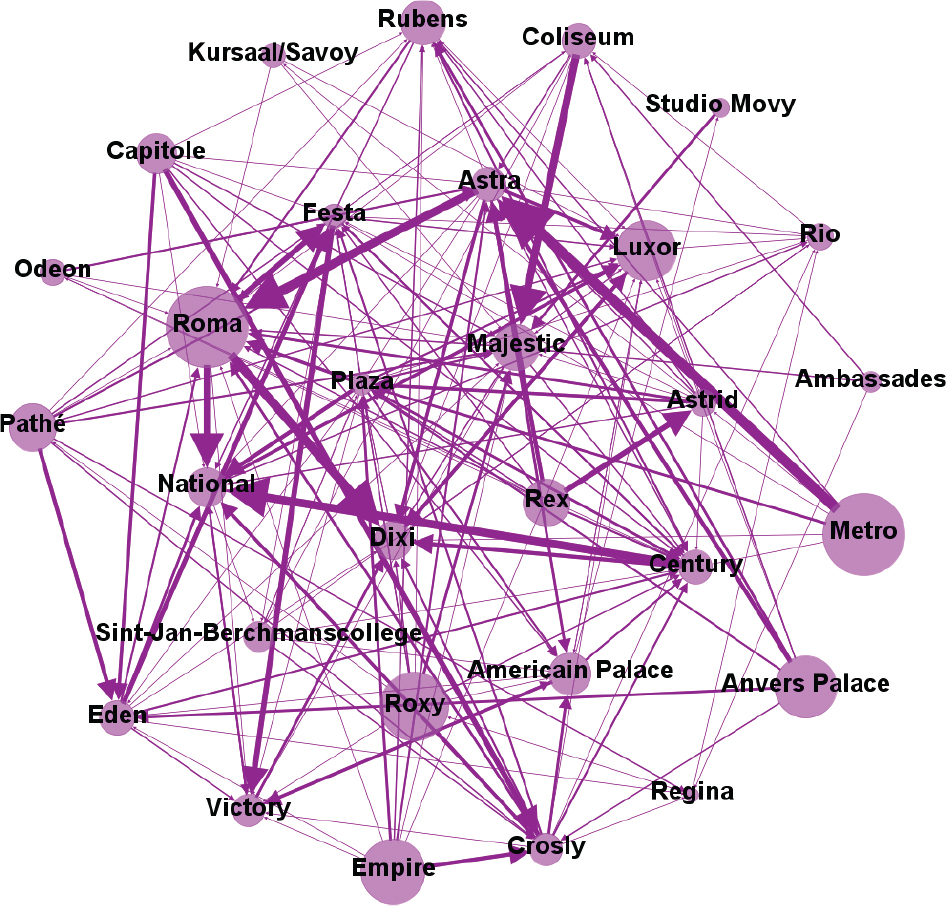
Figure 2
Flow of films for the Antwerp dataset, edge weight 1.
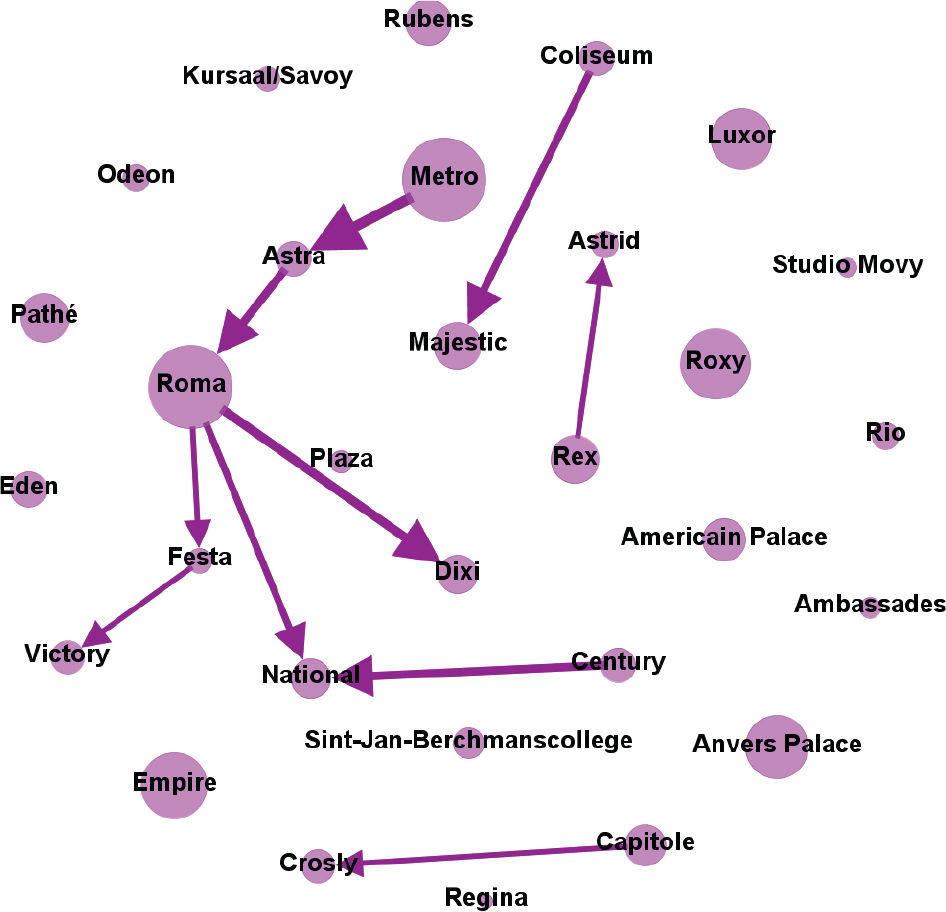
Figure 3
Flow of films for the Antwerp dataset, edge weight 8.
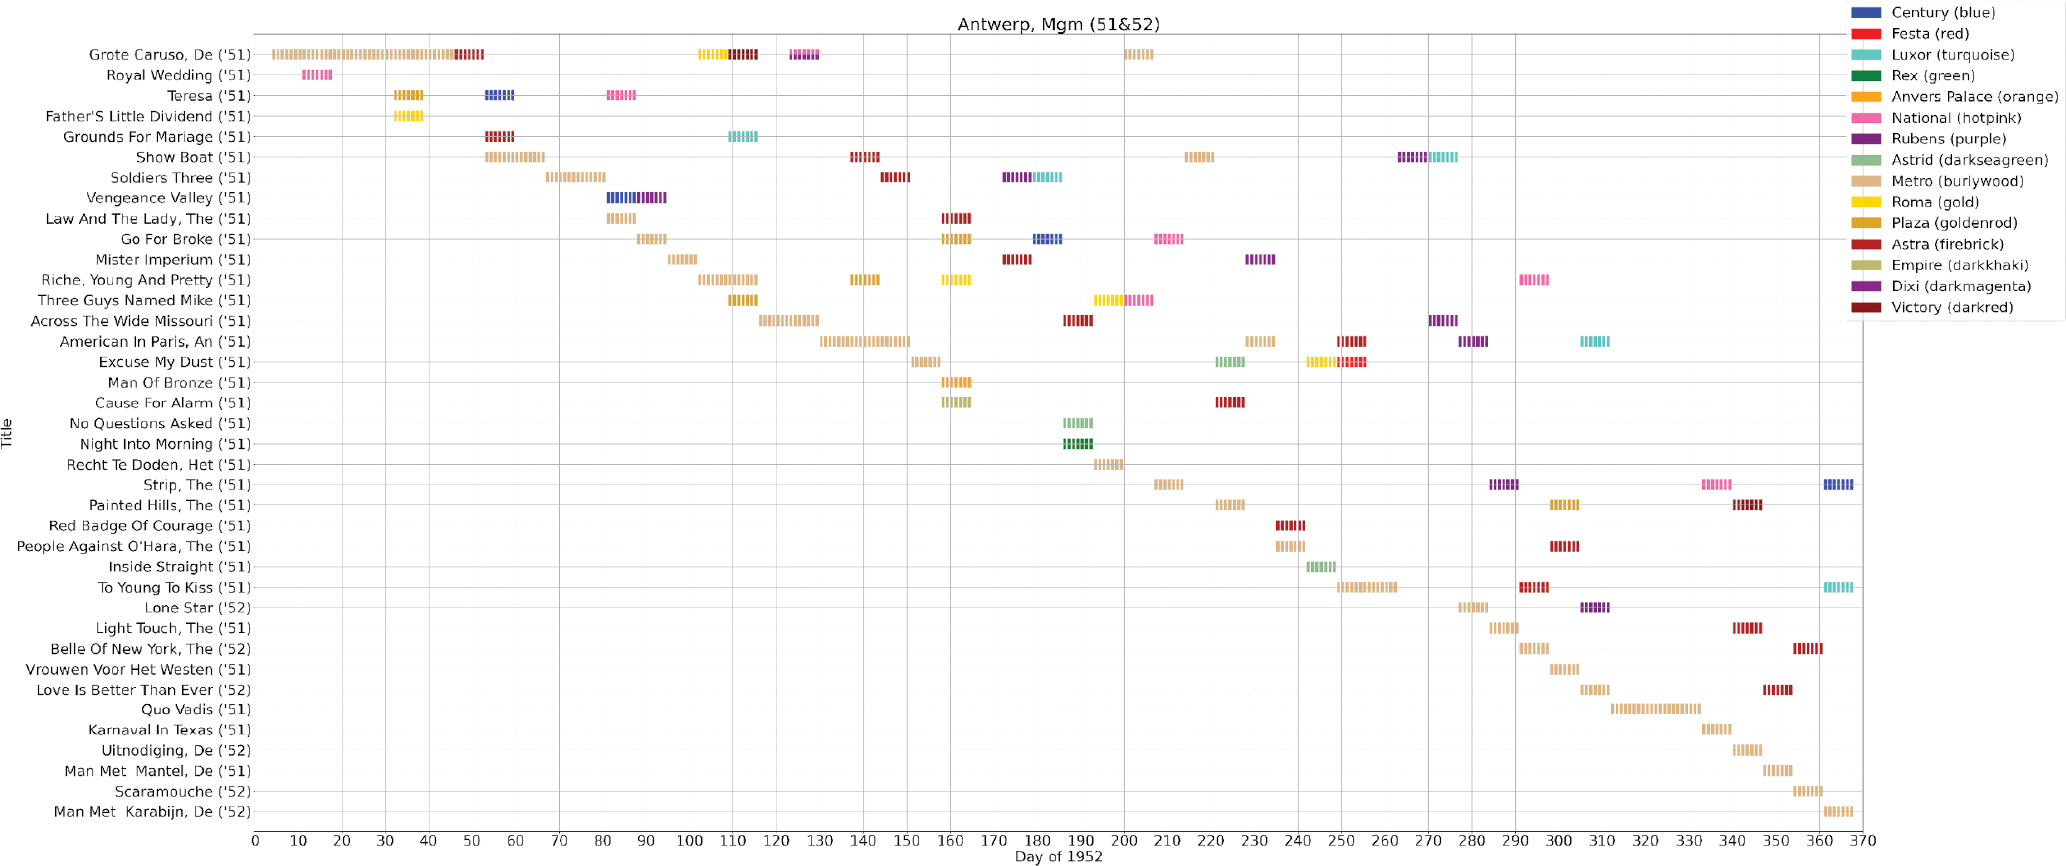
Figure 4
Time plot visualisation for all films produced by MGM in 1951 and 1952 that screened in Antwerp cinemas in 1952. The X-axis represents the number of days that a film screened, starting with the first day in 1952 that a screening was documented for cinemas in Antwerp.
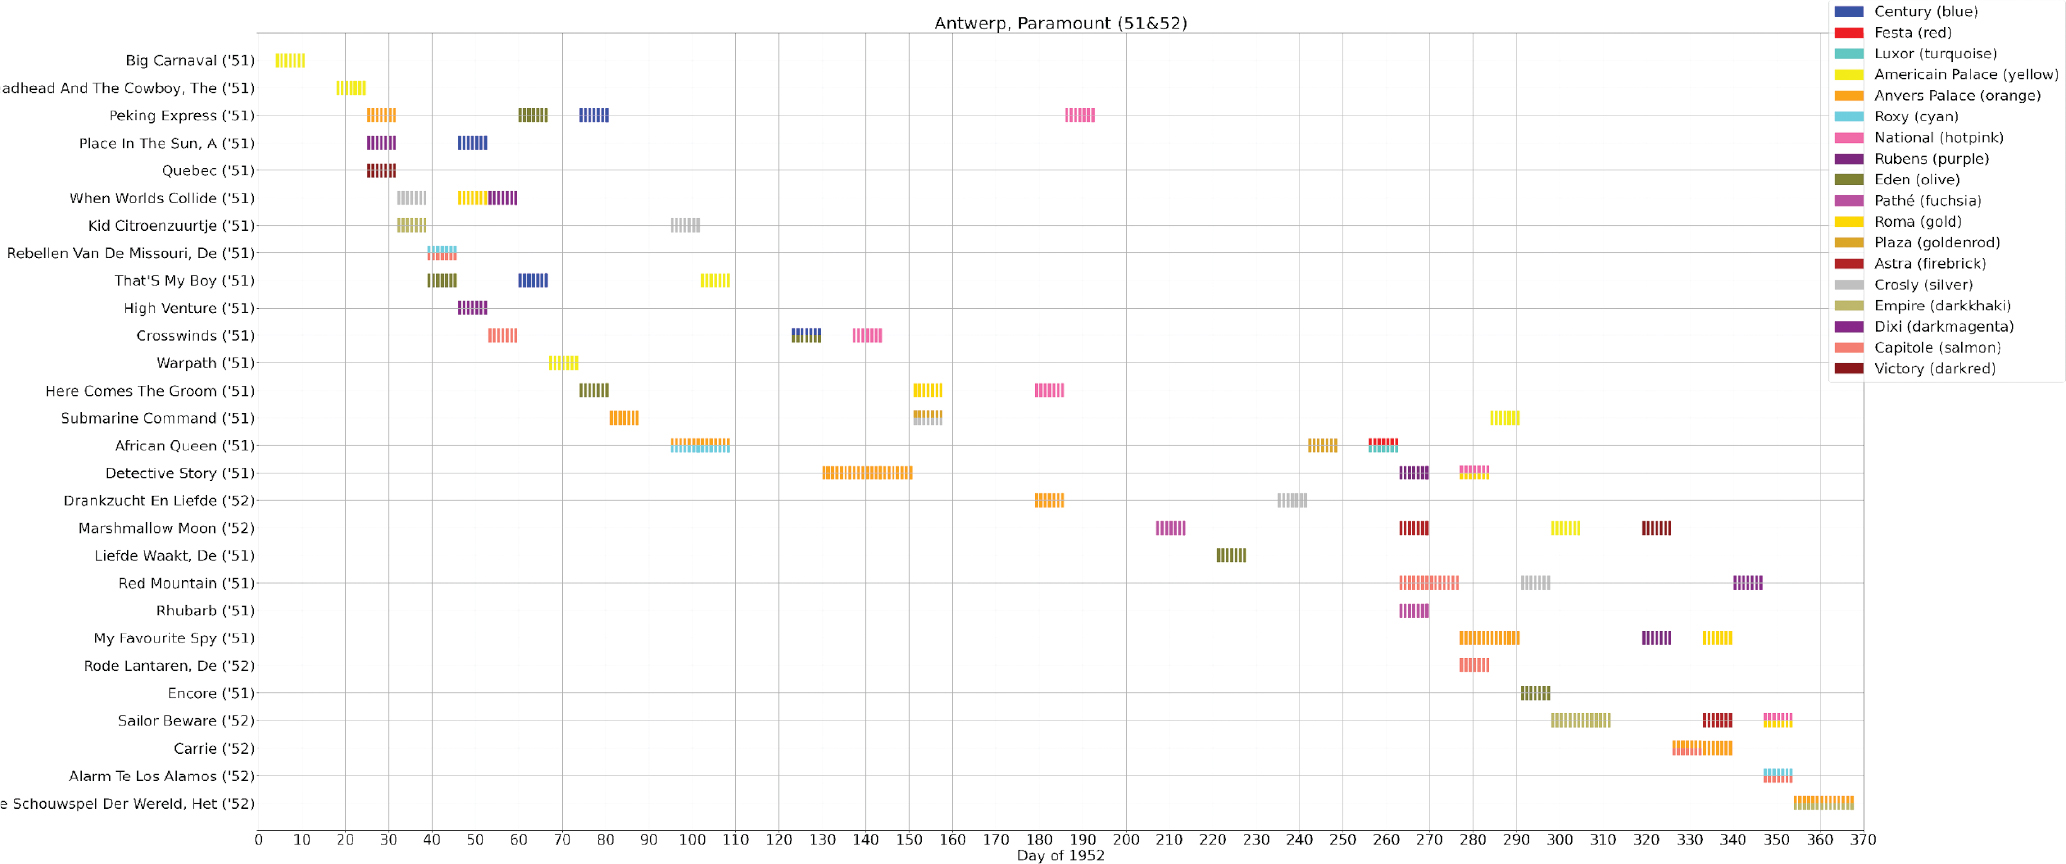
Figure 5
Time plot visualisation for all films produced by Paramount in 1951 and 1952 that screened in Antwerp cinemas in 1952.
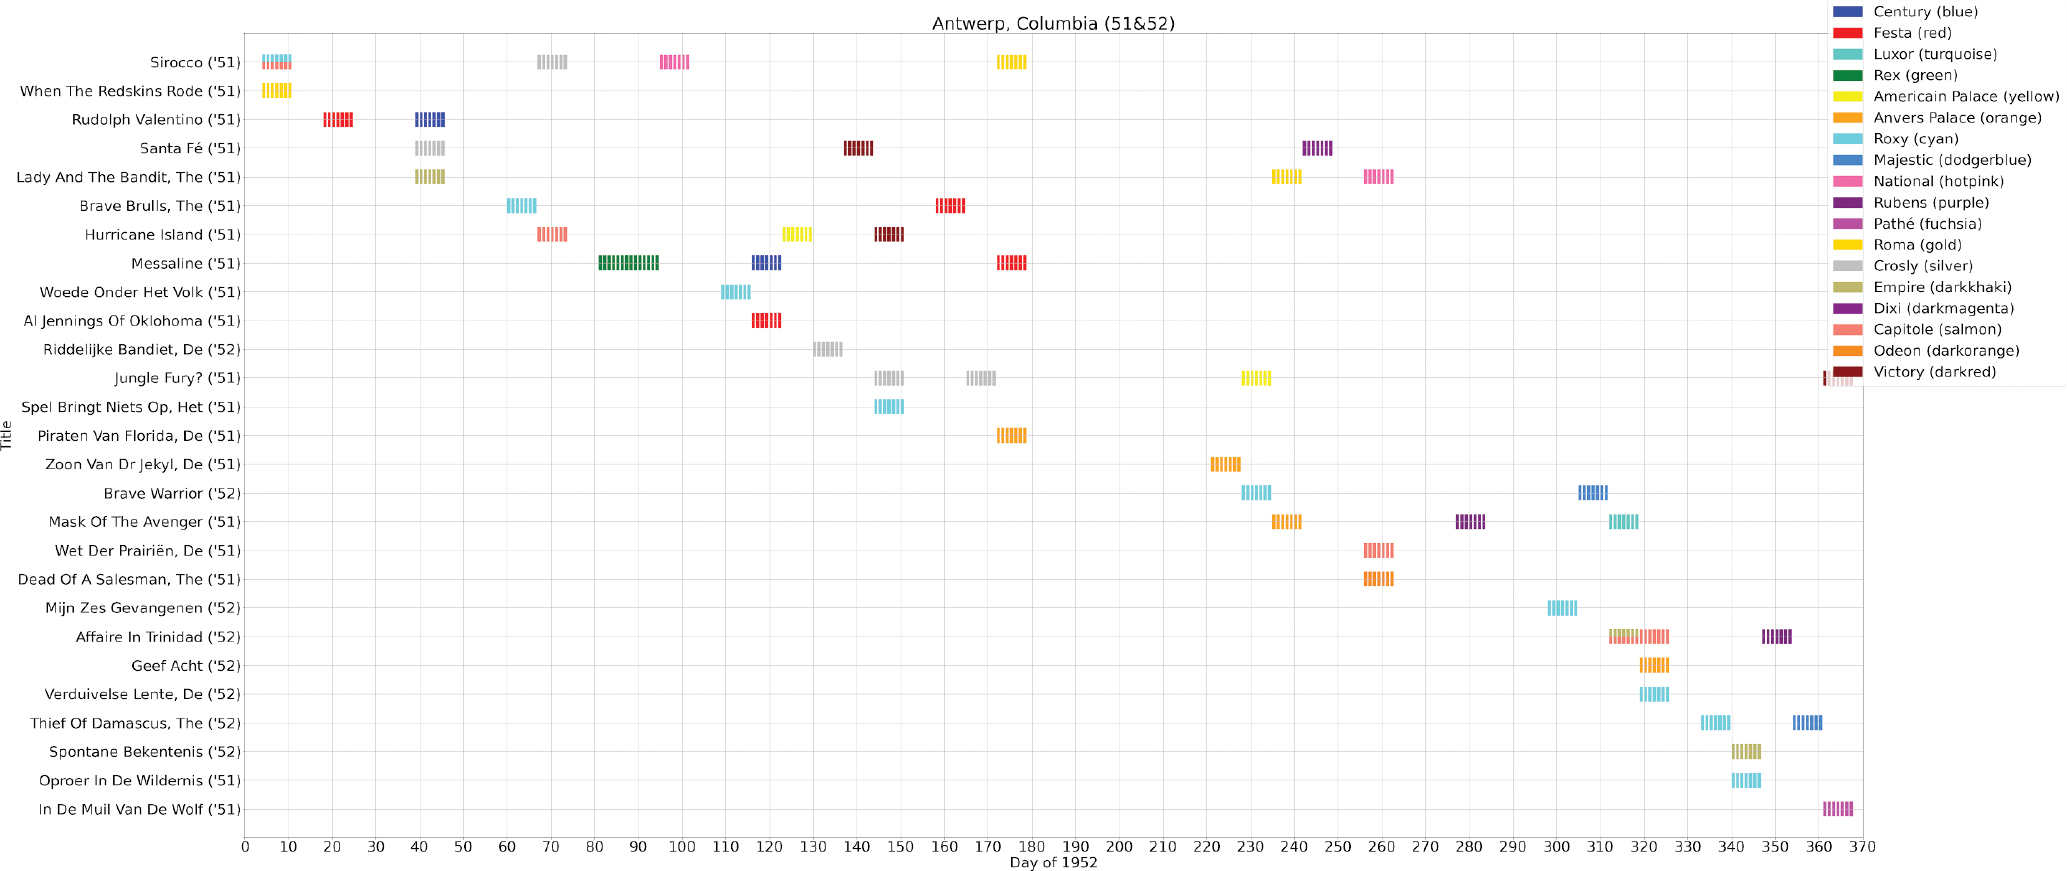
Figure 6
Time plot visualisation for all films produced by Columbia in 1951 and 1952 that screened in Antwerp cinemas in 1952.
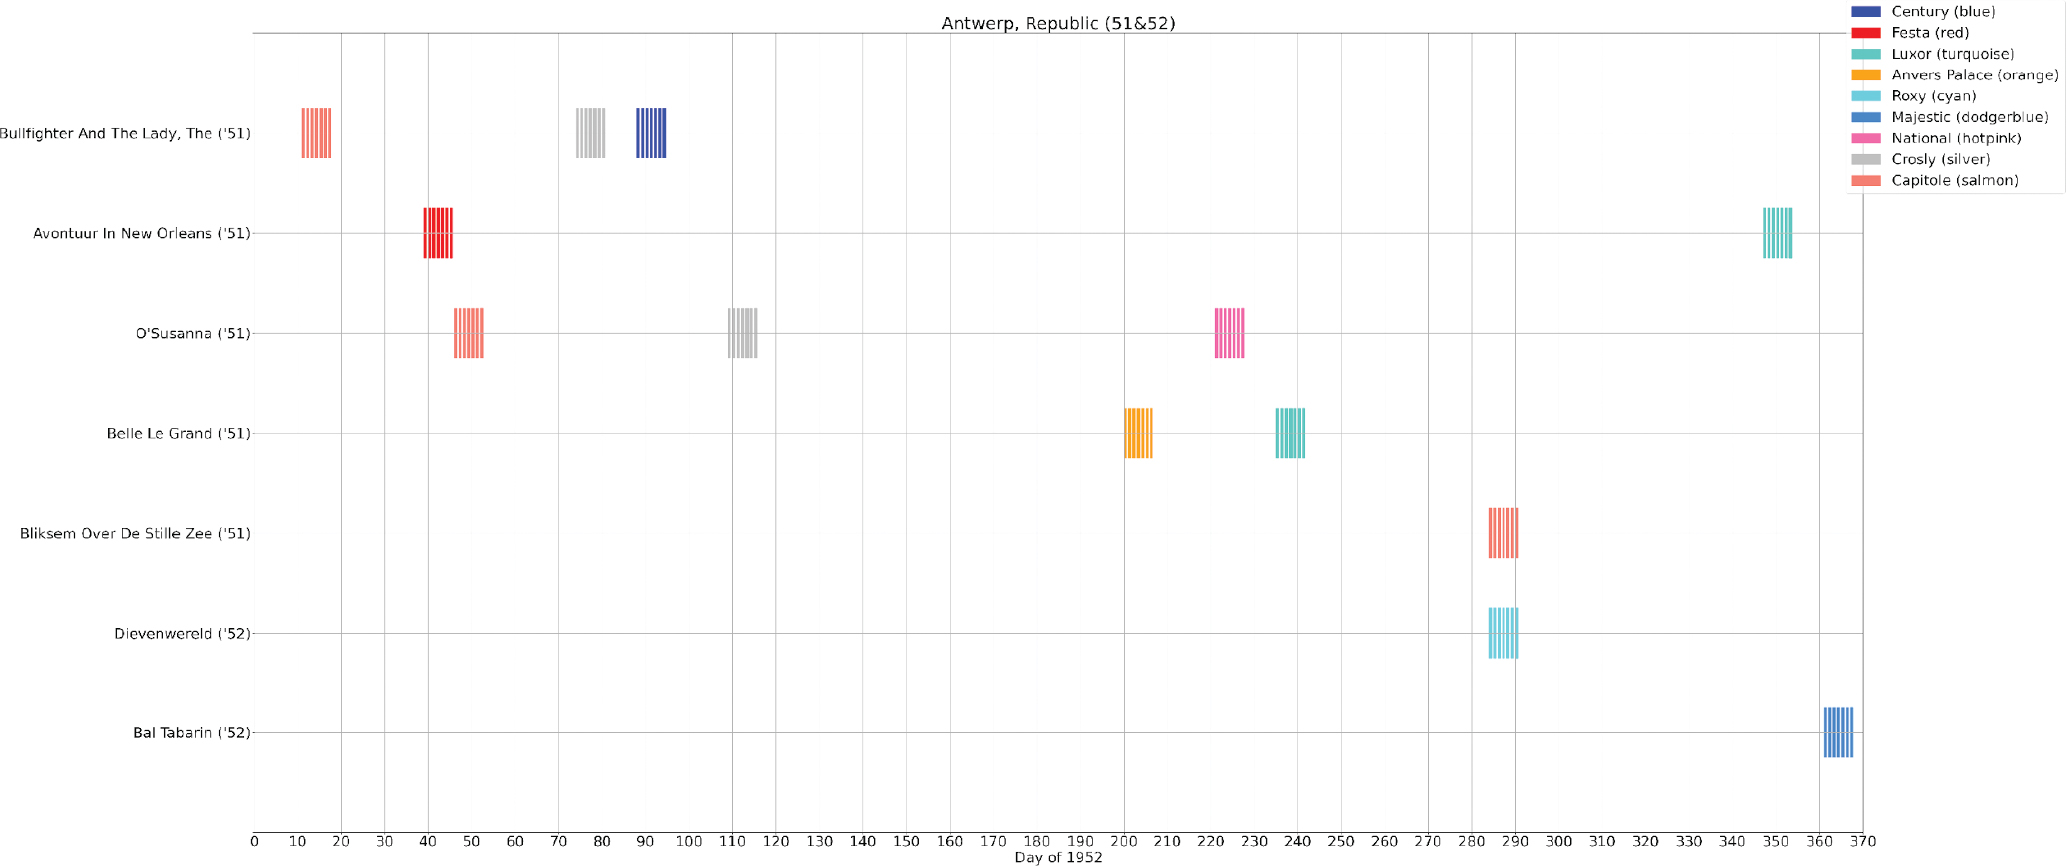
Figure 7
Time plot visualisation for all films produced by Republic in 1951 and 1952 that screened in Antwerp cinemas in 1952.
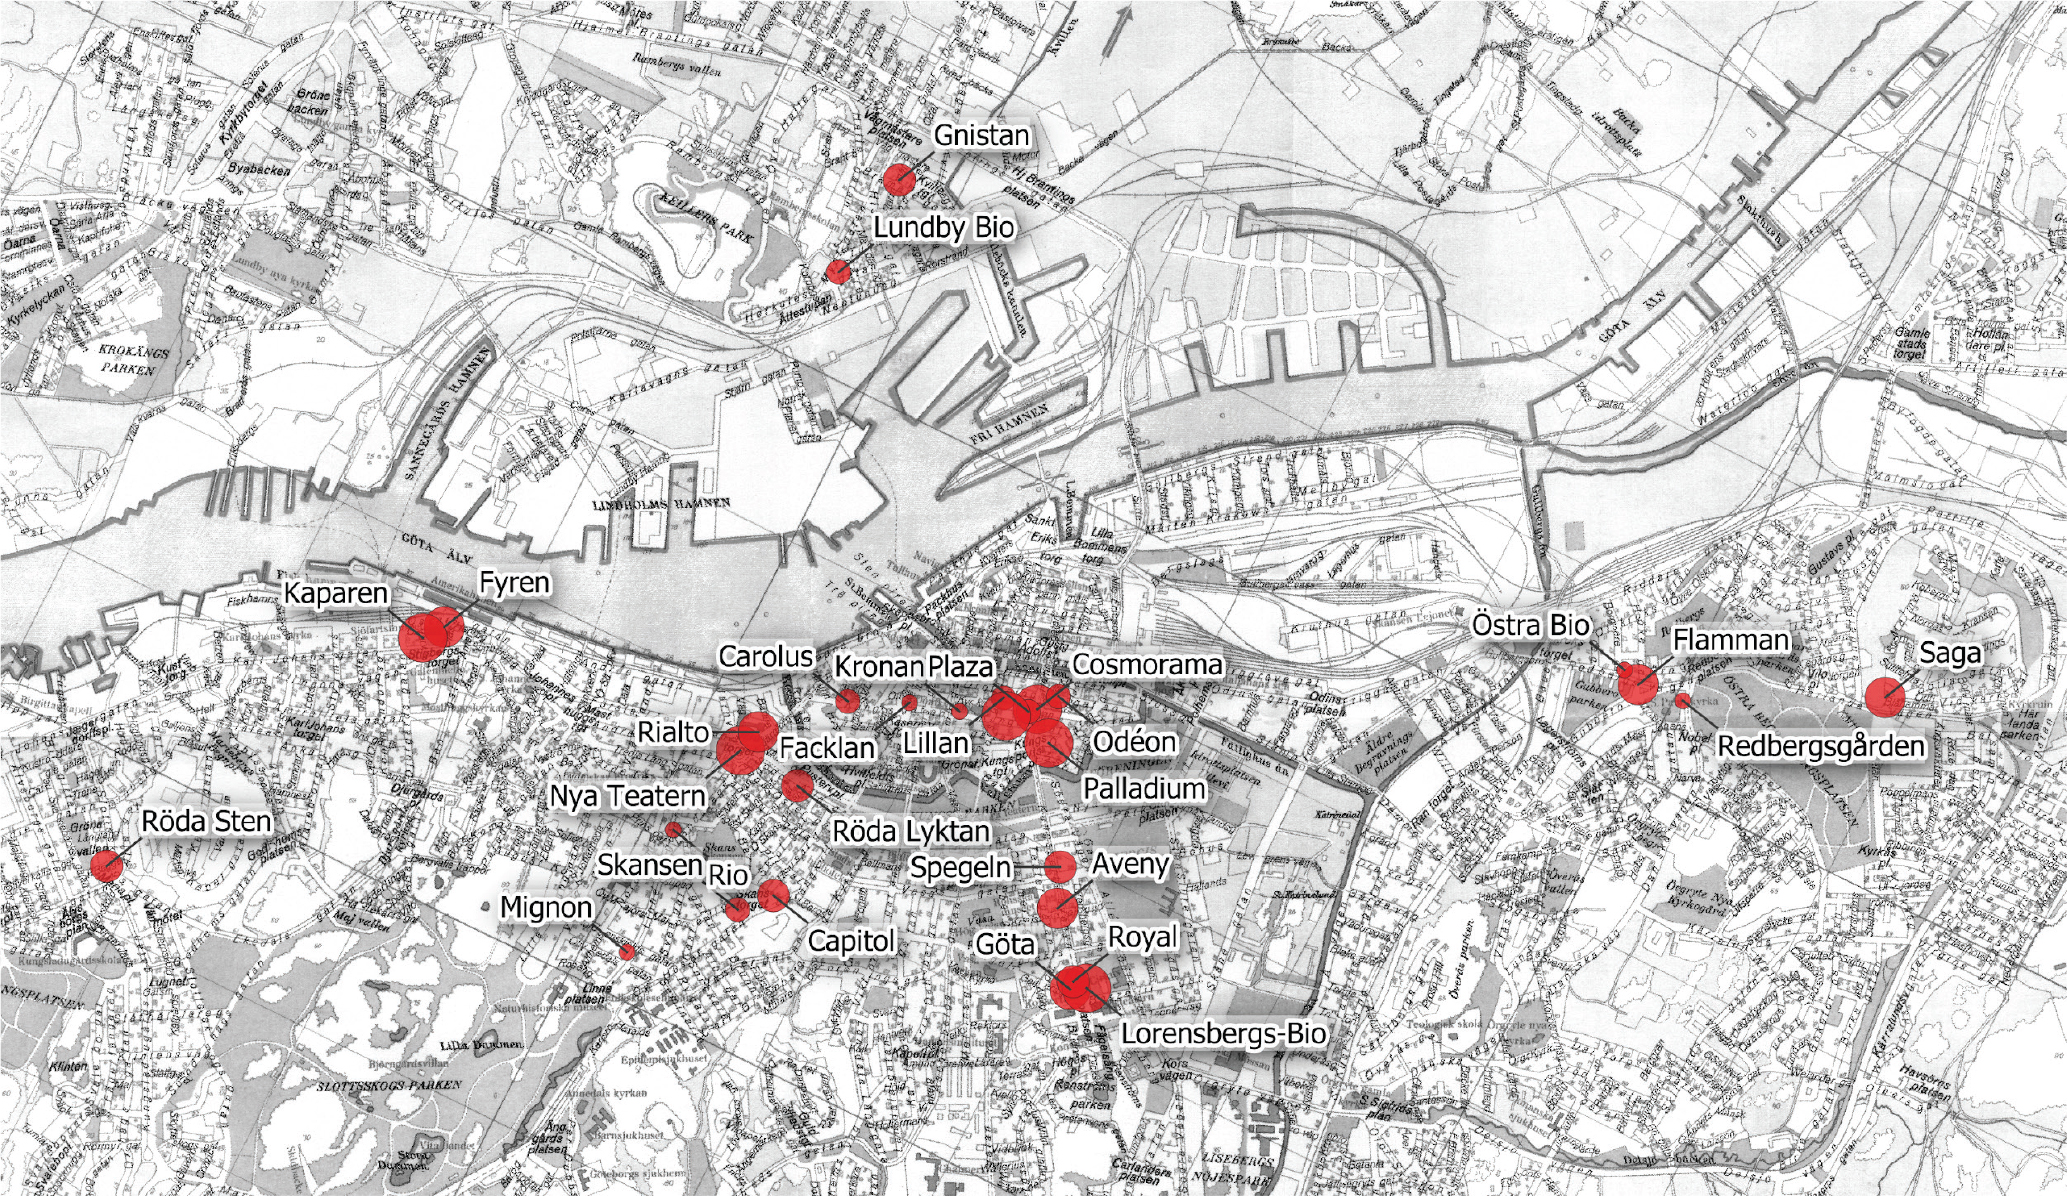
Figure 8
Map of Gothenburg, showing the location of the cinemas included in the programming analysis. The size of the dots refers to the relative size of the cinema as measured by its seating capacity. The map is based on a Gothenburg tourist map from 1951, produced by the City Planning Authority of Gothenburg.
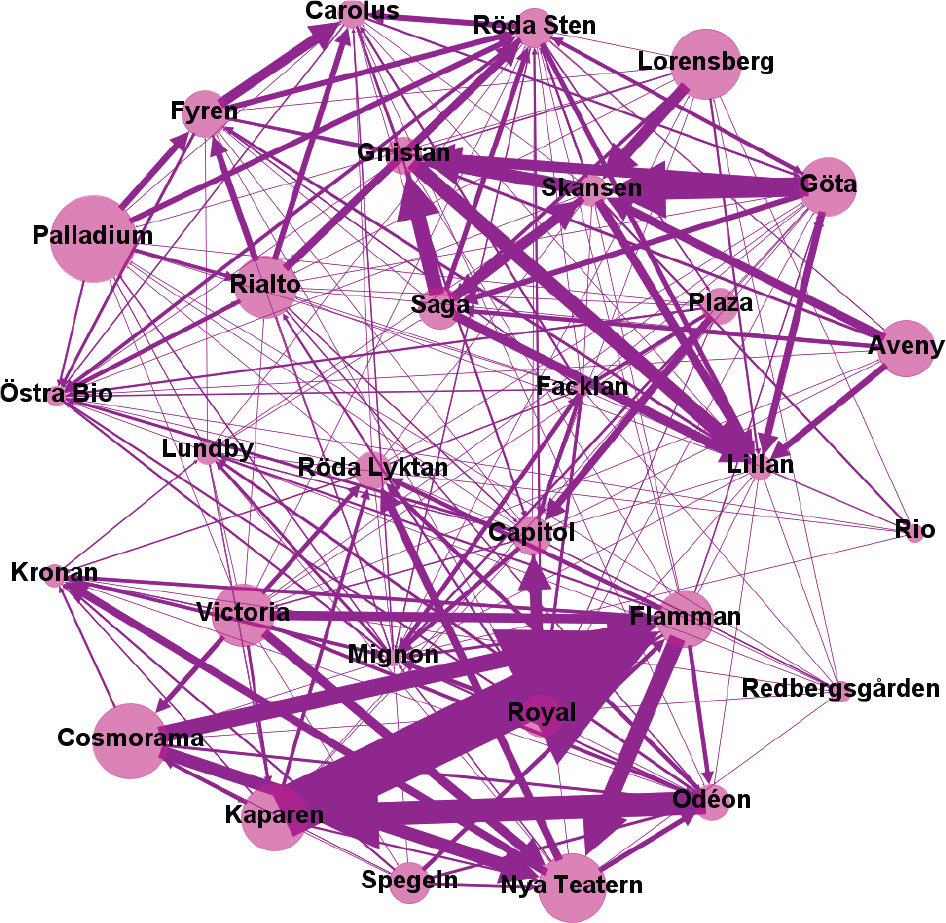
Figure 9
Flow of films for the Gothenburg dataset, edge weight 1.
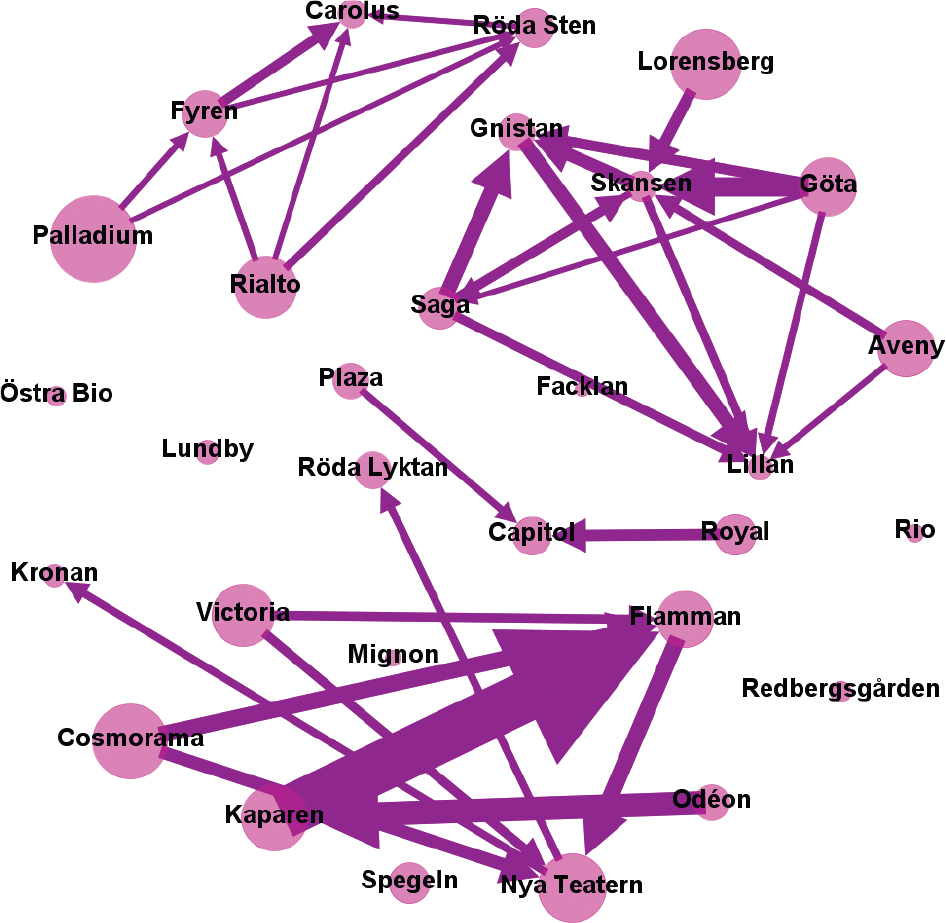
Figure 10
Flow of films for the Gothenburg dataset, edge weight 8.
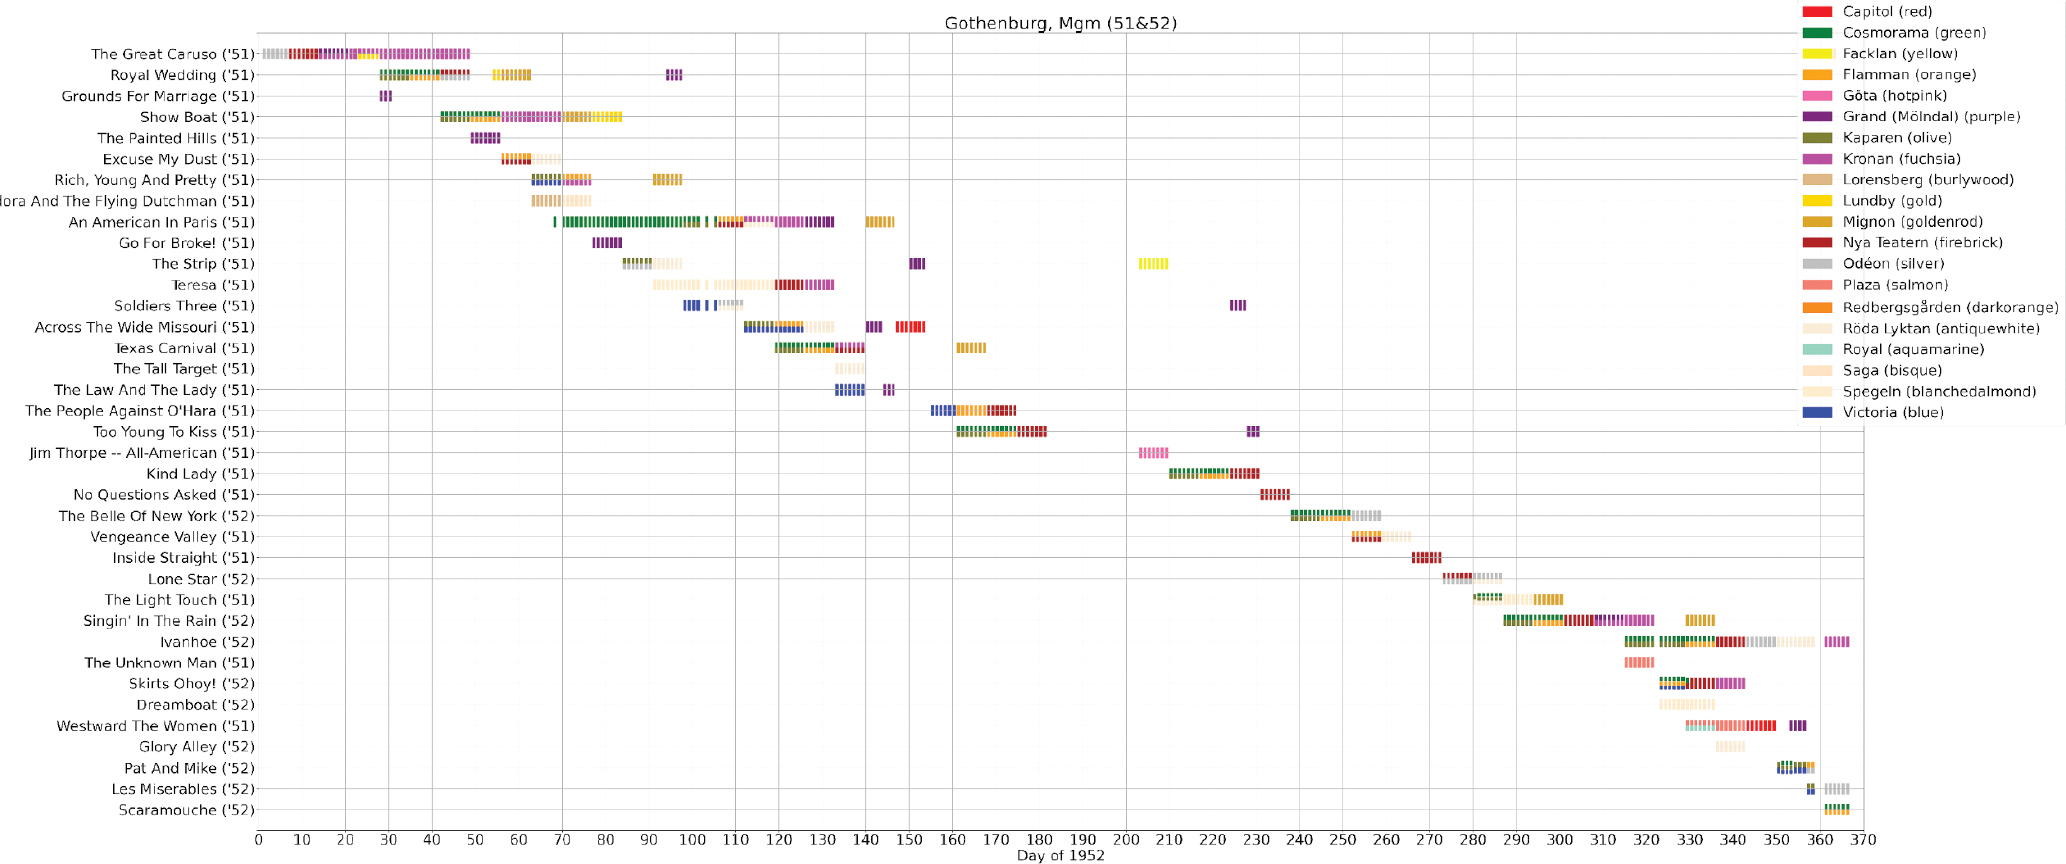
Figure 11
Time plot visualisation for all films produced by MGM in 1951 and 1952 that screened in Gothenburg cinemas in 1952. The X-axis represents the number of days that a film screened, starting with the first day in 1952 that a screening was documented for cinemas in Gothenburg.
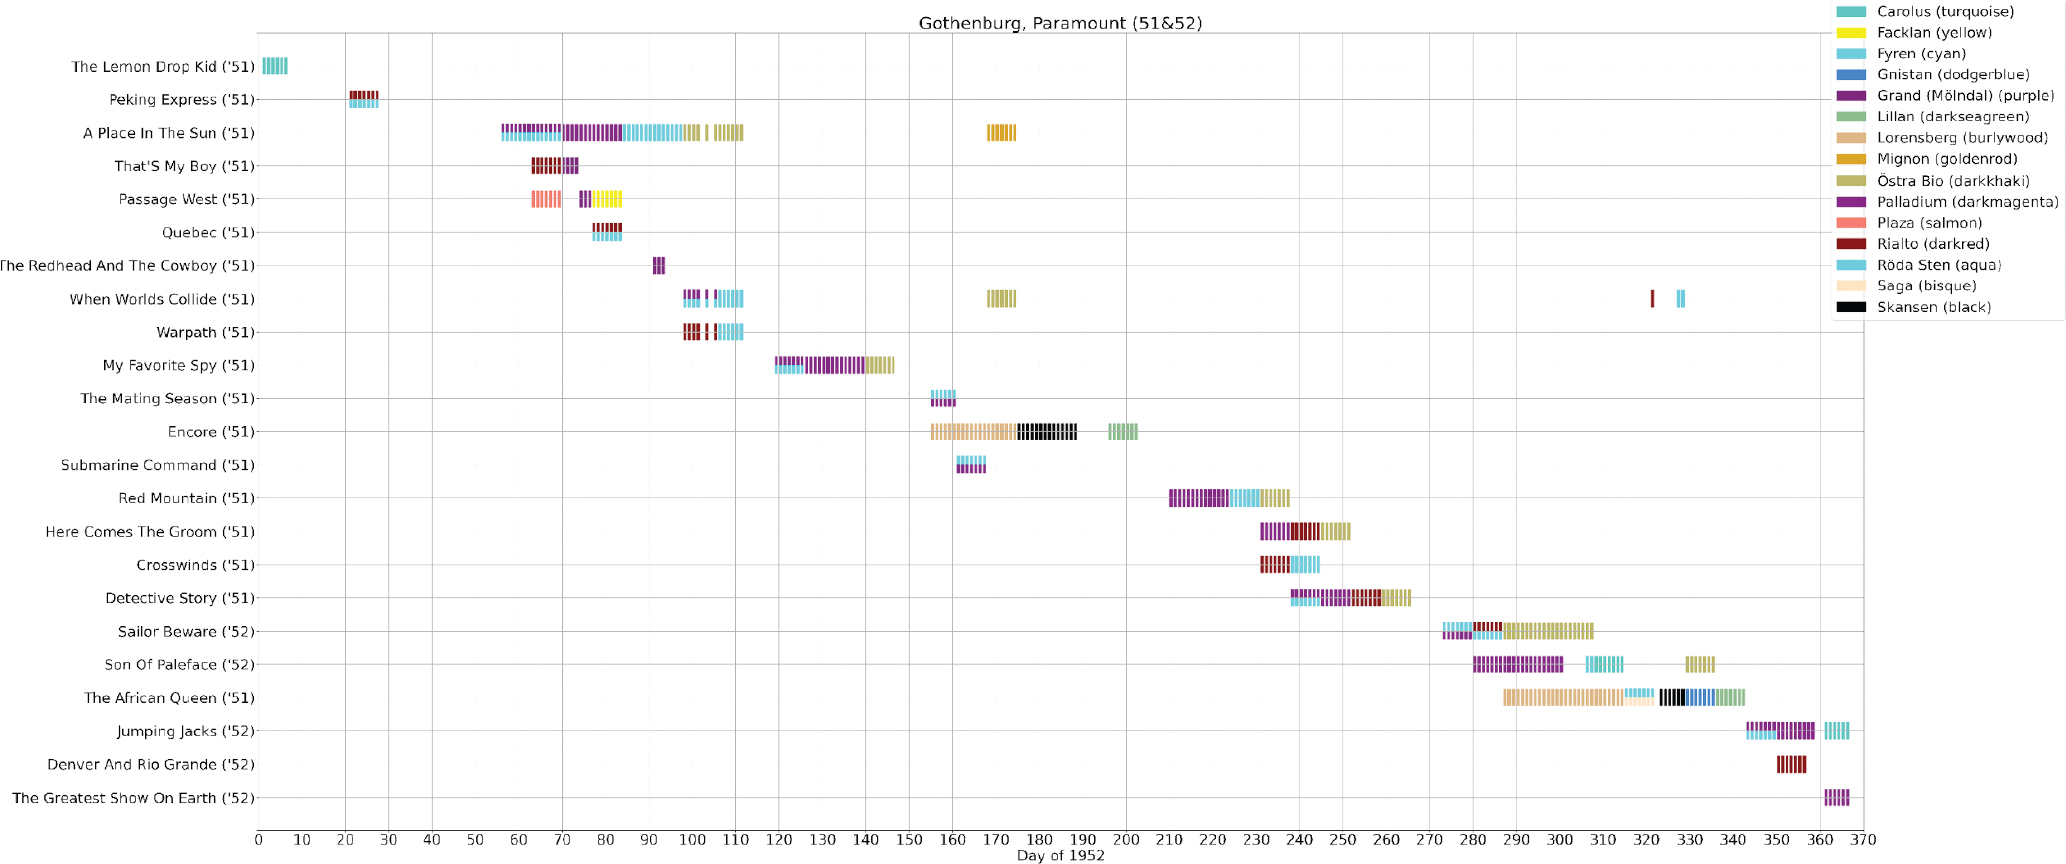
Figure 12
Films produced in 1951 and 1952 by Paramount, exhibited in Gothenburg in 1952.
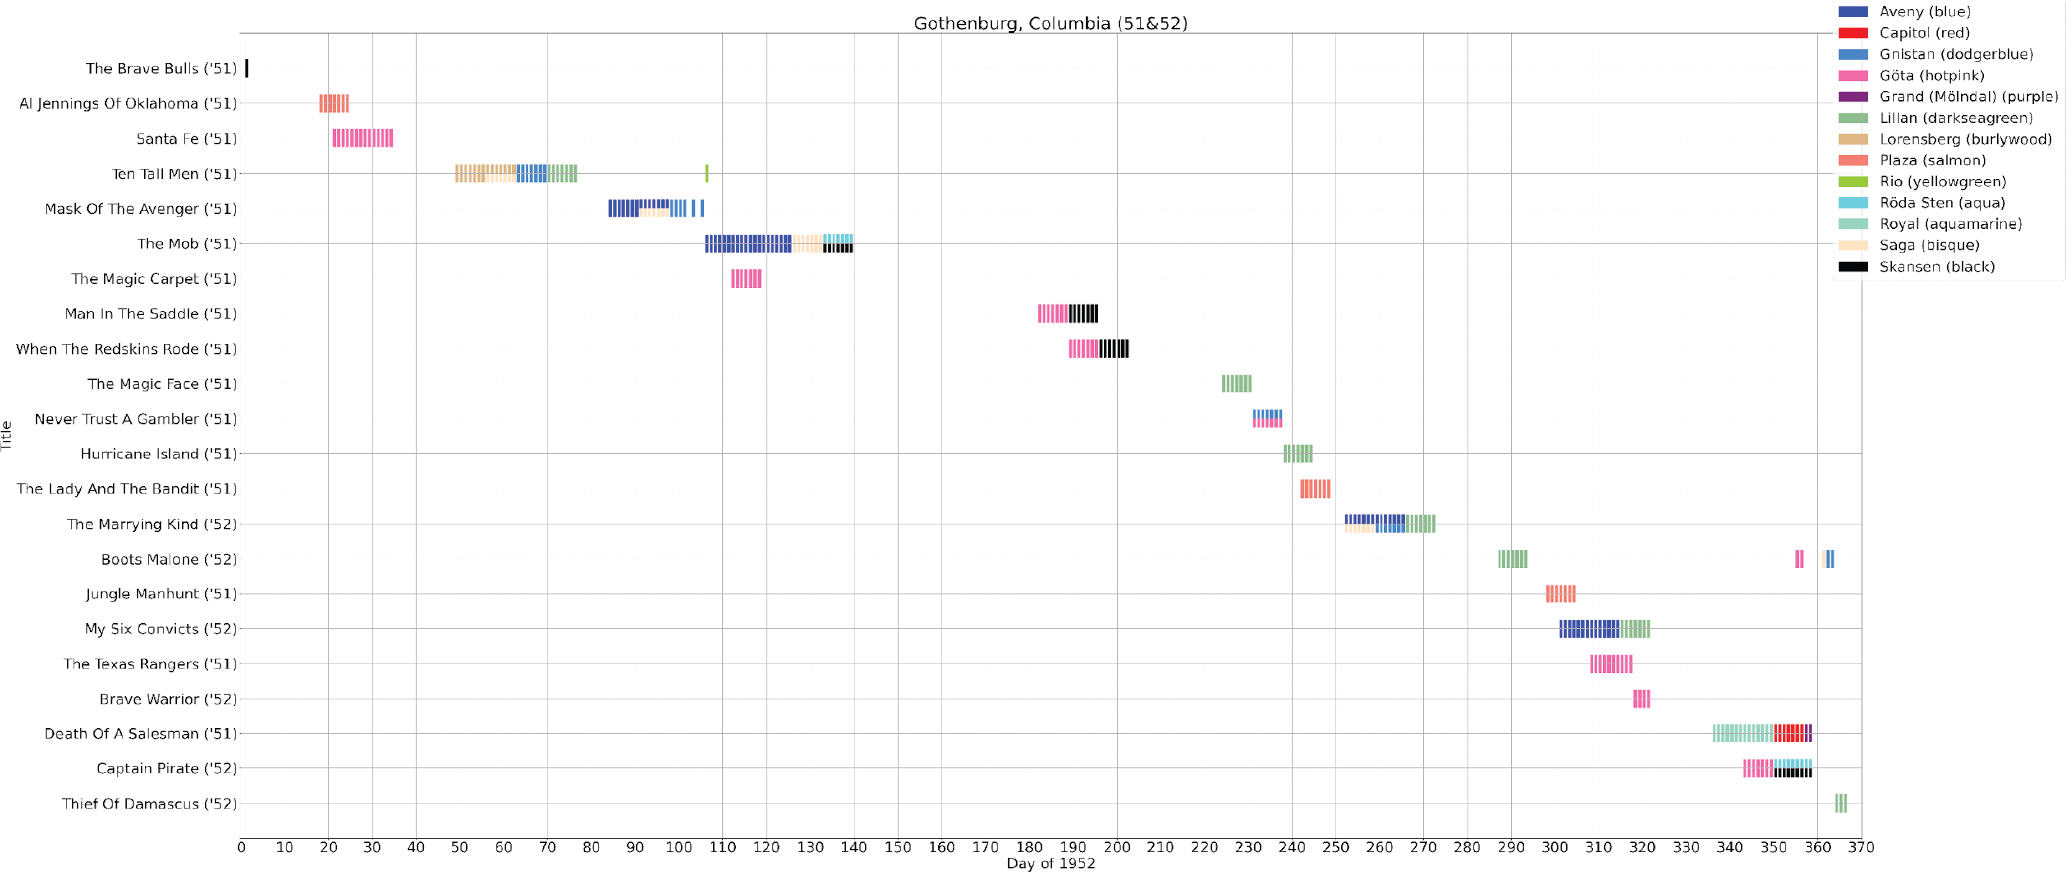
Figure 13
Films produced in 1951 and 1952 by Columbia, exhibited in Gothenburg in 1952.
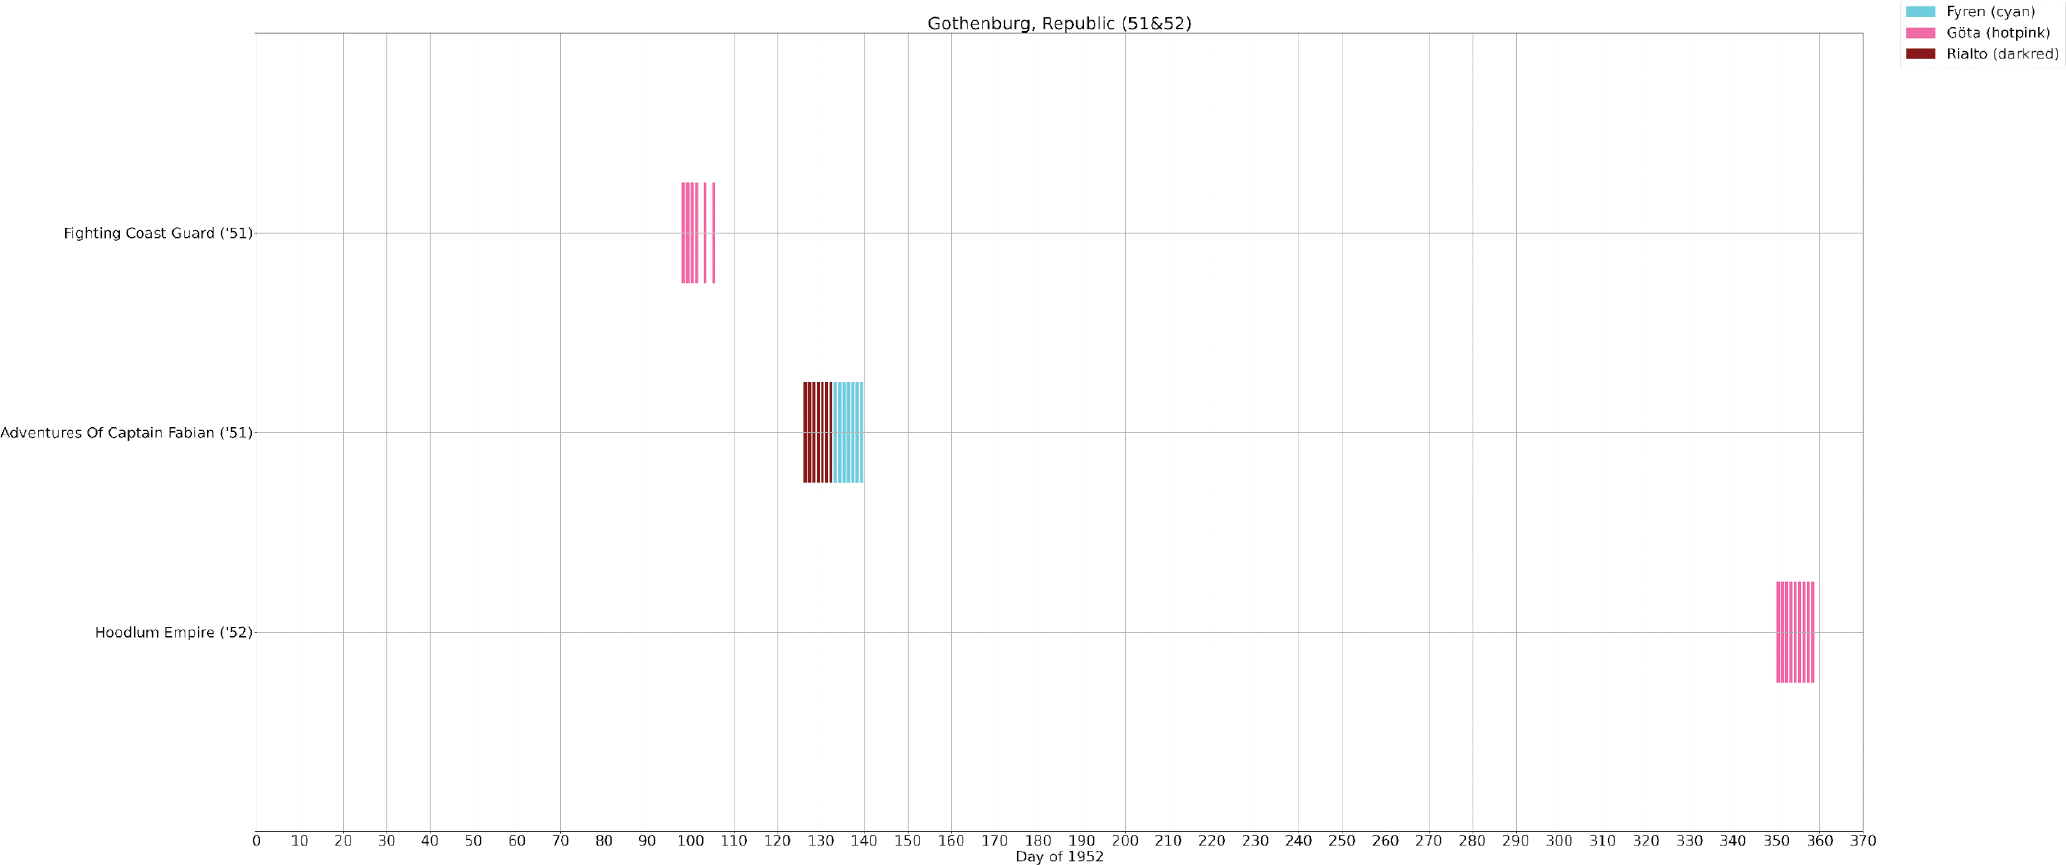
Figure 14
Films produced in 1951 and 1952 by Republic, exhibited in Gothenburg in 1952.
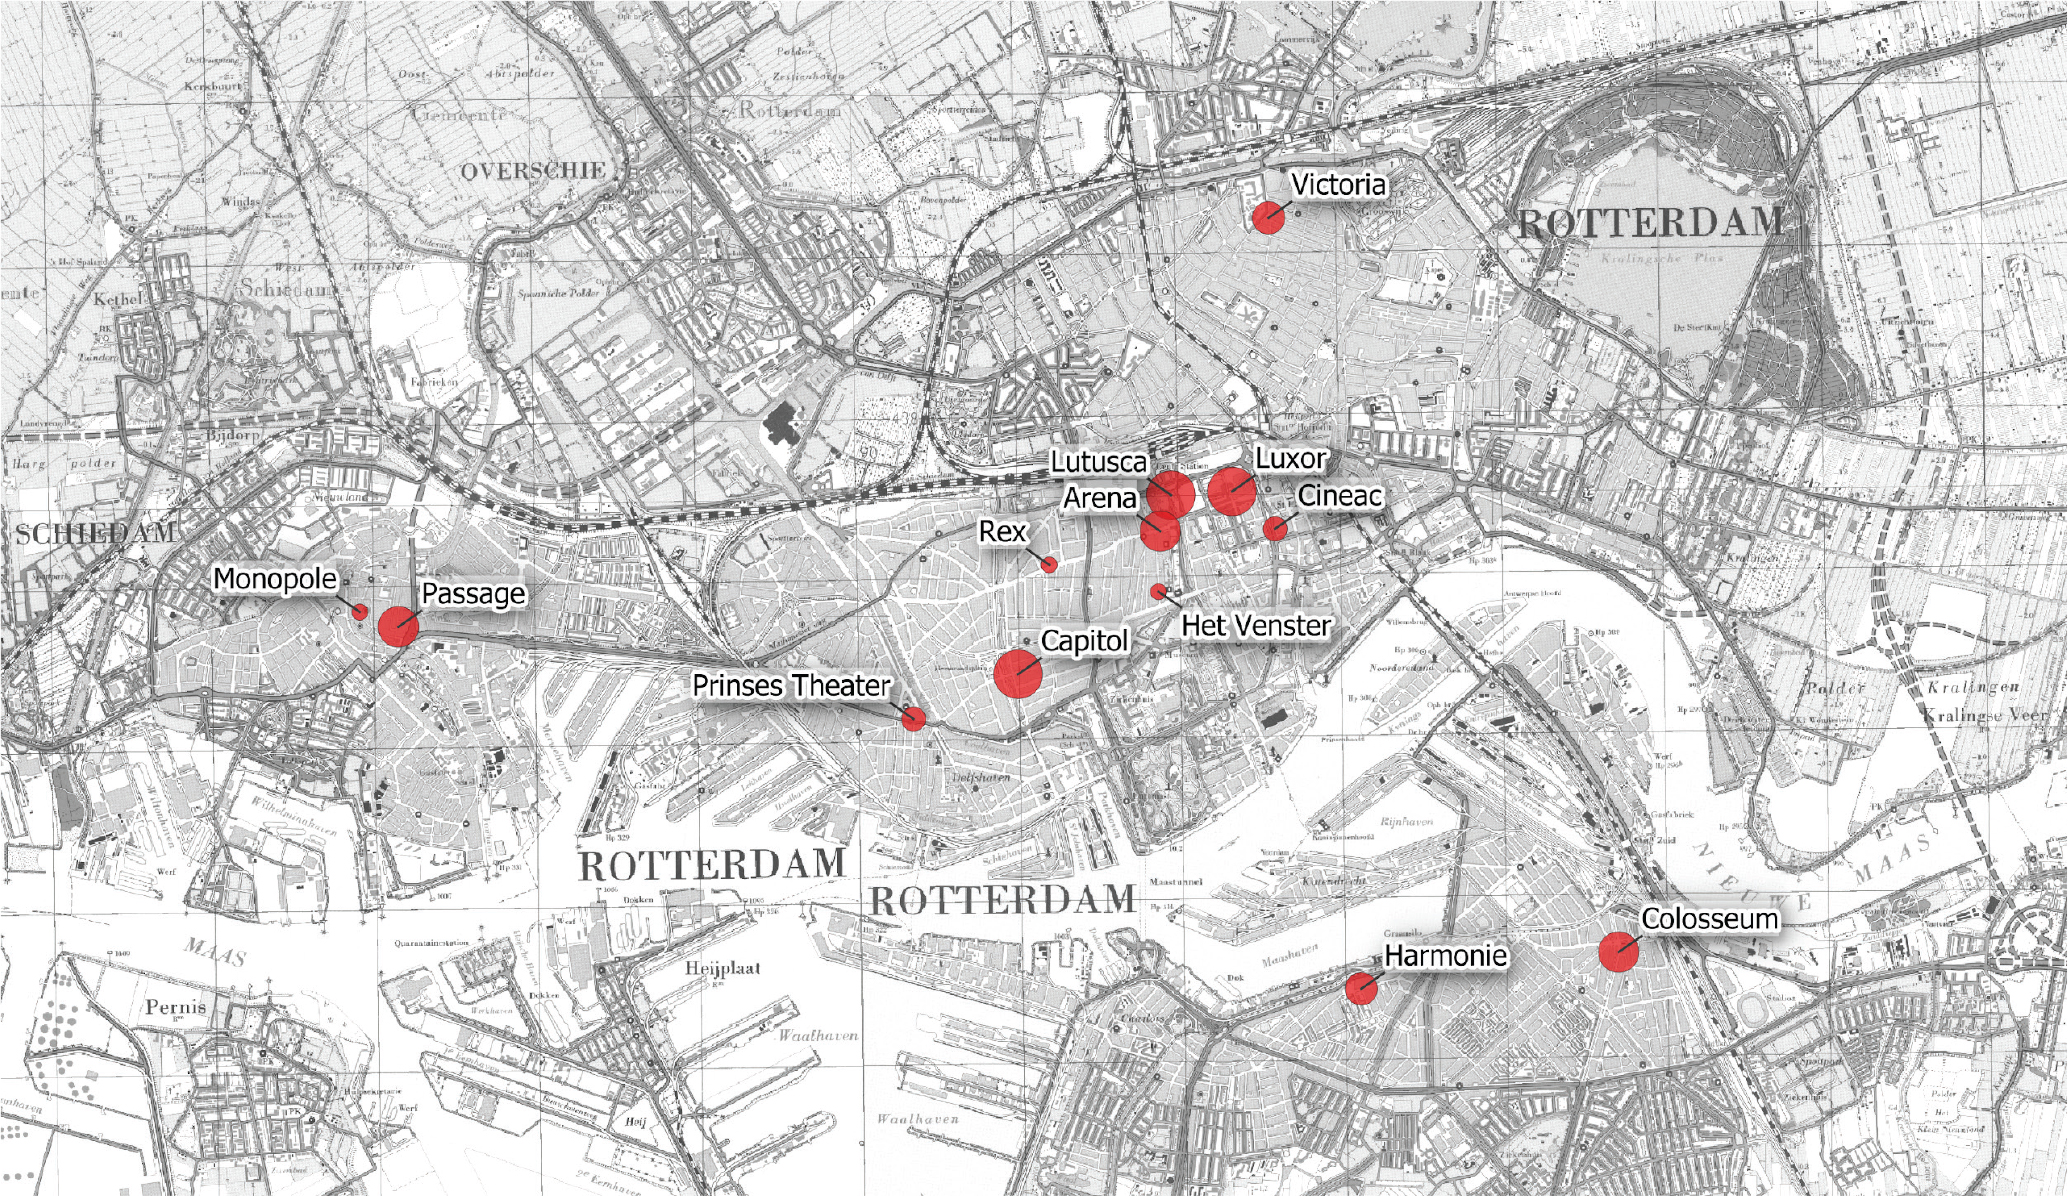
Figure 15
Map of Rotterdam, showing the location of the cinemas included in the programming analysis. The size of the dots refers to the relative size of the cinema as measured by its seating capacity. Basemap ‘Gemeentewerken Rotterdam’ (1963), Rotterdam City Archives.
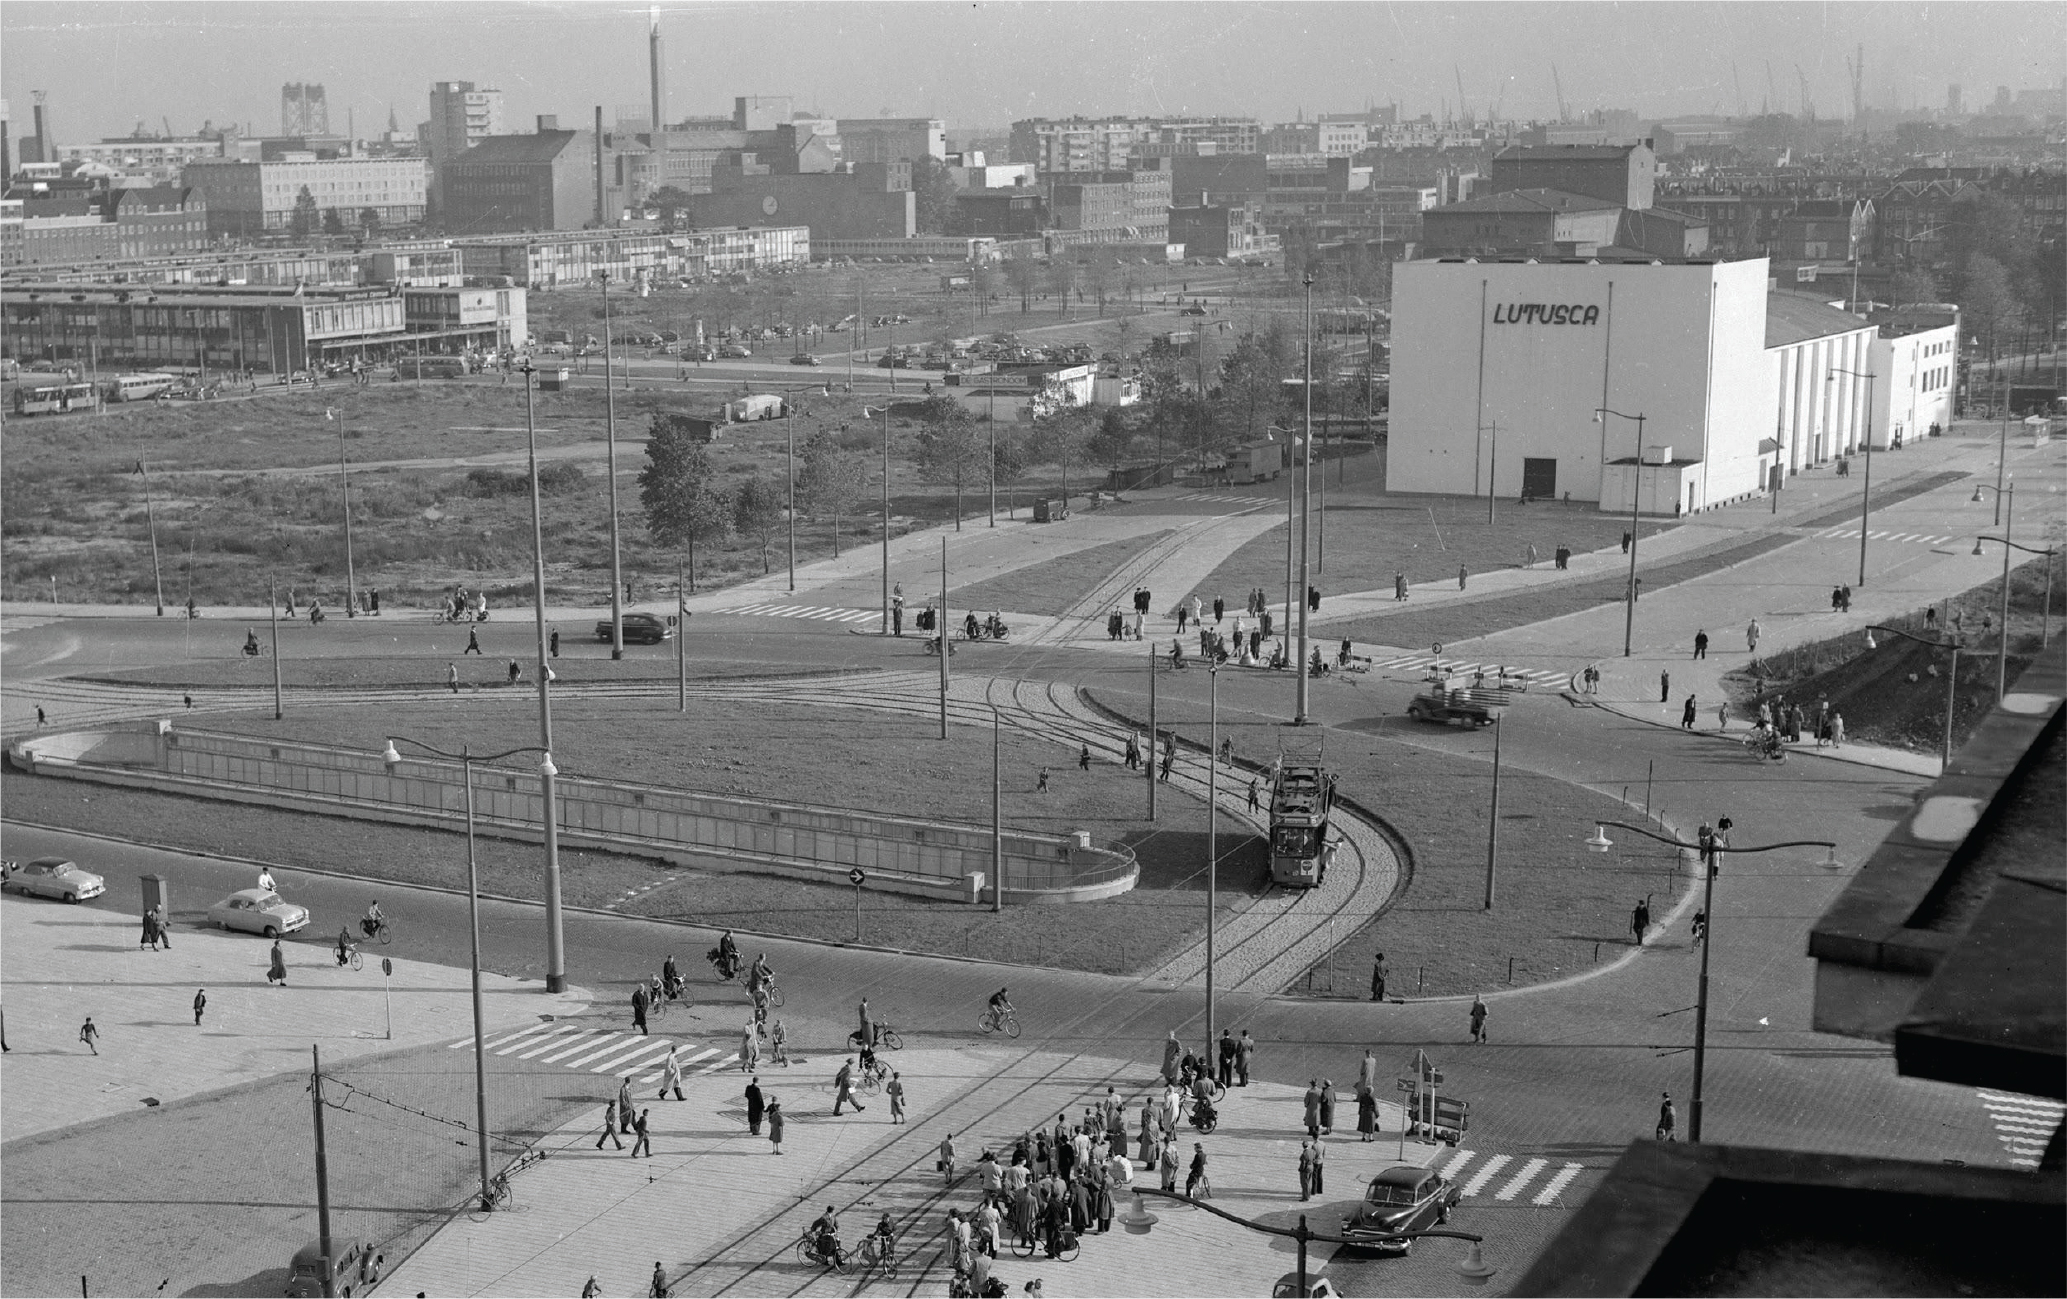
Figure 16
Aerial photo depicting Lutusca Cinema in Rotterdam (Photo by Lex de Herder, ca. 1953–1956; source: Rotterdam City Archives, https://collecties.stadsarchief.rotterdam.nl/detail.php?id=345378 ).
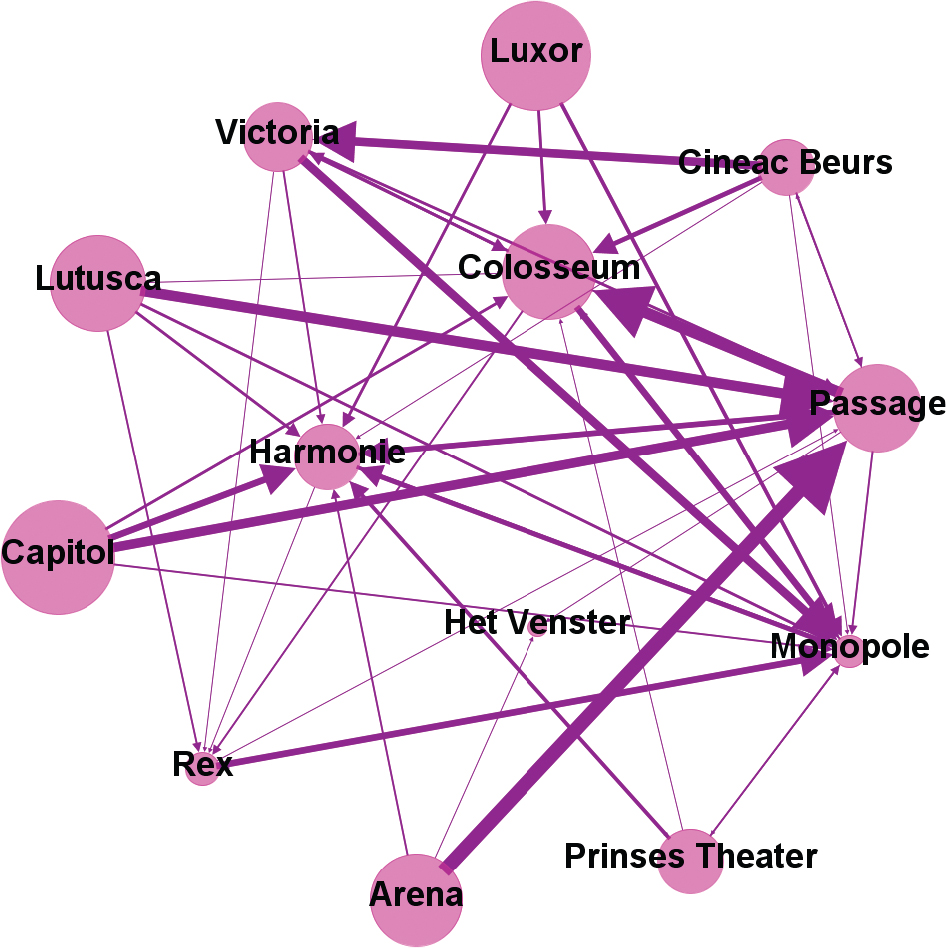
Figure 17
Flow of films for the Rotterdam dataset, edge weight 1.
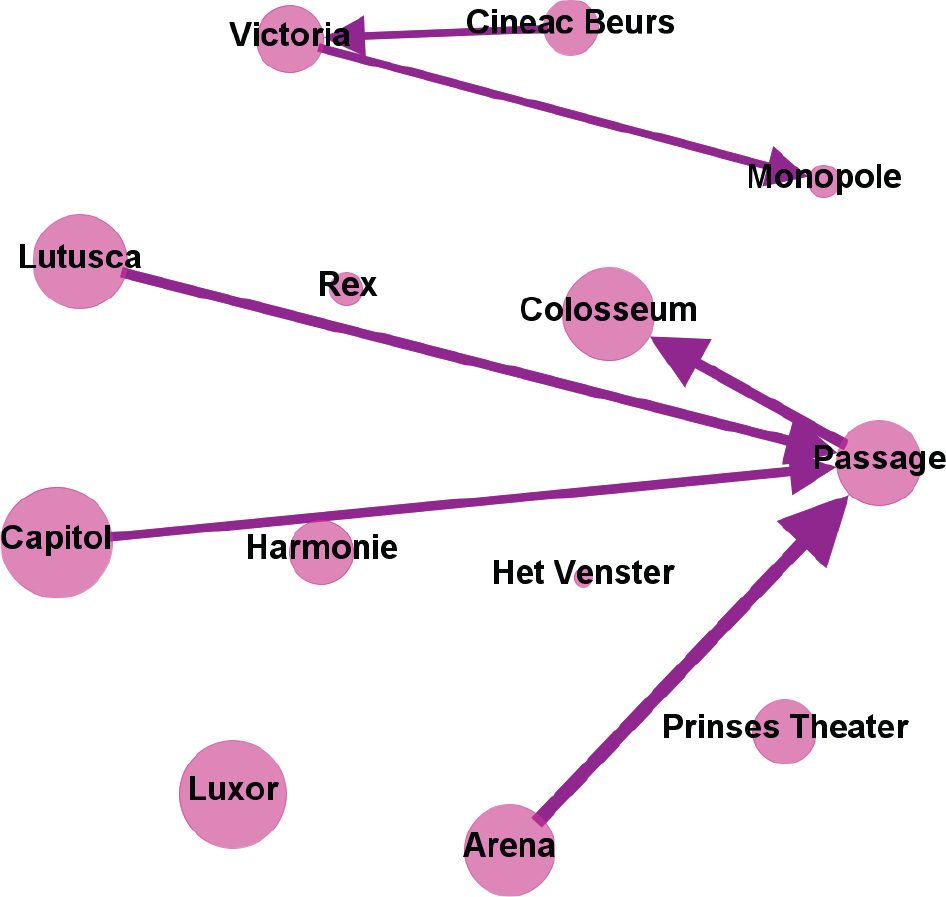
Figure 18
Flow of films for the Rotterdam dataset, edge weight 8.
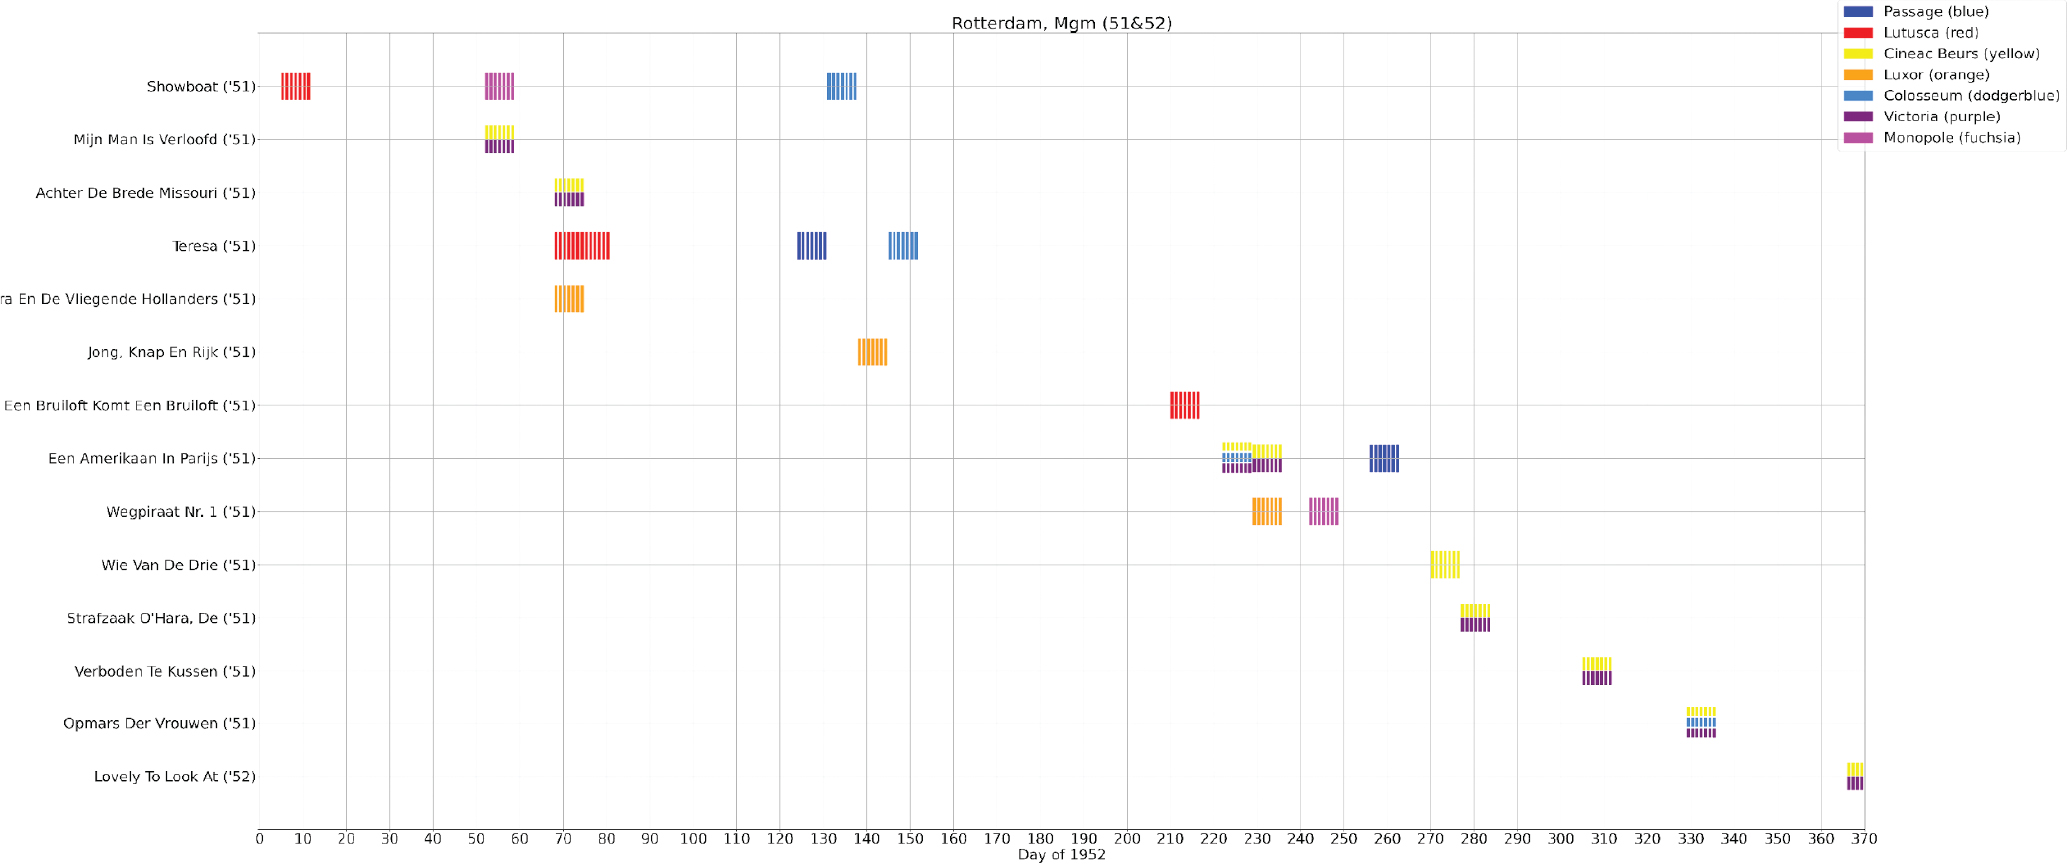
Figure 19
Time plot visualisation for all films produced by MGM in 1951 and 1952 that screened in Rotterdam cinemas in 1952. The X-axis represents the number of days that a film screened, starting with the first day in 1952 that a screening was documented for cinemas in Rotterdam.
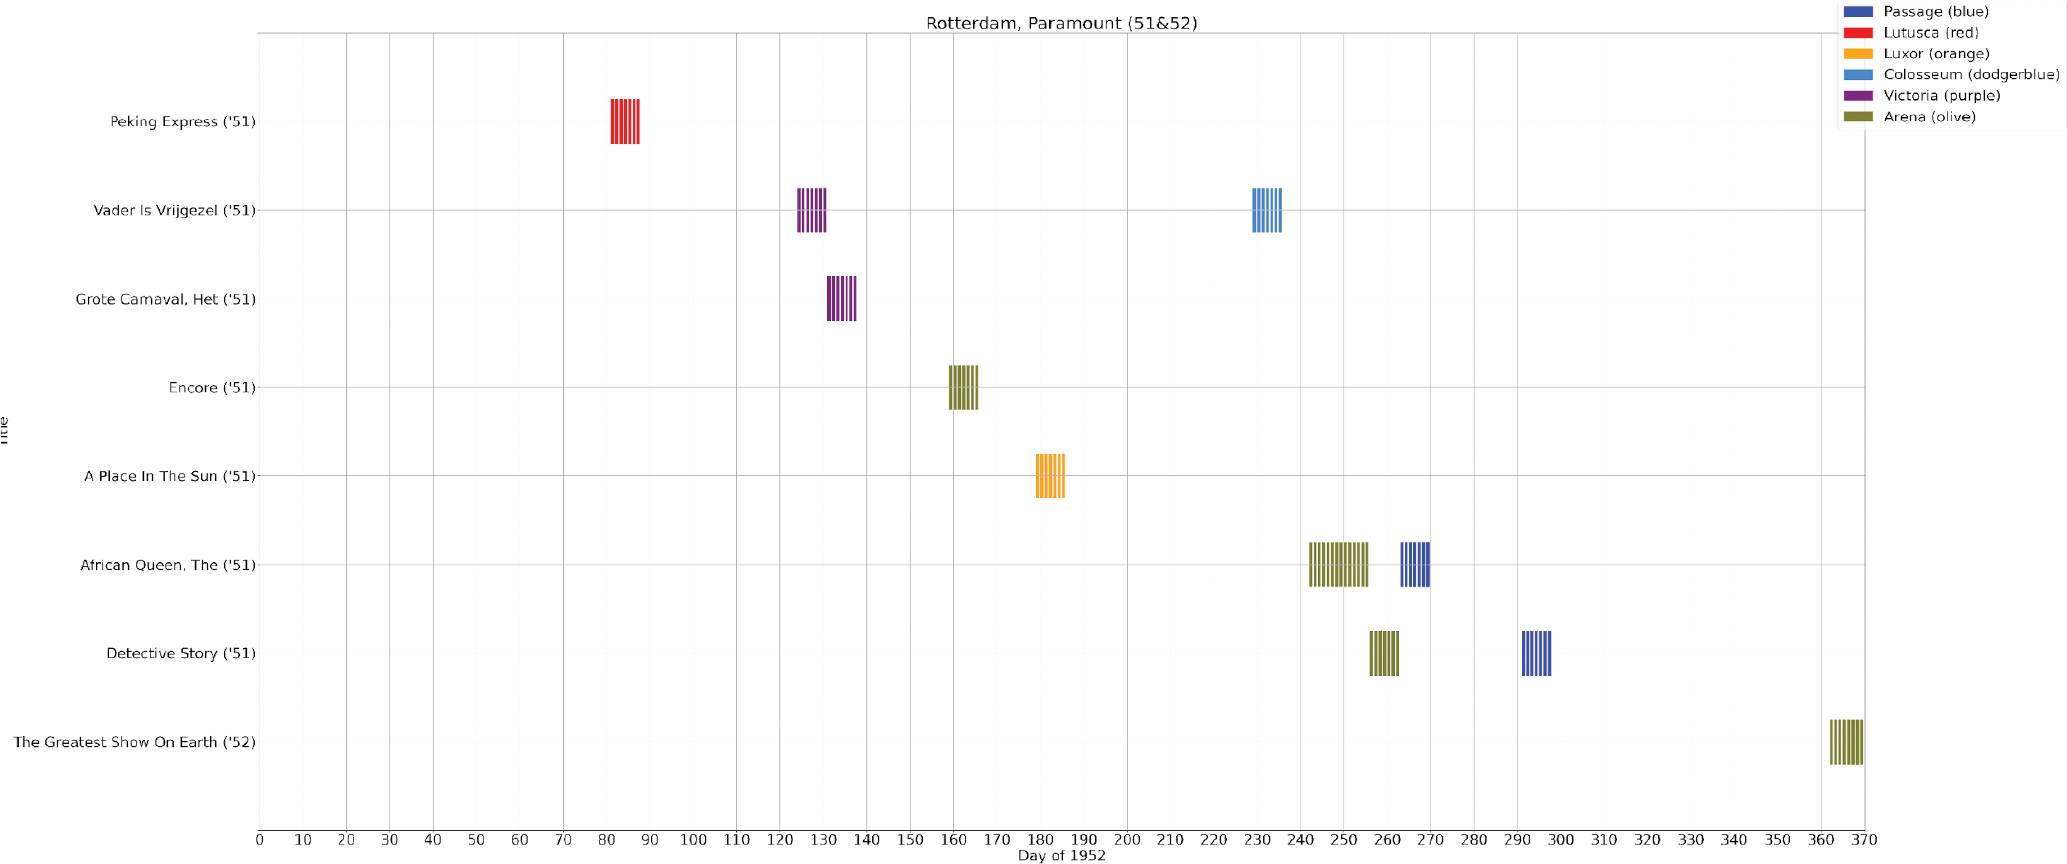
Figure 20
Films produced in 1951 and 1952 by Paramount exhibited in Rotterdam in 1952.
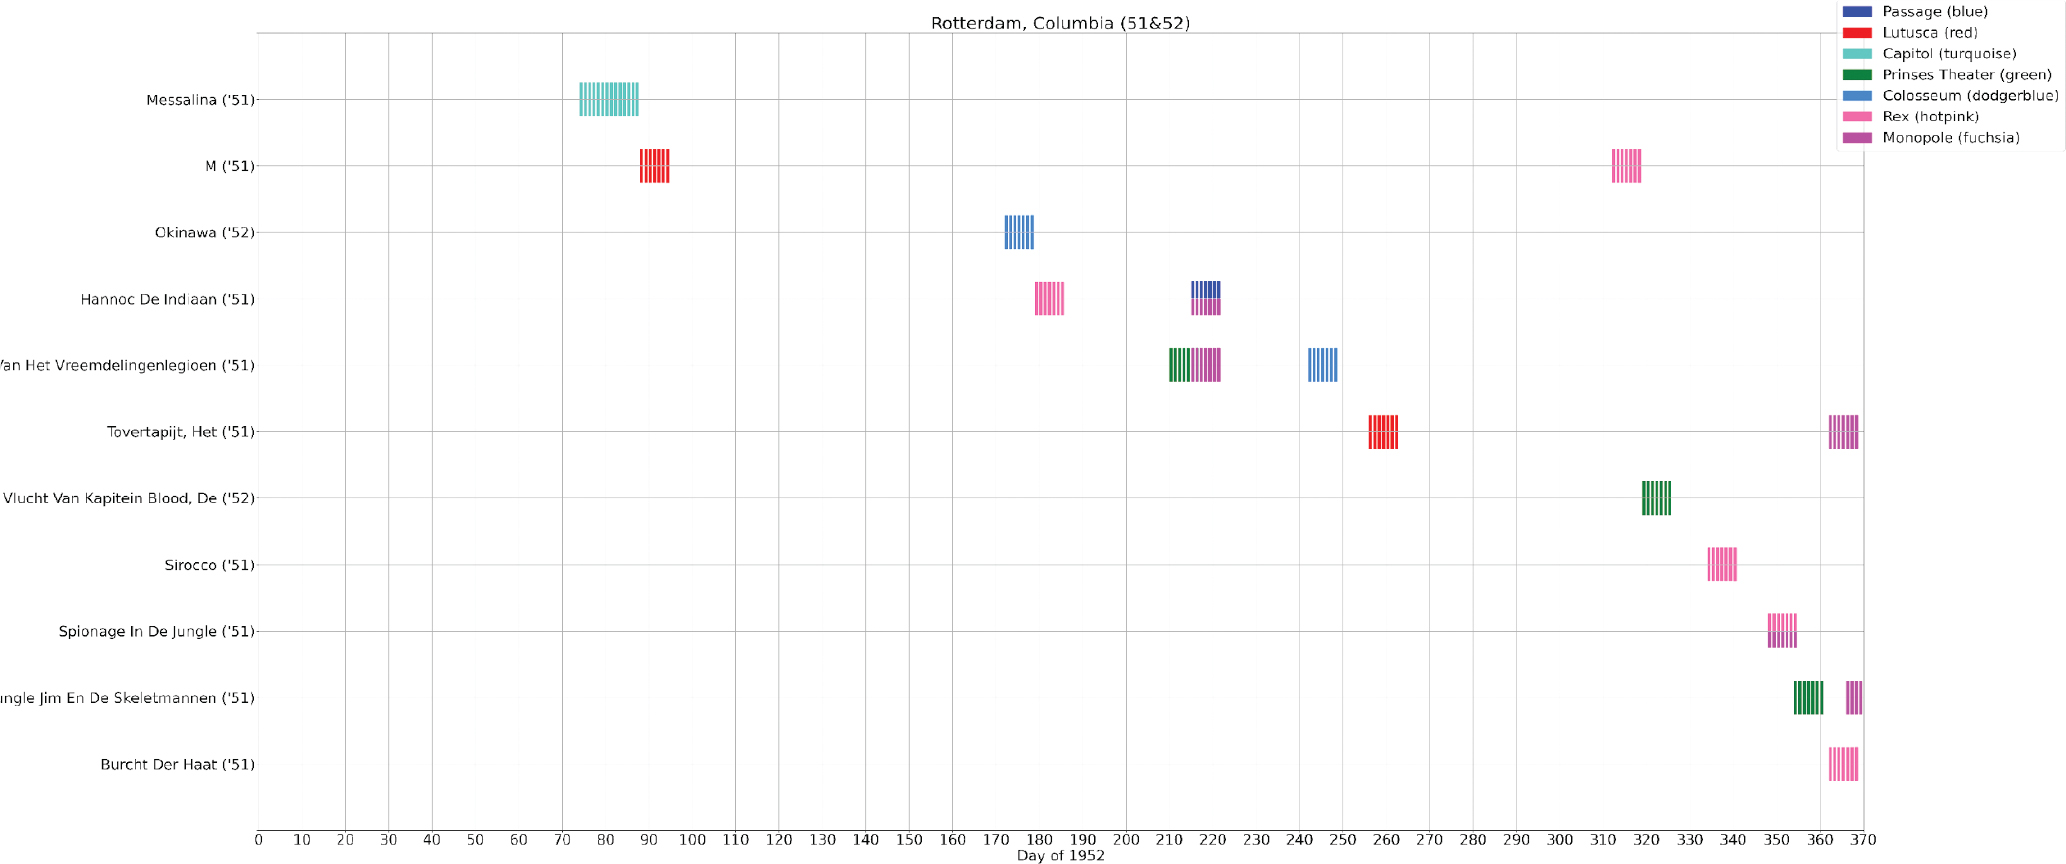
Figure 21
Films produced in 1951 and 1952 by Columbia exhibited in Rotterdam in 1952.
Table 4
Simultaneous first runs in Rotterdam 1952.
| Frequency | Cinema | Cinema | Cinema |
|---|---|---|---|
| 7 | Colosseum | Victoria | |
| 6 | Cineac Beurs | Victoria | |
| 4 | Luxor | Prinses Theater | |
| 3 | Cineac Beurs | Colosseum | Victoria |
| 3 | Cineac Beurs | Colosseum | |
| 1 | Arena | Capitol |
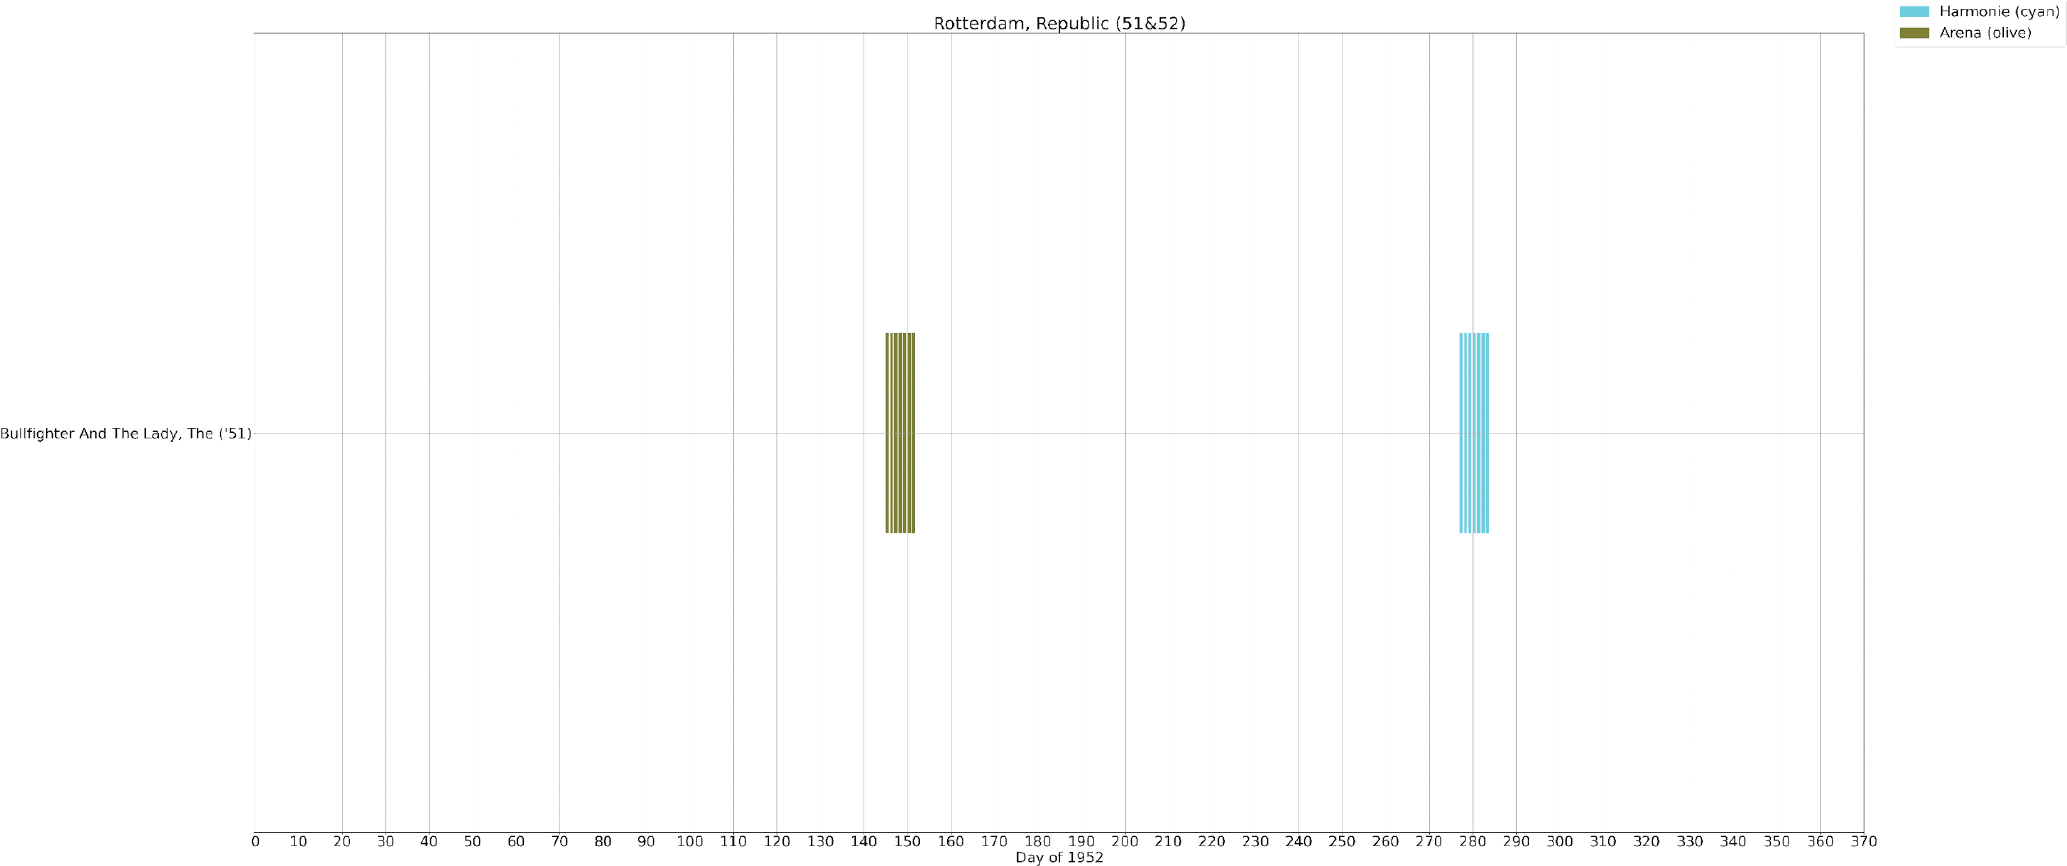
Figure 22
Films produced in 1951 and 1952 by Republic exhibited in Rotterdam in 1952.