
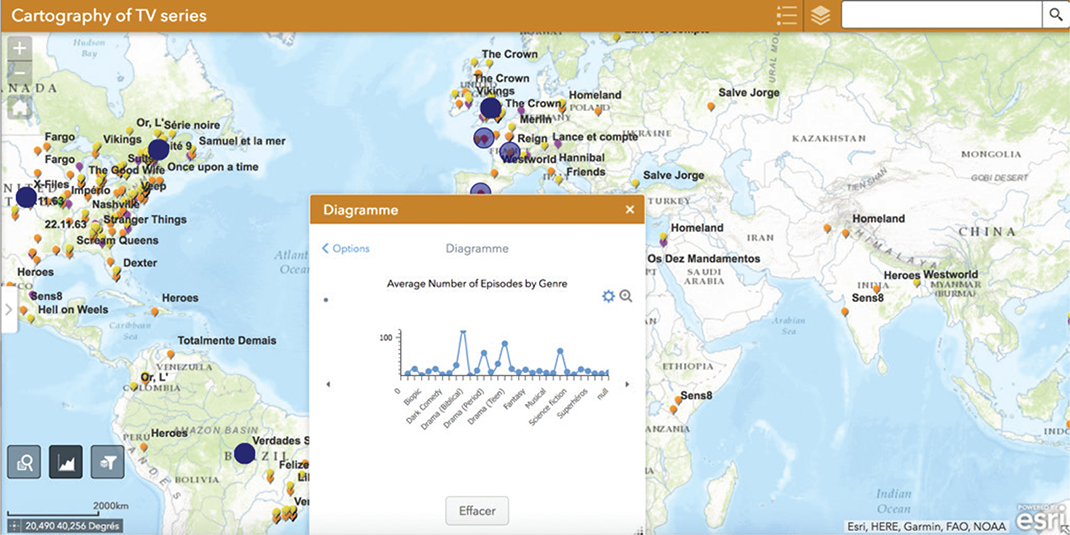
Figure 1
Accessing a diagram from the map.
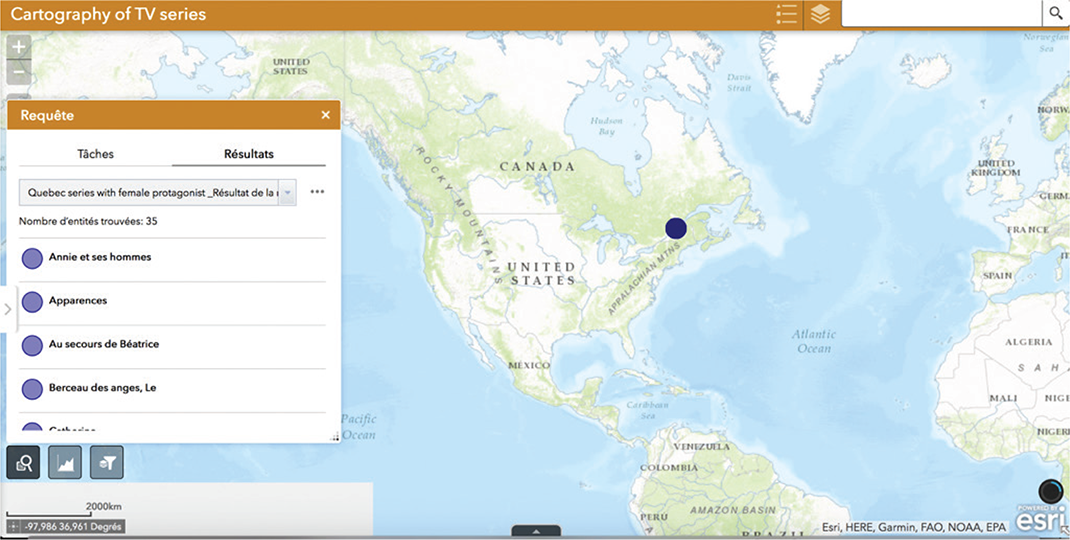
Figure 2
Map and list displaying manually-gathered information on French-Canadian series with a female protagonist.
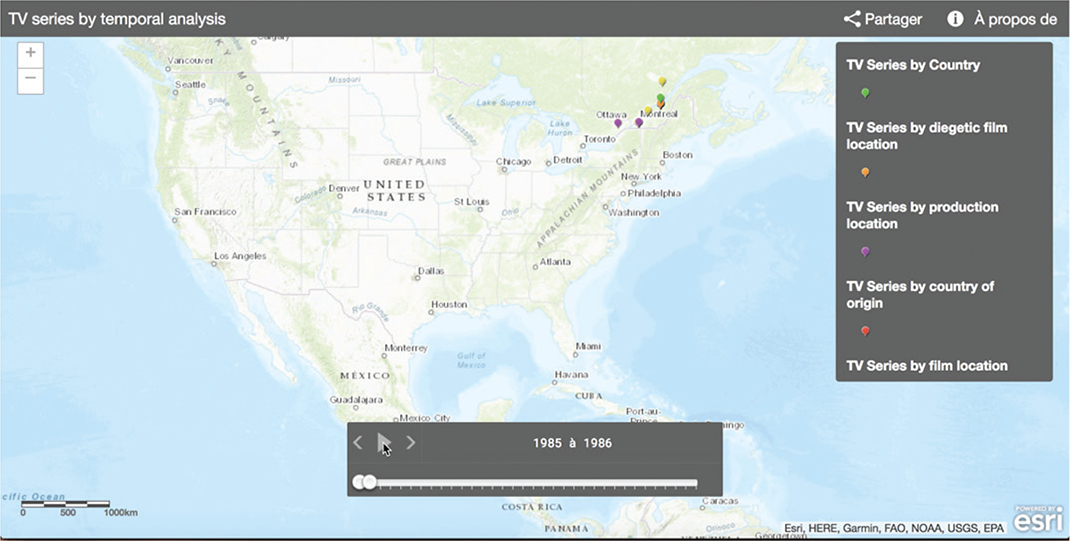
Figure 3
Esri platforms also allow animated maps, useful to display evolution over time: here, the growth of television series production from 1985 to 2017.
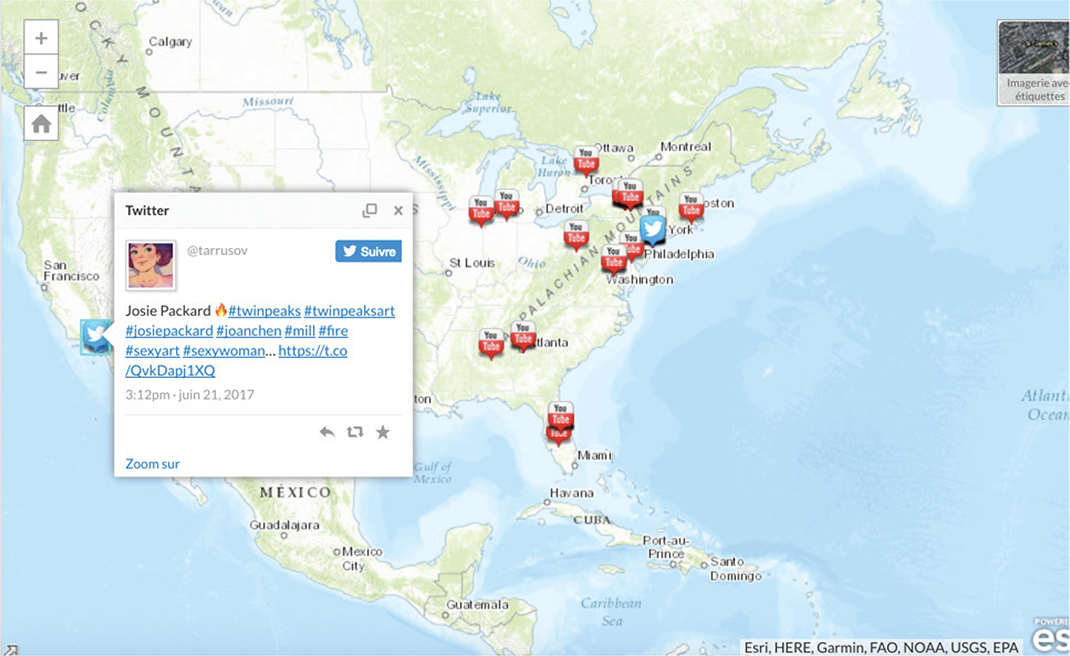
Figure 4
Mixed social network interactions for Twin Peaks: The Return via the Esri map (July 2017).
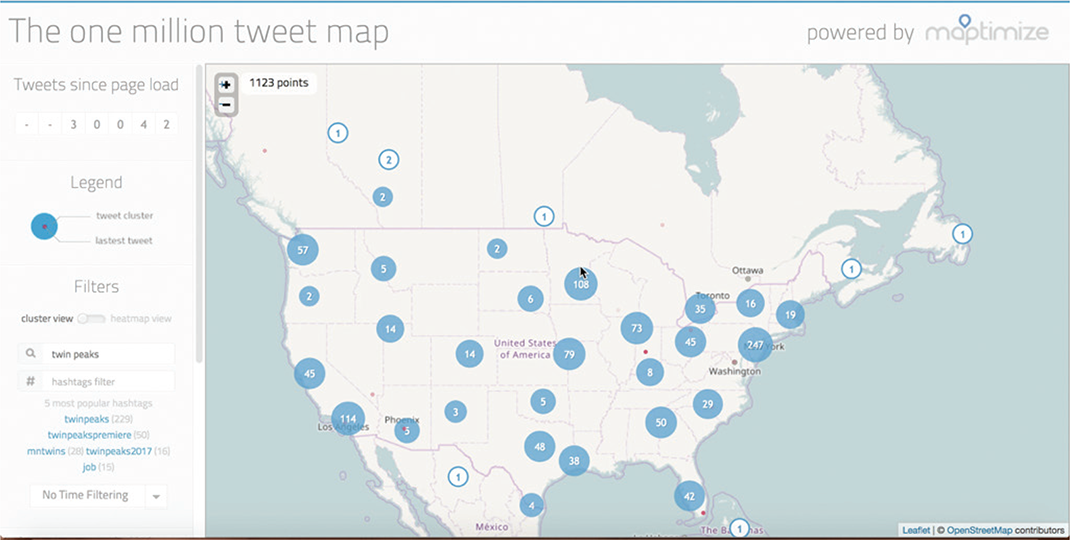
Figure 5
Tweets on the Twin Peaks: The Return Premiere (May 21st, 2017), via One Million Tweets.