
Fig. 1.
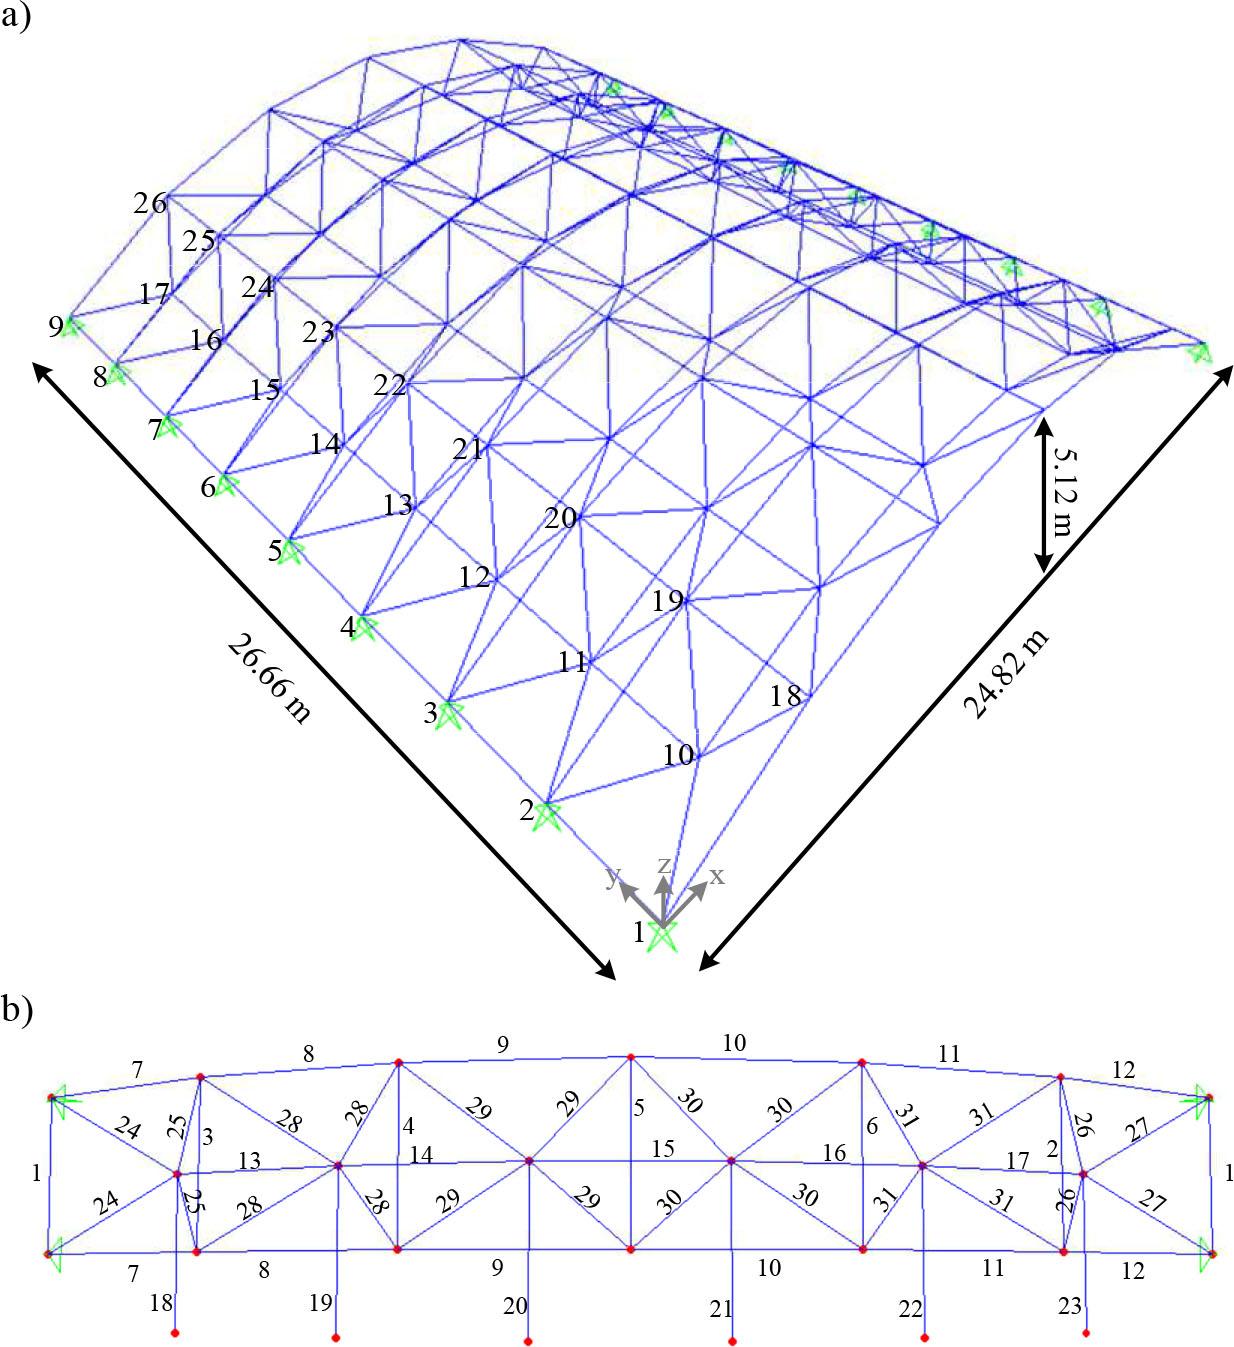
Fig. 2.
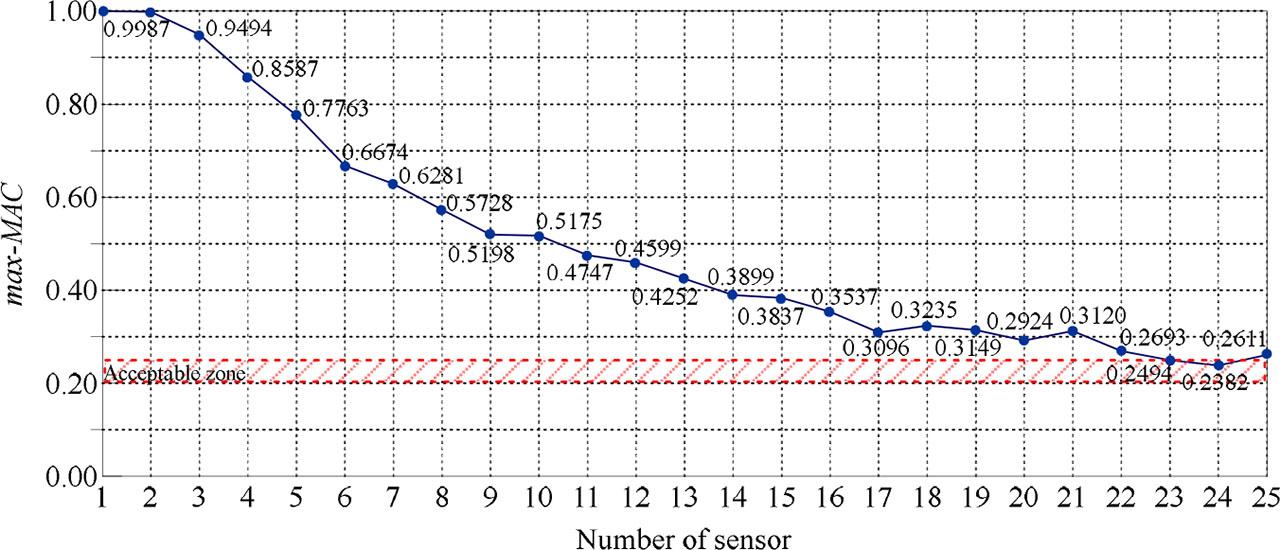
Fig. 3.
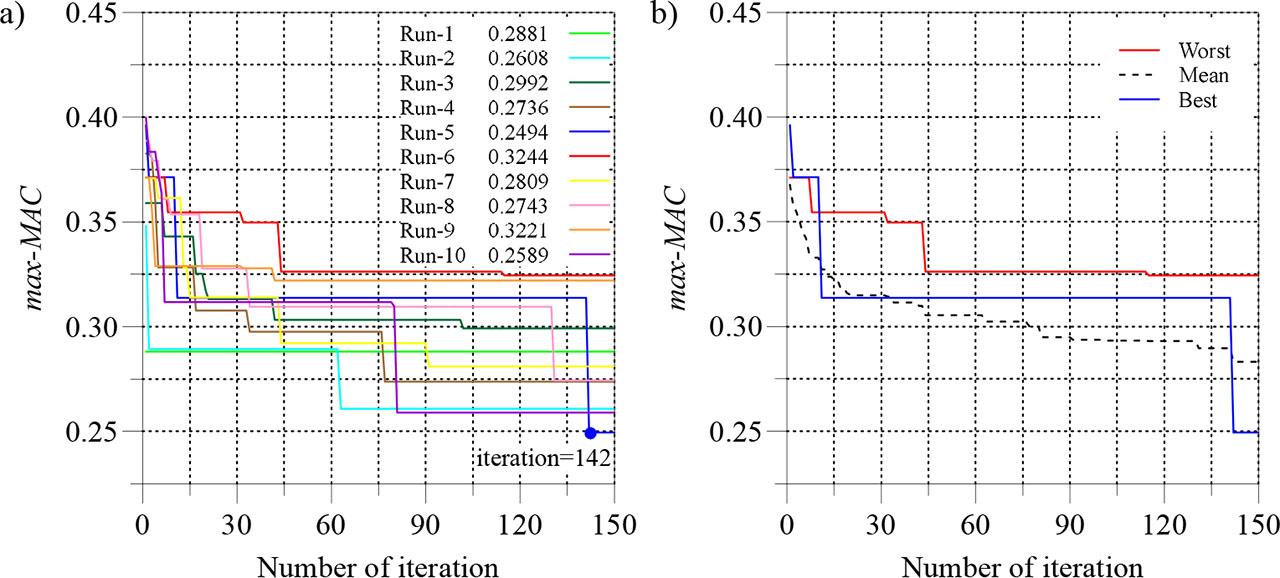
Fig. 4.
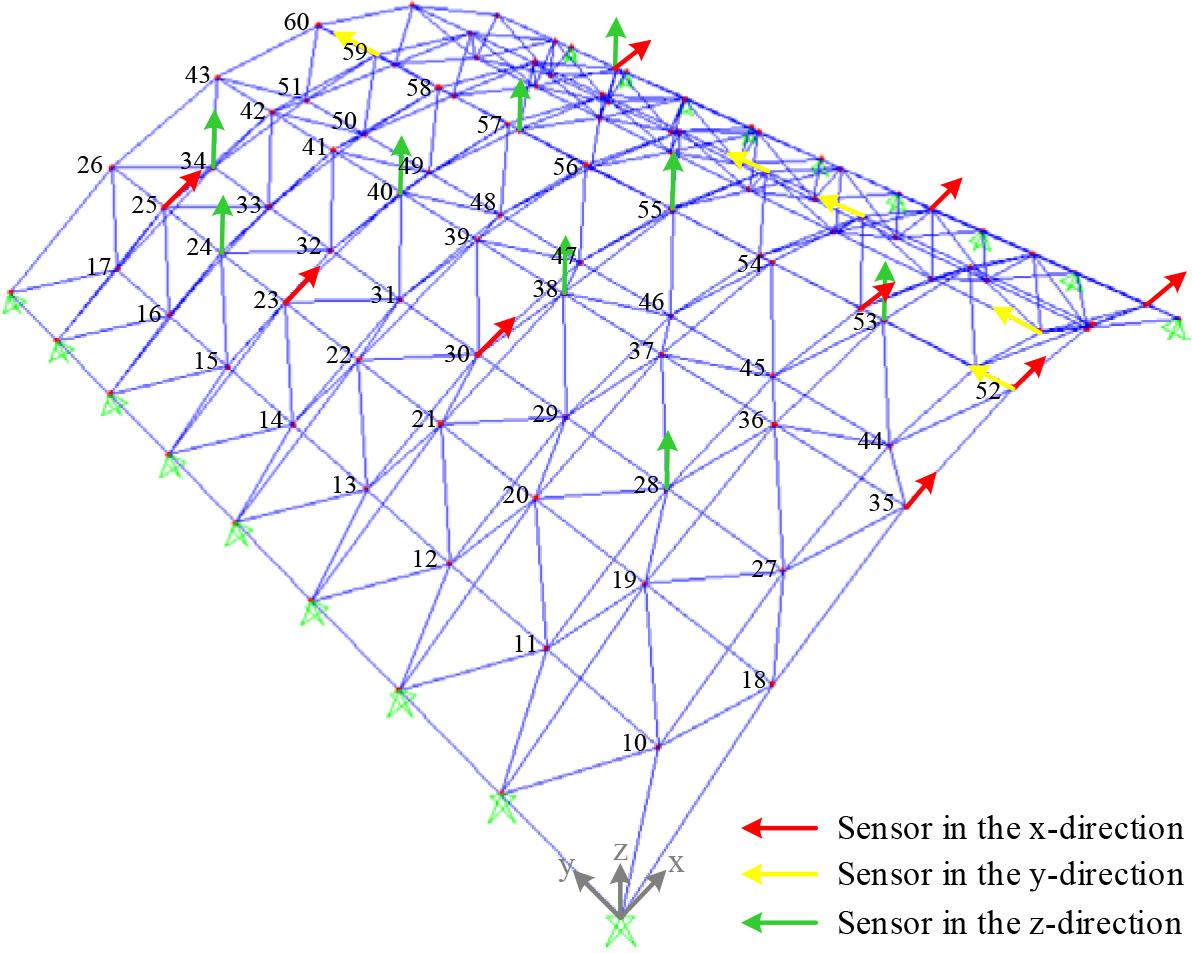
Fig. 5.
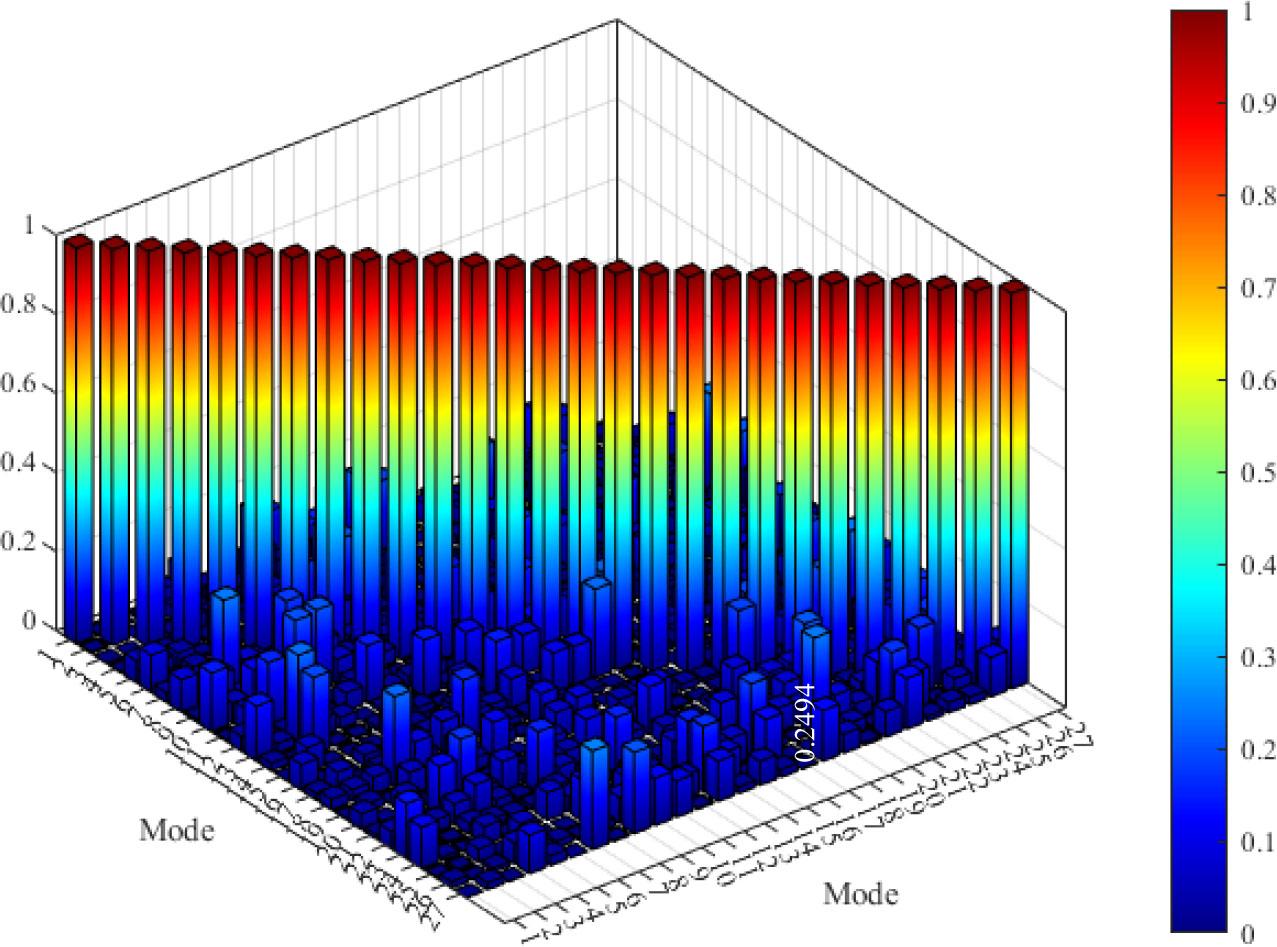
Optimum sensor locations obtained (own research)
| Number of relevant modes | Number of sensors | Objective function | Best run | Optimum sensor locations | |
|---|---|---|---|---|---|
| 27 | 23 | max-MAC | Run-5 | x | 23, 25, 30, 35, 52, 62, 86, 88, 92 |
| y | 52, 59, 71, 72, 78 | ||||
| z | 24, 28, 34, 38, 40, 53, 55, 66, 92 | ||||
Cross-sectional areas of the pipe steel sections used in the 384-bar DLBBV structure (own research)
| Element group | Steel pipe area | Element group | Steel pipe area | Element group | Steel pipe area | Element group | Steel pipe area |
|---|---|---|---|---|---|---|---|
| 1 | 1.4800 | 9 | 15.6000 | 17 | 3.6800 | 25 | 1.7000 |
| 2 | 0.6690 | 10 | 12.8000 | 18 | 0.6690 | 26 | 0.6690 |
| 3 | 2.2300 | 11 | 11.3000 | 19 | 0.7990 | 27 | 1.4800 |
| 4 | 0.6690 | 12 | 11.3000 | 20 | 1.0700 | 28 | 1.0700 |
| 5 | 0.8810 | 13 | 3.0200 | 21 | 0.7990 | 29 | 0.7990 |
| 6 | 0.8810 | 14 | 21.3000 | 22 | 1.7000 | 30 | 0.7900 |
| 7 | 14.6000 | 15 | 2.2500 | 23 | 1.0700 | 31 | 0.7990 |
| 8 | 15.6000 | 16 | 4.0300 | 24 | 1.7000 |
max-MAC values obtained as a result of the analysis (own research)
| Run | max-MAC | Iteration | NFE | Run | max-MAC | Iteration | NFE |
|---|---|---|---|---|---|---|---|
| 1 | 0.2881 | 1 | 100 | 6 | 0.3244 | 115 | 5800 |
| 2 | 0.2608 | 63 | 3200 | 7 | 0.2809 | 91 | 4600 |
| 3 | 0.2992 | 102 | 5150 | 8 | 0.2743 | 131 | 6600 |
| 4 | 0.2736 | 77 | 3900 | 9 | 0.3221 | 42 | 2150 |
| 5* | 0.2494 | 142 | 7150 | 10 | 0.2589 | 81 | 4100 |