Fig. 1.
Fig. 2.
Fig. 3.
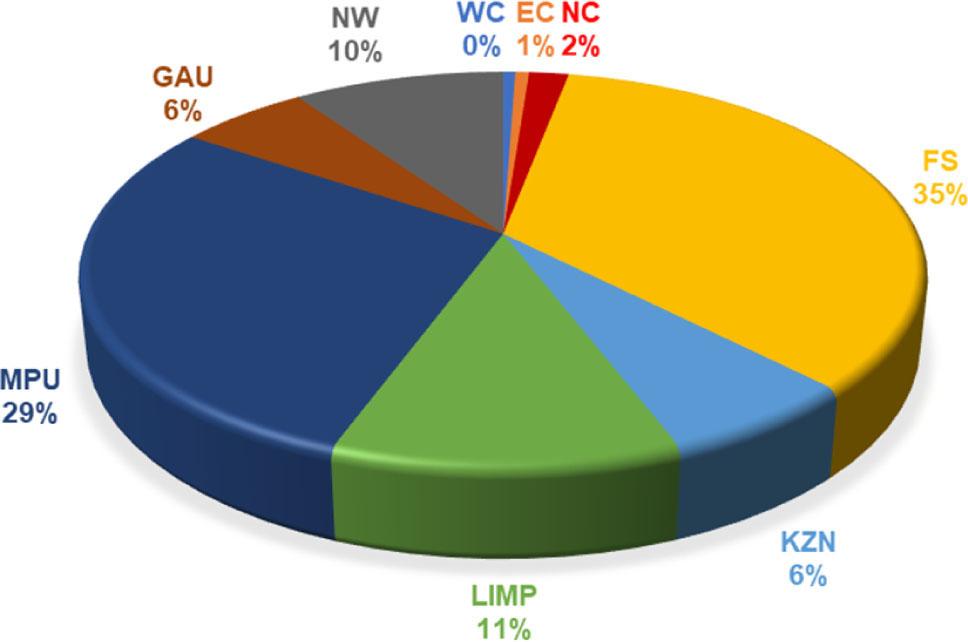
Fig. 4.
Instability index for the dry bean area, production, yield, consumption, import and export from 1970–2019
| Period | Area | Production | Yield | Consumption | Import | Export |
|---|---|---|---|---|---|---|
| 1970–79 | 3.03 | 2.24 | 25.25 | 0.53 | 4.94 | 5.65 |
| 1980–89 | 1.68 | 3.72 | 18.85 | 0.55 | 15.72 | 5.17 |
| 1990–99 | 5.34 | 9.08 | 23.43 | 0.99 | 14.28 | 5.98 |
| 2000–09 | 2.90 | 5.35 | 18.24 | 1.11 | 2.20 | 7.79 |
| 2010–2019 | 4.90 | 6.43 | 14.92 | 0.32 | 0.62 | 3.91 |
| 1970–2019 | 3.56 | 6.35 | 16.68 | 1.18 | 9.06 | 9.34 |
Trend in dry bean area, production, yield and consumption from 1970–2019 (5-year average)
| Periods | Area (000 ha) | Production (000 t) | Yield (t ha−1) | Consumption (000 t) | Imports (t) | Exports (t) |
|---|---|---|---|---|---|---|
| 1970–1974 | 74 | 66 | 0.929 | 53 | 5 796 | 4 900 |
| 1975–1979 | 103 | 89 | 0.891 | 61 | 2 705 | 6 502 |
| 1980–1984 | 75 | 79 | 1.065 | 61 | 9 111 | 5 552 |
| 1985–1989 | 82 | 109 | 1.327 | 73 | 8 330 | 16 654 |
| 1990–1994 | 73 | 72 | 0.978 | 102 | 58 679 | 12 999 |
| 1995–1999 | 57 | 70 | 1.240 | 102 | 42 474 | 4 450 |
| 2000–2004 | 56 | 80 | 1.435 | 123 | 53 259 | 6 049 |
| 2005–2009 | 48 | 63 | 1.333 | 131 | 79 398 | 2 834 |
| 2010–2014 | 49 | 67 | 1.354 | 139 | 78 513 | 2 909 |
| 2015–2019 | 48 | 67 | 1.381 | 86 | 26 443 | 13 530 |
Compound growth rates in the dry bean area, production, yield and consumption from 1970–2019
| Period | Area | Production | Yield | Consumption | Import | Export |
|---|---|---|---|---|---|---|
| 1970–79 | 6.758* | 5.517** | −1.162 | 2.6598* | −19.287* | 12.414 |
| 1980–89 | 1.533 | 5.835* | 4.237 | 2.760* | 4.836 | 20.021* |
| 1990–99 | −3.903 | 0.582 | 4.668 | 1.147 | 22.428 | −15.334* |
| 2000–09 | −3.696* | −3.696 | −0.137 | 1.943 | 10.725* | −9.749 |
| 2010–19 | 2.411 | 3.520 | 1.010 | −8.199** | −22.727** | 27.22** |
| 1970–2019 | −1.497** | −0.472 | 1.040** | 1.880** | 7.443** | −0.282 |
Compound growth rates and instability index in provincial contribution of dry bean production from 2000/2001–2019/2020
| Province | CAGR | CDI |
|---|---|---|
| Western Cape | −1.65 | 8.96 |
| Northern Cape | 2.34 | 9.82 |
| KwaZulu Natal | 4.70* | 5.68 |
| Mpumalanga | −9.25** | 1.35 |
| Northwest | 1.94 | 5.05 |
| Eastern Cape | 2.571 | 11.30 |
| Free State | 2.68* | 2.88 |
| Limpopo | 18.59** | 4.81 |
| Gauteng | −6.74** | 3.23 |