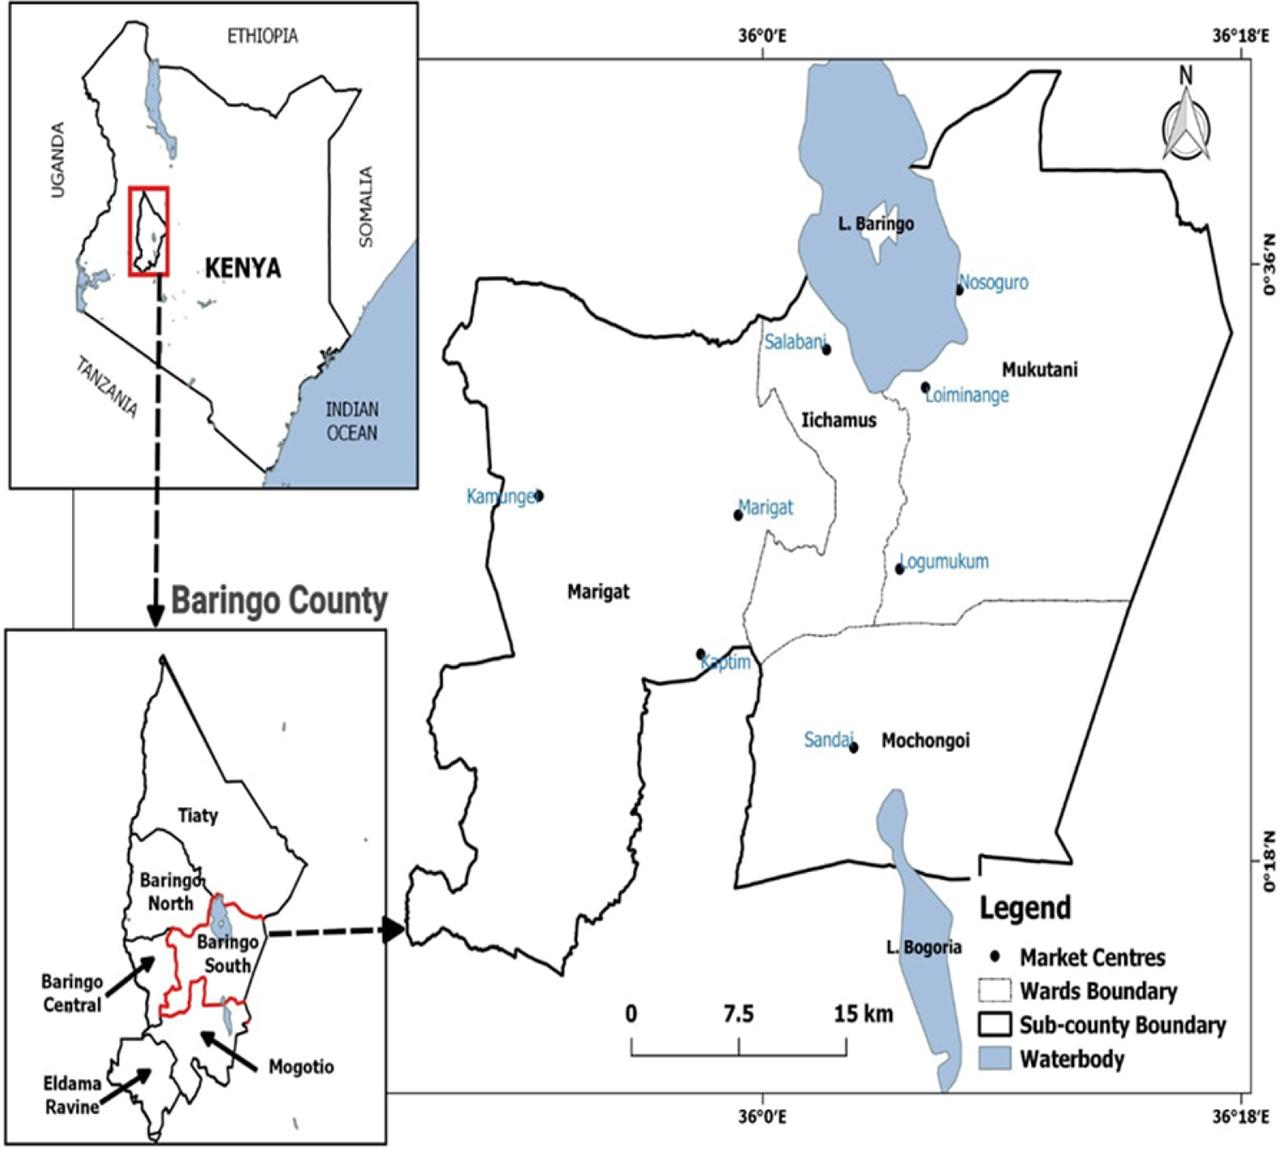
Fig. 1.
Institutional characteristic results of adopters and non-adopters
| Variable | Adopters = 74 | Non-adopters = 123 | x2 | |
|---|---|---|---|---|
| Group membership | Yes | 70(94.59) | 38(30.89) | 75.6958*** |
| No | 4(5.41) | 85(69.11) | ||
| Extension Access | Yes | 60(81.08) | 41(33.33) | 42.1615*** |
| No | 14(18.92) | 82(66.67) | ||
| Credit access | Yes | 67(90.54) | 43(34.96) | 57.8824*** |
| No | 7(9.46) | 80(65.04) | ||
Comparison of household characteristics by farmer type for dummy variables
| Variable | Uptake (%) | Non-uptake (%) | Aggregate | x2 | |
|---|---|---|---|---|---|
| Gender | male | 87.84 | 46.34 | 61.93 | 6.4066*** |
| female | 12.16 | 53.66 | 38.07 | ||
| Ownership of beehives | head | 70.27 | 76.42 | 74.11 | 6.7568 |
| spouse | 25.68 | 13.82 | 18.27 | ||
| child | 2.70 | 8.13 | 6.09 | ||
| relative | 1.35 | 0.82 | 1.02 | ||
| Marital status | married | 91.89 | 78.05 | 83.25 | 22.1844** |
| widowed | 1.35 | 4.88 | 3.55 | ||
| single | 6.76 | 17.07 | 13.20 | ||
Mean difference of household characteristics by farmer type
| Variable | Adopters = 74 | Non-adopters = 123 | Aggregate = 197 | t-test | ||
|---|---|---|---|---|---|---|
| mean | std. dev | mean | std. dev | mean | ||
| Age | 45.92 | 12.17 | 41.92 | 13.42 | 43.42 | 2.1014** |
| Education | 11.59 | 3.27 | 5.24 | 2.55 | 7.63 | 15.2011* |
| Household size | 5 | 2.53 | 4.93 | 1.97 | 4.95 | 0.2262* |
| Experience | 10.15 | 6.58 | 4.04 | 1.91 | 6.34 | 9.6572*** |
| Farm size | 4.18 | 4.1 | 4.47 | 3.93 | 4.36 | −0.4974 |
Average input cost of modern and traditional beekeeping production techniques
| Cost type | Modern | Traditional |
|---|---|---|
| Transport | 121.65 | 104.96 |
| Family labour | 196.47 | 107.27 |
| Hired labour | 218.69 | 247.95 |
| Feeding cost | 102.85 | 66.10 |
| Pesticide | 148.52 | 53.48 |
| Servicing | 204.16 | 53.69 |
| Packaging materials | 202.29 | 111.5 |
| Labelling cost | 136.40 | 367.65 |
| Baiting materials | 118.37 | 99.53 |
Computation of gross margins for modern and traditional beehives
| Item | Incomes | |
|---|---|---|
| modern | traditional | |
| Average honey yield (kg/hive) | 21.93 | 15.878 |
| Average honey selling price (KES/kg) | 427.14 | 415.12 |
| Revenue (Ksh/hive) | 9 367.18 | 6 591.32 |
| Input cost | ||
| Transport | 121.52 | 104.95 |
| Family labour | 196.47 | 107.27 |
| Hired labour | 218.69 | 247.95 |
| Feeding cost | 102.85 | 66.10 |
| Pesticide | 148.52 | 53.48 |
| Servicing | 204.16 | 53.69 |
| Packaging materials | 202.29 | 111.53 |
| Labelling modern | 136.40 | 367.64 |
| Baiting materials | 118.37 | 99.53 |
| Total variable cost (KES/hive) | 1 449.44 | 1 000.73 |
| Gross margin (KES/hive) | 7 917.74 | 5 590.59 |