Fig. 1.
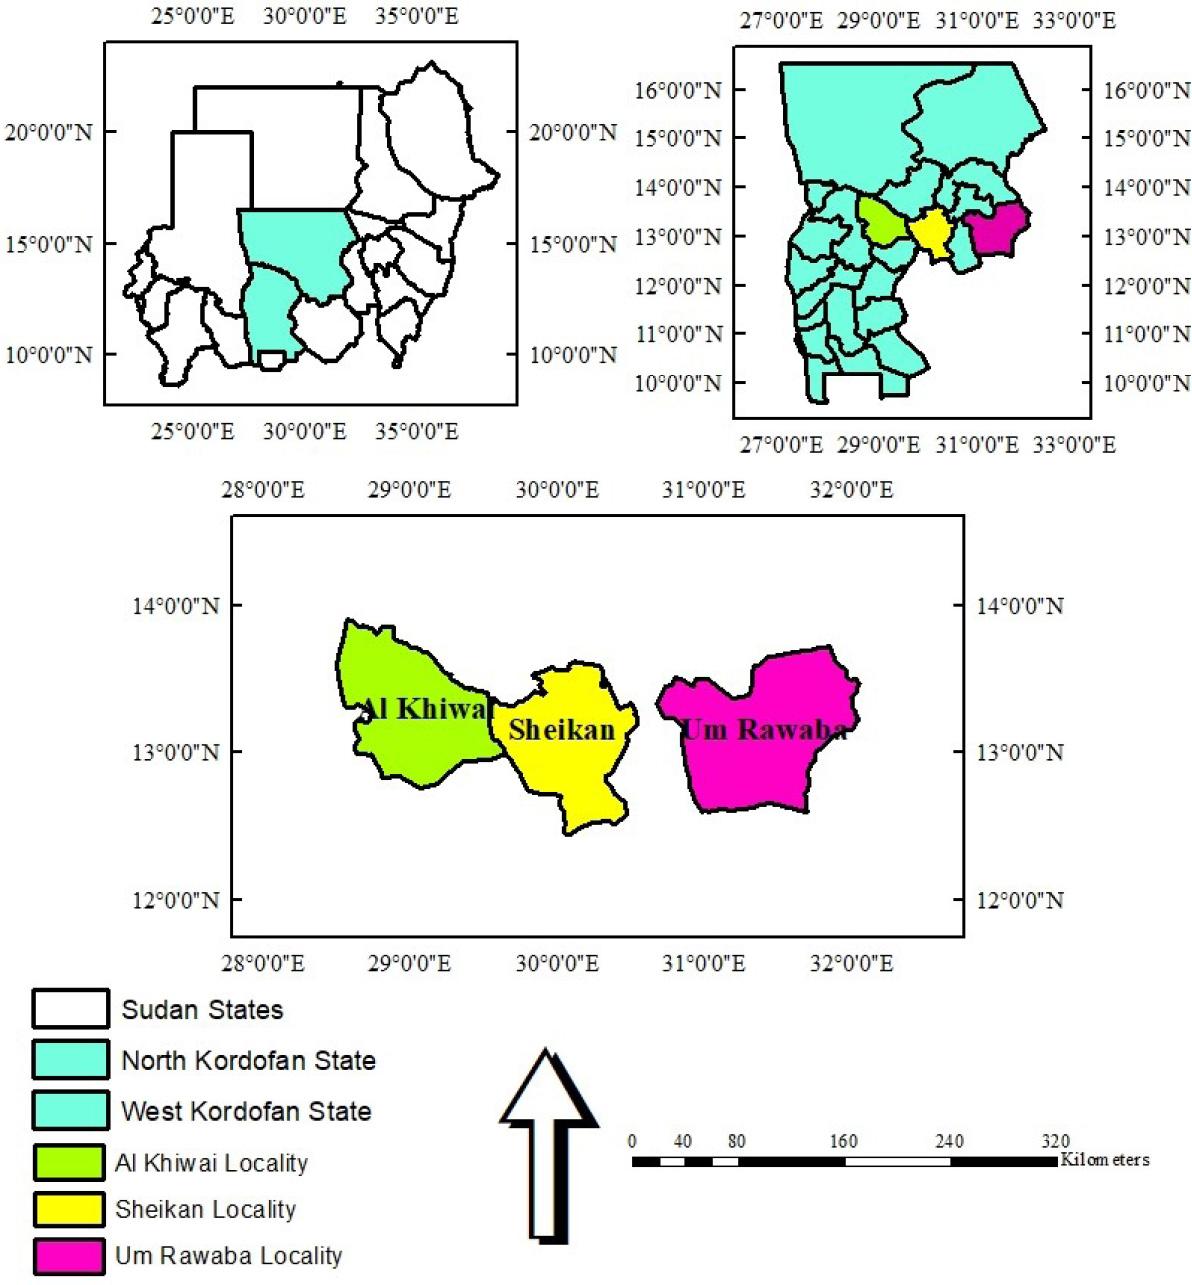
Fig. 2.
Regression analysis of labour productivity per working hour and per dollar paid on gum revenue in the study area
| Independent variables | Dependent variables | “R Square” | Adjusted R Square | Unstandardized coefficient | Sig (2-tailed) | Pearson Correlation |
|---|---|---|---|---|---|---|
| Gum revenue | LP WH | 0.995 | 0.991 | 0.998 | 0.044* | 0.998 |
| LPDP | 0.962 | 0.924 | 0.981 | 0.125 | 0.981 | |
| Gum production | LP W | 0.113 | −0.774 | 0.407 | 0.782 | 0.336 |
| LPDP | 0.006 | −0.988 | 0.038 | 0.950 | 0.078 |
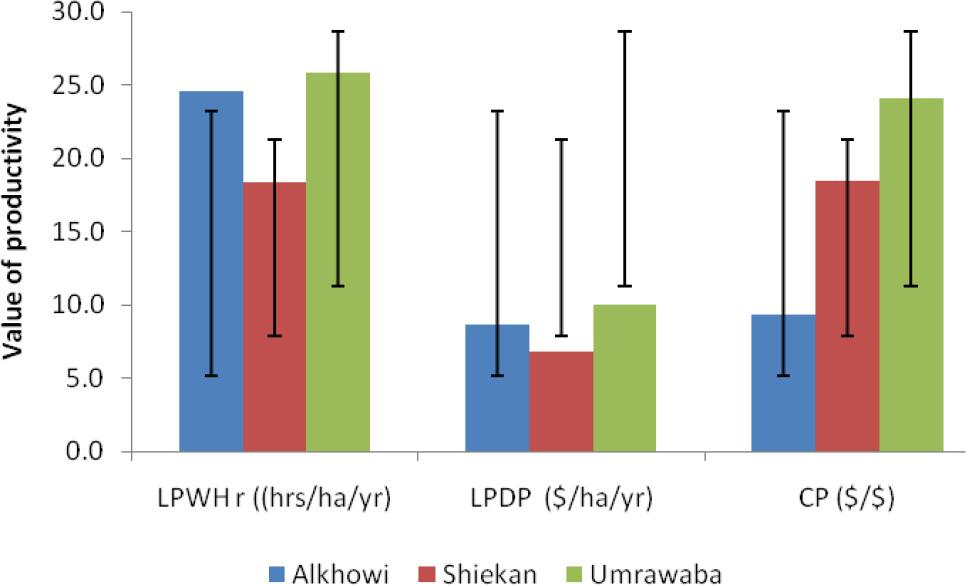
Capital productivity in the study area
| Locality | Gum revenue ($) | Working capital ($) | CP ($ / $) |
|---|---|---|---|
| Alkhowi | 319.9 | 3 287.3 | 9.3 |
| Shiekan | 198.6 | 3 073.5 | 18.5 |
| Umrawaba | 355.9 | 10 563.0 | 24.1 |
| Mean | 291.4 | 5 641.2 | 17.3 |
Labour productivity per hour (hour/ha) and per dollar ($/ha)
| Locality | Mean annual gum revenue ($/ha/yrs) | Average annual working hours (hr/ha) | LPWH (hrs/ha/yr) | Total annual labour costs ($) | LPDP ($/ha/yr) |
|---|---|---|---|---|---|
| Alkhowi | 319.9 | 13 | 24.6 | 36.6 | 8.7 |
| Shiekan | 198.6 | 10.8 | 18.4 | 29.3 | 6.8 |
| Umrawaba | 355.9 | 13.8 | 25.8 | 35.5 | 10.0 |
| Mean | 291.4 | 12.5 | 23.3 | 33.8 | 8.6 |
Regression analysis of capital productivity on gum revenue in the study area
| Independent variables | Dependent variables | “R Square” | Adjusted R Square | Unstandardized coefficient | Sig (2-tailed) | Pearson Correlation |
|---|---|---|---|---|---|---|
| Gum revenue | CP | 0.006 | −0.987 | 0.081 | 0.949 | 0.081 |
| Gum production | CP | 0.879 | 0.759 | −2.135 | 0.226 | −0.938 |