Fig. 1.
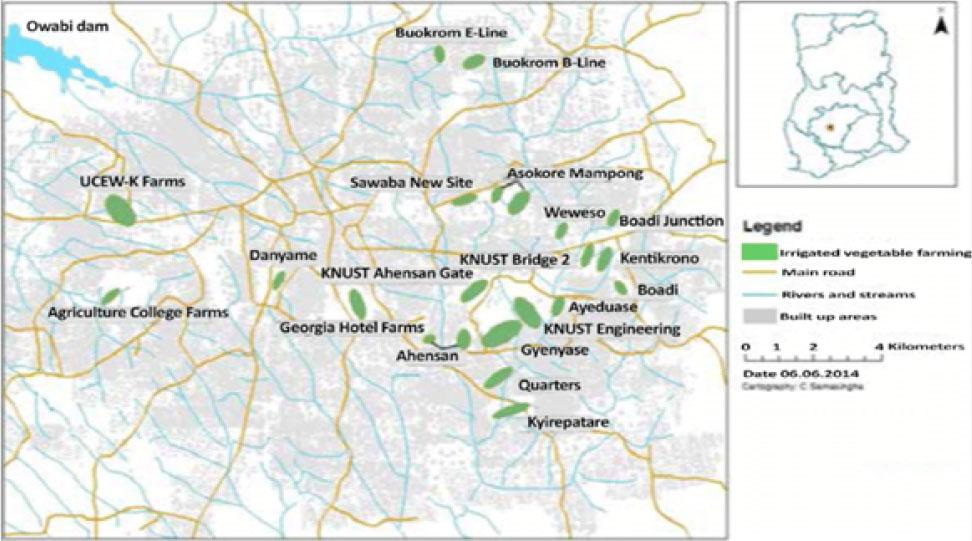
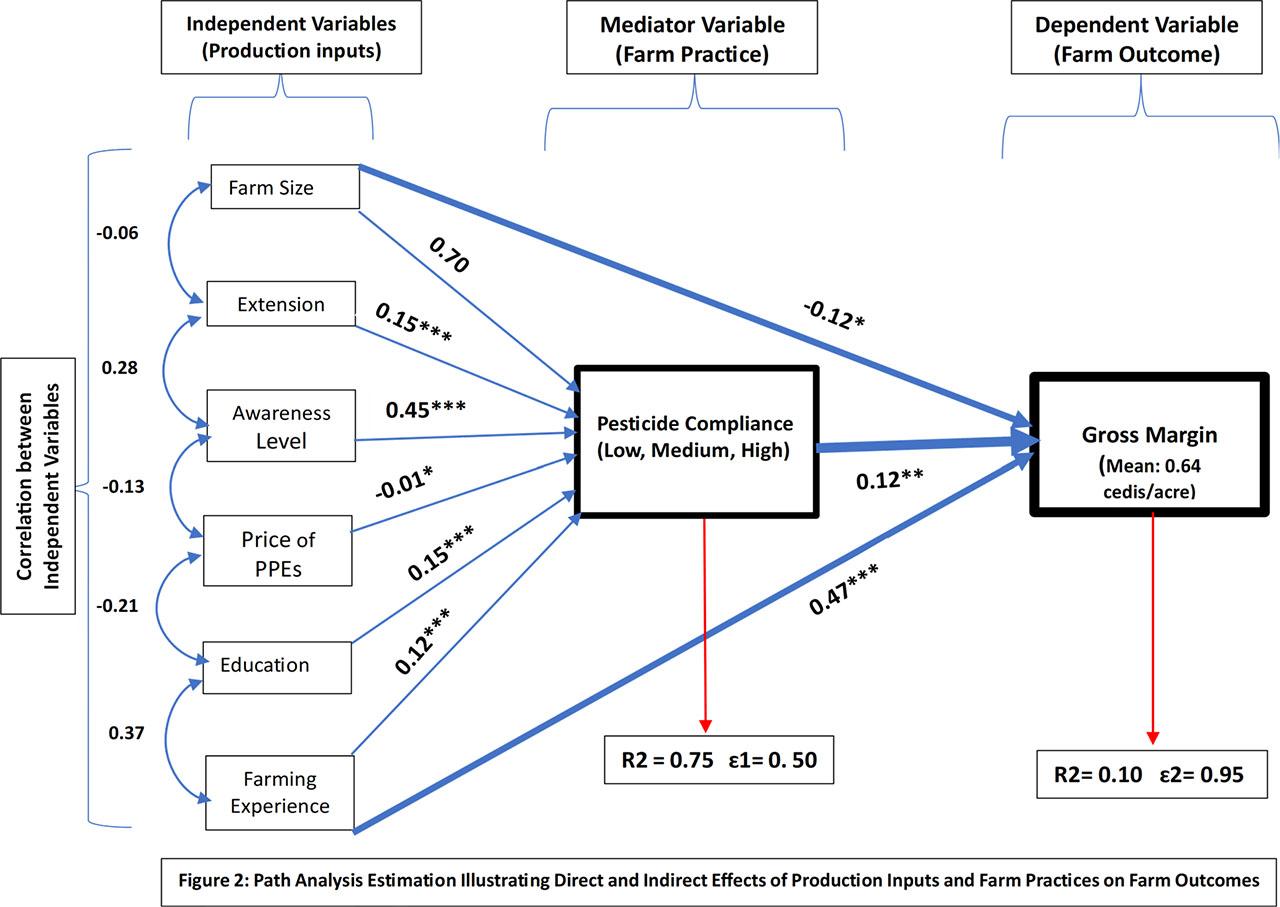
Fig. 2.
Perceived awareness of pesticide impacts on health, crop growth, and the environment
| Perception statements | Agree 1 | Neutral 0 | Disagree −1 | Index |
|---|---|---|---|---|
| Farmers health | ||||
| Improper handling or misapplication of pesticides can lead to acute poisoning among farmers | 65 (16.8%) | 56 (14.5%) | 266 (68.7%) | −0.51 |
| Direct exposure to concentrated pesticide can cause hormone disruption and certain types of cancers | 109 (28.2%) | 77 (19.9%) | 201 (51.9%) | −0.24 |
| Contact with pesticides, especially without proper protective clothing, can cause skin irritation and dermatitis among farmers | 106 (27.4%) | 81 (20.9%) | 200 (51.7%) | −0.24 |
| Inadequate respiratory protection while handling or spraying pesticides can lead to causing coughing, wheezing, shortness of breath, and in some cases, chronic respiratory conditions such as asthma | 80 (20.7%) | 62 (16.0%) | 245 (63.3%) | −0.43 |
| Improper use or mishandling of pesticides without wearing appropriate eye protection can result in eye irritation, chemical burns, corneal damage, and even vision loss | 85 (21.9%) | 63 (16.3%) | 239 (61.8%) | −0.40 |
| Perception index for farmers health | −0.36 | |||
| Crop growth and crop yield | ||||
| Pesticides misapplication may cause leaf burn, stunted growth, discoloration, or even crop death, directly impacting crop yield and quality | 72 (18.6%) | 33 (8.5%) | 282 (72.9%) | −0.54 |
| Improper timing or frequency of pesticide application can lead to reduced crop yields leading to financial losses for farmers | 90 (23.3%) | 26 (6.7%) | 271 (70.0%) | −0.47 |
| Mishandling of pesticides can result in excessive residue accumulation on crops leading to rejection or lower prices in the market | 40 (10.3%) | 15 (3.9%) | 332 (85.8%) | −0.75 |
| Overuse or misuse of pesticides can contribute to the development of pesticide resistance in target pests making it harder to control them and resulting in reduced crop yield | 75 (19.4%) | 16 (4.1%) | 296 (76.5%) | −0.57 |
| Inappropriate pesticide application, especially during flowering periods, can harm pollinators crucial for crop pollination and yield | 35 (9.0%) | 21 (5.4%) | 331 (85.5%) | −0.76 |
| Perception index for crop growth and yield | −0.62 | |||
| Environment: | ||||
| Pesticide misapplication can infiltrate into groundwater or runoff into nearby streams, rivers, and lakes, causing pollution and negatively impacting aquatic ecosystems. | 37 (9.6%) | 10 (2.6%) | 340 (87.9%) | −0.78 |
| Improper pesticide application techniques can affect soil fertility, disrupt beneficial soil microorganisms, and accumulate in the soil, posing long-term risks to agricultural productivity and the overall health of the ecosystem | 31 (8.0%) | 14 (3.6%) | 342 (88.4%) | −0.80 |
| Improper spraying techniques, such as spraying during windy can lead to pesticide drift and air pollution (Pesticide particles and vapors can travel through the air, potentially affecting nearby communities and sensitive ecosystems) | 31 (8.0%) | 7 (1.8%) | 349 (90.2%) | −0.82 |
| Misapplication of pesticides can lead to imbalances in the ecosystem, allowing pest populations to increase and requiring more intensive pesticide use to control them | 70 (18.1%) | 17 (4.4%) | 300 (77.5%) | −0.59 |
| The perception index for the environment | −0.75 | |||
| Overall perception index | −0.56 | |||
Distribution of compliance levels
| Level of compliance | Frequency | Percentages (%) |
|---|---|---|
| Low level of compliance (score: 0–4) | 254 | 65.6 |
| Medium level of compliance (score: 5–9) | 106 | 27.4 |
| High level of compliance (score: 10–15) | 27 | 7.0 |
Gross margin distribution across the compliance levels
| Compliance level | Gross margin (cedis/acre) | |||
|---|---|---|---|---|
| mean | std. dev. | frequency | ||
| Low compliance level | 0.58 | 0.32 | 254 | |
| Medium compliance level | 0.70 | 0.23 | 106 | |
| High compliance level | 0.89 | 0.10 | 27 | |
| Total | 0.64 | 0.30 | 387 | |
| Observed gross margin differentials between compliance levels (Bonferroni) | ||||
| Row mean – Column mean | Low compliance level (p-value) | Medium compliance level (p-value) | ||
| Medium compliance level | 0.12 (0.001) ** | |||
| High compliance level | 0.31 (0.000) ** | 0.18 (0.09) ** | ||
| Bartlett’s test for equal variances: chi2(2) = 14.0862 Prob>chi2 = 0.001 | ||||
Socio-demographic characteristics of farmers
| Categorical variables | Frequency | Percentage |
|---|---|---|
| Gender | ||
| Male | 314 | 81.1 |
| Female | 73 | 18.9 |
| Level of education | ||
| No education | 234 | 60.47 |
| Primary school | 92 | 23.77 |
| Junior high school | 36 | 9.30 |
| Senior high school | 25 | 6.46 |
| Literacy (read and write) | ||
| Yes | 54 | 13.95 |
| No | 333 | 86.05 |
| Membership of FBOs | ||
| Yes | 140 | 36.18 |
| No | 247 | 63.82 |
| Extension contacts | ||
| Yes | 125 | 32.30 |
| No | 262 | 67.70 |
Study area with number of farmers interviewed
| Production communities | Number of respondents | Commonly grown vegetables | Water sources | Commonly used irrigation methods |
|---|---|---|---|---|
| Gyenyase | 84 | tomatoes, onions, green pepper, chili pepper | streams, rivers and dugouts / well | watering cans, water hose, trenches |
| KNUST (Engineering & Ahensan gates) | 61 | lettuce, cabbage, carrots, green pepper, tomatoes, onion, spring onions | streams, rivers | watering cans, water hose |
| Asokore Mampong | 55 | tomato, chili pepper, garden eggs, okra | streams, rivers and dugouts / well | watering cans, water hose |
| Kentinkrono | 43 | lettuce, cabbage, carrots, and green beans, garden eggs, okra | streams, rivers and dugouts / well | watering cans, water hose, trenches |
| Danyame | 51 | tomatoes, onion, spring onions, cabbage, lettuce, pepper, spinach, garden eggs | streams, rivers and dugouts / well | watering cans, water hose, trenches |
| Buokrom (E & B lines) | 59 | tomatoes, onions, cabbage, and carrots garden eggs, okra | streams, rivers and dugouts / well | watering cans, water hose, trenches |
| Kyirepatare | 21 | tomatoes, onions, okra, garden eggs and pepper | streams, rivers and dugouts / well | watering cans, water hose |
| Boadi | 13 | tomatoes, onions, and pepper | streams, rivers | watering cans, water hose |
| Total | 387 |
Drivers of compliance with the recommended safety practices
| Compliance level (low, medium and high) | Coefficient (std. err.) | Odds ratio (std. err.) | Average marginal effects (dy/dx) | ||
|---|---|---|---|---|---|
| low compliance | medium compliance | high compliance | |||
| Awareness Level | |||||
| Medium | 5.97*** (0.77) | 392.73*** (301.52) | −0.53*** (0.05) | 0.46*** (0.05) | 0.06*** (0.01) |
| High | 4.15*** (0.96) | 63.38*** (60.68) | −0.30*** (0.09) | 0.25*** (0.09) | 0.04*** (0.01) |
| Education | |||||
| Primary | 1.39** (0.57) | 4.01** (2.31) | −0.07** (0.03) | 0.04** (0.02) | 0.02** (0.01) |
| JHS | 3.48*** (0.97) | 32.45*** (31.64) | −0.19*** (0.07) | 0.13*** (0.06) | 0.06*** (0.01) |
| SHS | 5.06*** (1.36) | 157.31*** (214.12) | −0.34*** (0.15) | 0.25*** (0.13) | 0.09*** (0.02) |
| Literacy (1 = yes) | 19.67 (2107.52) | 3.48 (7.33) | −0.66*** (0.01) | 0.56*** (0.02) | 0.11*** (0.01) |
| Extension (1 = yes) | 2.03*** (0.14) | 7.63*** (4.66) | −0.07*** (0.02) | 0.25*** (0.09) | 0.03*** (0.01) |
| Gender (1 = female) | 0.23 (0.63) | 1.26 (0.80) | −0.01 (0.02) | 0.01 (0.01) | 0.01 (0.01) |
| FBO (1 = yes) | 1.15* (0.63) | 3.15* (1.97) | −0.03* (0.01) | 0.06* (0.03) | 0.09* (0.05) |
| Gross margin (cedis) | 2.38** (1.03) | 10.79** (11.10) | −0.08** (0.03) | 0.05** (0.02) | 0.03** (0.01) |
| Farming experience (years) | 0.12*** (0.04) | 1.13*** (0.04) | −0.004*** (0.002) | 0.003*** (0.001) | 0.002*** (0.0004) |
| Farm size (acres) | 0.92 (0.99) | 2.50 (2.48) | −0.03 (0.03) | 0.02 (0.02) | 0.01 (0.01) |
| Farmer Age (years) | 0.99 (0.02) | 0.99 (0.02) | 0.0005 (0.0007) | −0.0003 (0.0005) | −0.0001 (0.0002) |
| Price of PPES (cedis) | −0.10** (0.04) | 0.91** (0.04) | 0.003** (0.001) | −0.002** (0.001) | −0.001** (0.0005) |
Distribution of compliance with the recommended safety measures on pesticide usage
| Compliance statements | Yes | No |
|---|---|---|
| I always use designated equipment for measuring and mixing pesticides | 16 | 371 |
| I only purchase pesticides that are in their original containers with the label attached | 15 | 372 |
| I always avoid spraying during windy or rainy conditions to prevent drift or runoff | 121 | 266 |
| I always mix pesticides in well-ventilated areas and avoid inhalation of fumes | 35 | 352 |
| I always spray in the direction of the wind as recommended the extension agent | 95 | 292 |
| I always wear protective footwear (boots) during spraying | 254 | 133 |
| I always wear protective goggles during spraying | 44 | 343 |
| I always wear protective clothing during spraying | 144 | 273 |
| I always wear a nose mask/respirator during spraying | 86 | 301 |
| I always wear gloves during spraying & handling pesticides | 45 | 342 |
| I always avoid eating, smoking and drinking during spraying | 23 | 364 |
| I always avoid storing pesticides near food, beverages or animal feed | 22 | 365 |
| I always store pesticides in a locked cabinet area, away from children | 14 | 370 |
| I always clean equipment and containers before and after use | 23 | 364 |
| I always wash hands and exposed skin immediately after handling pesticides | 359 | 28 |
Diversity of vegetable production per season
| Type of vegetable produced per season | Frequency | % |
|---|---|---|
| One type of vegetable per season | ||
| Spring onion | 26 | 6.72 |
| Cucumber | 1 | 0.26 |
| Chili pepper | 5 | 1.30 |
| Lettuce | 12 | 3.10 |
| Green pepper | 4 | 1.03 |
| Okra | 5 | 1.29 |
| 53 | 13.70 | |
| Two types of vegetables per season | ||
| Spring onion and lettuce | 90 | 23.26 |
| Spring onion and cabbage | 7 | 1.81 |
| Lettuce and cabbage | 5 | 1.29 |
| Spring onion and okra | 15 | 3.88 |
| Onion and lettuce | 15 | 3.88 |
| Lettuce and cauliflower | 13 | 3.36 |
| 145 | 37.47 | |
| Three types of vegetables per season | ||
| Spring onion, lettuce and cabbage | 33 | 8.53 |
| Spring onion, lettuce and okra | 20 | 5.17 |
| Spring onion, lettuce and bell pepper | 2 | 0.52 |
| Lettuce, green pepper and tomatoes | 3 | 0.78 |
| Spring onion, lettuce and cucumber | 6 | 1.55 |
| Chili pepper, tomatoes and garden eggs | 7 | 1.81 |
| Okra, tomatoes and bell pepper | 14 | 3.62 |
| Cabbage, cucumber and bell pepper | 5 | 1.29 |
| Spring onion, lettuce and cauliflower | 14 | 3.62 |
| Lettuce, cauliflower and chili pepper | 9 | 2.33 |
| 113 | 29.20 | |
| Four types of vegetables per season | ||
| Spring onion, lettuce and cauliflower and bell pepper | 20 | 5.17 |
| Spring onion, lettuce, cucumber and cabbage | 14 | 3.62 |
| Spring onion, lettuce, cabbage and garden egg | 7 | 1.81 |
| Spring onion, onion, lettuce and cucumber | 6 | 1.55 |
| Spring onion, lettuce, cabbage and radish | 2 | 0.52 |
| Spring onion, lettuce, cauliflower and cucumber | 10 | 2.58 |
| Spring onion, lettuce, cauliflower and cabbage | 13 | 3.36 |
| 72 | 18.60 | |
| Five types of vegetables per season | ||
| Spring onion, lettuce, cabbage, bell pepper and chili pepper | 4 | 1.03 |
| Total | 387 | 100 |
The most common types of pesticides used by vegetable farmers in the Ashanti Region
| Common name | Description | Active ingredient | Frequencies | Percentage |
|---|---|---|---|---|
| Dalton | Insecticide | Emamectin Benzoate | 242 | 62.53 |
| Attack | Insecticide | Emamectin benzoate | 201 | 51.94 |
| Gramoquat | Herbicide | Paraquat dichloride | 97 | 25.06 |
| Bypel | Insecticide | Perisrapae Granulosis Virus | 84 | 21.71 |
| Adwumapa | Herbicide | Glyphosate | 83 | 21.44 |
| Golan | Insecticide | Acetamiprid | 82 | 21.19 |
| Buffalo | Insecticide | Acetamiprid | 73 | 18.86 |
| Gramozone | Herbicide | Paraquat dichloride | 73 | 18.86 |
| Adwumawura | Herbicide | Glyphosate | 69 | 17.83 |
| Confidor | Insecticide | Imidacloprid | 67 | 17.31 |
| Multifos | Insecticide | Chlorpyrifos | 62 | 16.02 |
| Lambda | Insecticide | Lambda Cyhalothrin | 62 | 16.02 |
| Champion | Fungicide | Copper Hydroxide | 48 | 12.40 |
| Topsin | Fungicide | Thiophanate methyl | 47 | 12.14 |
| Furadan | Nematicide | Carbofuran | 41 | 10.59 |
| Condemn | Herbicide | Pendimethalin | 40 | 10.34 |
Relationship between awareness (knowledge & education) and compliance level
| Awareness level | Compliance level | Total | ||
|---|---|---|---|---|
| low compliance | medium compliance | high compliance | ||
| Low awareness | 232 | 7 | 0 | 239 |
| Medium awareness | 13 | 92 | 10 | 115 |
| High awareness | 9 | 7 | 17 | 33 |
| Total | 254 | 106 | 27 | 387 |
| Pearson chi2(4) = 374.9743 | Pr = 0.000 | likelihood-ratio chi2(4) = 354.7776 | Pr = 0.000 | |
| Kendall’s tau-b = 0.7960 | ASE = 0.032 | Fisher’s exact = 0.000 | ||
| Correlation between awareness and compliance level | ||||
| Correlation | Pearson coefficient | p-value | ||
| Awareness/Compliance | 0.77 | 0.000 | ||