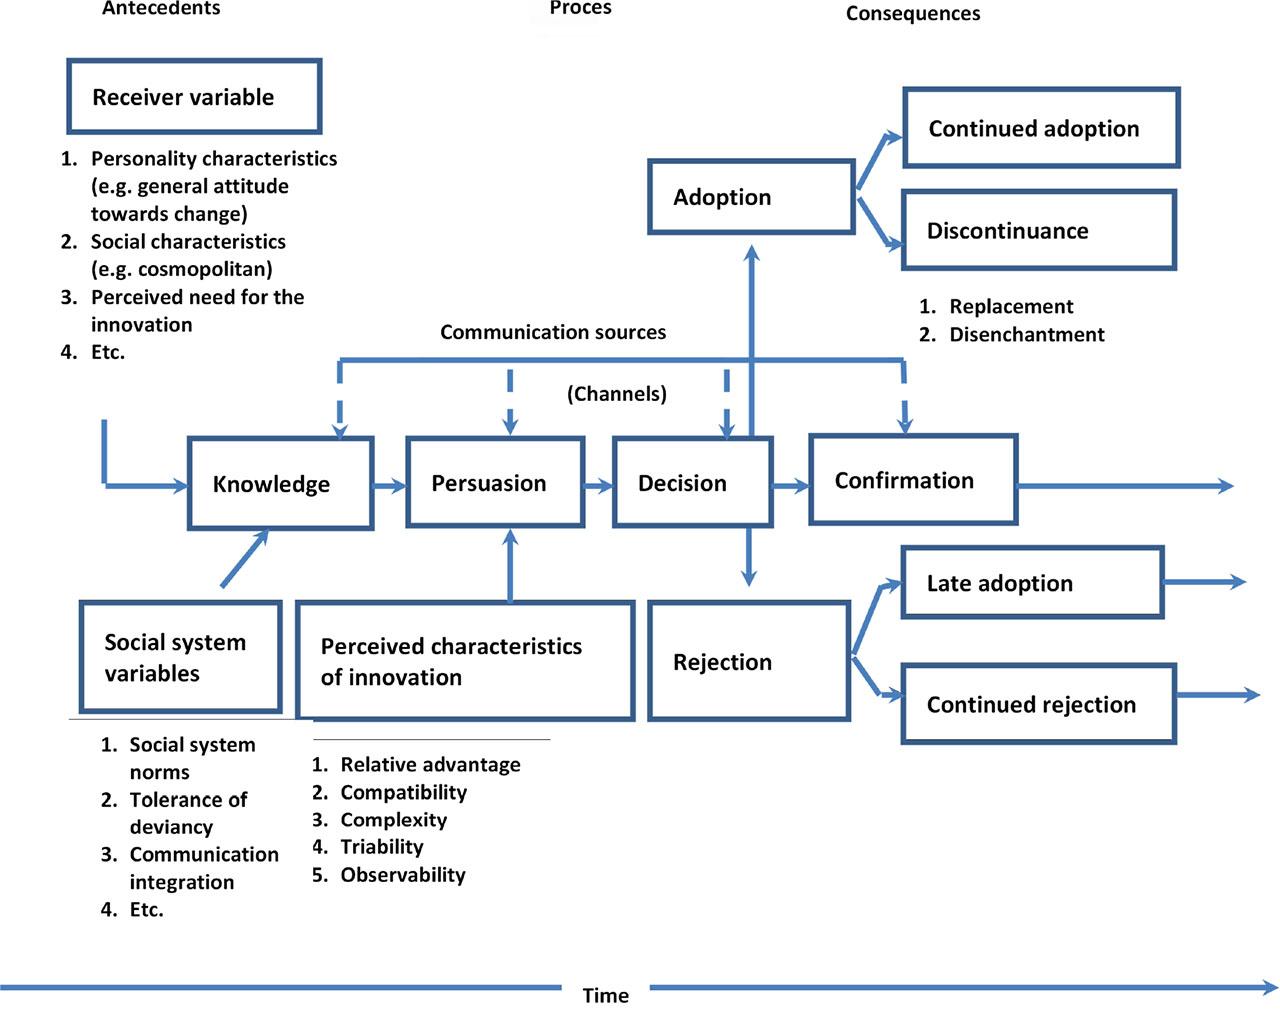
Fig. 1.

Fig. 2.
Factors affecting the adoption and utilization of digital technologies
| Construct | Factors | Author(s) |
|---|---|---|
| Demographic | Age | (Shang et al., 2021) (Michels, von Hobe and Musshoff, 2020) (Khan et al., 2022) (Groher, Heitkämper and Umstätter, 2020) (Michels et al., 2020) |
| Gender | (Drewry et al., 2019) (Groher, Heitkämper and Umstätter, 2020) | |
| Marital status | (Kaur, Walia and Singh, 2022) (Reisdorf, 2011) (Vimalkumar, Singh and Sharma, 2021) | |
| Educational levels (competences) | (Shang et al., 2021) (Drewry et al., 2019) (Carrer et al., 2022) (Khan et al., 2022) (Michels et al., 2020) (Giua, Materia and Camanzi, 2022a) | |
| Tenure | (Shang et al., 2021) | |
| Farming experience | (Shang et al., 2021) (Carrer et al., 2022) | |
| Social | Social influence | (Giua, Materia and Camanzi, 2022a) (Sood, Bhardwaj and Sharma, 2022) |
| Farm succession | (Shang et al., 2021) | |
| Economic | Employment status | (Rodriguez Castelan et al., 2021) |
| Income | (Shang et al., 2021) (Drewry et al., 2019) | |
| Source of income | (Shang et al., 2021) | |
| Farm characteristics | Enterprise | (Shang et al., 2021) |
| Farm size | (Drewry et al., 2019) (Carrer et al., 2022) (Khan et al., 2022) (Michels et al., 2020) | |
| Labour | (Shang et al., 2021) | |
| Institutional | Extension | (Musyoki et al., 2022) |
| Farmer groups | (Giua, Materia and Camanzi, 2022a) | |
| Distance to market | (Musyoki et al., 2022) | |
| Technology characteristics | Technology attributes, performance expectation, complexity | (Giua, Materia and Camanzi, 2022a) |
| (Shang et al., 2021) | ||
Descriptive statistics
| Question | Answer | % |
|---|---|---|
| 1 | 2 | 3 |
| Used any digital technologies | Yes | 55.36 |
| No | 44.64 | |
| Types digital technologies used | Digital sensors | 1.55 |
| ICT (smartphones) | 31.01 | |
| Radio | 27.91 | |
| Smartphone and radio | 39.53 | |
| Extent of digital technologies use | To some extent | 47.29 |
| Large extent | 22.48 | |
| Very large extent | 30.23 | |
| Duration of use (years) | 1–4s | 65.12 |
| 5–10 | 29.46 | |
| 11–15 | 3.88 | |
| Above 15 years | 1.55 | |
| Are digital technologies beneficial | Yes | 89.06 |
| No | 10.94 | |
| How are digital technologies beneficial | Assists in accessing farming information | 25.44 |
| Assist in seeking farming advices | 20.18 | |
| Improve communication between farmers and extension officers | 16.67 | |
| Assist in tracking market prices | 4.39 | |
| Assist farmers in looking for market to sell the produce | 5.26 | |
| Help to get information related to climate change /follow daily weather reports | 26.32 | |
| Communication between extension officers & farmers and also to look for market | 1.75 | |
| Would you continue to use digital technologies | Yes | 83.59 |
| No | 16.41 | |
| Why would you continue to use digital technologies | Helps to track market and market prices | 3.77 |
| Helps to learn about improved seeds and get educated about different cropping systems | 30.19 | |
| Helps to get climate change information | 27.36 | |
| Digital technologies improve farming skills and knowledge | 33.02 | |
| Promote better production and marketing | 5.66 | |
| Extent of willingness to continue using digital technologies | Not at all | 5.36 |
| To some extent | 25.89 | |
| Large extent | 41.07 | |
| To a very large extent | 27.68 | |
| Why would you not continue to use digital technologies | Not beneficial to farmers' need | 44.44 |
| Expensive | 11.11 | |
| Poor network coverage | 5.56 | |
| Expensive data and poor network coverage | 33.33 | |
| Expensive data bundles | 5.56 | |
| Do you recommend digital technologies | yes | 85.04 |
| No | 14.96 | |
| Reason for recommending digital technologies | Digital technologies improve and make farming activities easy and interesting | 17.39 |
| Digital technologies bridge the gap between extension officers & farmers and promote information dissemination | 25.22 | |
| Helps to access farm loans | 5.22 | |
| Provide farmers with knowledge and information about agriculture | 43.48 | |
| Not recommending it because it is expensive | 6.96 | |
| Improve farmers' marketing skills | 1.74 | |
Factors affecting the utilization of digital technologies by smallholder farmers in Port St Johns and Ingquza Hill Local Municipalities
| Variable | β | Std. Error | Pvalue | Exp(B) |
|---|---|---|---|---|
| Gender | 0.05 | 0.34 | 0.89 | 1.05 |
| Age | −0.28 | 0.16 | 0.09 | 0.76 |
| Marital status | 0.37 | 0.20 | 0.06 | 1.45 |
| Education | −0.91 | 0.25 | 0.00 | 0.40 |
| Employment status | −0.11 | 0.15 | 0.44 | 0.89 |
| Income source | −0.29 | 0.11 | 0.01 | 0.75 |
| Monthly income | −0.28 | 0.25 | 0.25 | 0.75 |
| Household size | −0.29 | 0.24 | 0.23 | 0.75 |
| Farming activity | −0.10 | 0.17 | 0.54 | 0.90 |
| Tenure | −0.49 | 0.69 | 0.48 | 0.61 |
| Land size | 1.14 | 0.30 | 0.00 | 3.13 |
| Constant | 2.41 | 1.02 | 0.02 | 11.19 |
| Model summary | ||||
| χ2 | 60.38 | 0.00 | ||
| −2 Log Likelihood | 259.94 | |||
| Nagelkerke R2 | 0.31 |
Factors affecting the extent of digital technology utilization by smallholder farmers in Port St Johns and Ingquza Hill Local Municipalities
| Variable | β | Std. Error | Pvalue | |
|---|---|---|---|---|
| 1 | 2 | 3 | 4 | 5 |
| Gender | Male | 1.37 | 0.78 | 0.08 |
| Female* | ||||
| Age | 30–39 | 6.01 | 1.83 | 0.00 |
| 40–49 | 4.98 | 1.85 | 0.01 | |
| 50–59 | 5.12 | 1.80 | 0.00 | |
| 60–69 | 6.81 | 1.69 | 0.00 | |
| 70 and above* | ||||
| Marital status | Single | −2.64 | 1.52 | 0.08 |
| Married | −2.83 | 1.54 | 0.07 | |
| Divorced | −24.33 | 0.00 | ||
| Widower/widow* | ||||
| Education | No formal education | −9.03 | 2.48 | 0.00 |
| Primary education | −2.33 | 1.36 | 0.09 | |
| Secondary education | −2.83 | 1.39 | 0.04 | |
| Tertiary education* | ||||
| Employment status | Unemployed | 12.39 | 4.98 | 0.01 |
| Formal employed | 11.04 | 5.38 | 0.04 | |
| Self-employed | 9.24 | 5.44 | 0.09 | |
| Full-time farmer | 12.16 | 5.23 | 0.02 | |
| Part-time farmer | 12.00 | 5.82 | 0.04 | |
| Retiree* | ||||
| Source of income | Social grants | −0.81 | 2.46 | 0.74 |
| Salary/wages | −2.35 | 3.56 | 0.51 | |
| Agricultural activities | −2.05 | 2.89 | 0.48 | |
| Remittances | −18.37 | 9203.61 | 1.00 | |
| Social grant and Agricultural activities | −3.72 | 2.81 | 0.19 | |
| Retirement pension funds* | ||||
| Social grant and remittances* | ||||
| Income level | R500–R1000 | −2.28 | 3.04 | 0.45 |
| R1001–R5000 | −0.91 | 2.71 | 0.74 | |
| R5001–10000 | 0.45 | 2.60 | 0.86 | |
| More than R10000a | ||||
| Household size | 1–5 people | −20.59 | 1.23 | 0.00 |
| 6–10 people | −19.35 | 1.18 | 0.00 | |
| 11–15 people | −14.35 | 0.00 | ||
| Above 15 people* | ||||
| Farming enterprise | Crop production only | 2.06 | 0.67 | 0.00 |
| Livestock production only | −0.08 | 1.31 | 0.95 | |
| Mixed farming* | ||||
| Land tenure | Communal land | −2.81 | 1.38 | 0.04 |
| Leased* | ||||
| Land size (ha) | 1–5 | −2.96 | 2.02 | 0.14 |
| 6–10 | 0.71 | 2.33 | 0.76 | |
| 11–20* | ||||
| Model summary | ||||
| χ2 | 397.95 | 0.00 | ||
| –2 Log Likelihood | 150.85 | |||
| Nagelkerke R2 | 0.68 | |||
Variables used in the logistic and ordered logistic models
| Variable | Explanation | Measurement | Expected sign |
|---|---|---|---|
| Dependent | |||
| Y (logistic regression model) | Utilization of digital technologies | Binary: 0 – utilisation, 1 – otherwise | |
| Y (ordered logistic regression model) | Extent of utilizing digital technologies | Ordered: 0 – to some extent, 1 – large extent, 2 – very large extent | |
| Independent | |||
| GEN | Gender | Nominal: 0 – male, 1 – female | − |
| AGE | Age (years) | Ordinal: 0 – 30–39, 1 – 40–49, 2 – 50–59, 3 – 60–69, 4 – 70 and above | − |
| MARST | Marital status | Nominal: 0 – married, 1 – not married | − |
| EDU | Education level | Ordinal: 0 – none, 1 – primary, 2 – secondary, 3 – tertiary | + |
| EMPL | Employment status | Nominal: 0 – full-time farmer, 1 – part-time farmer | − |
| SOUINC | Source of income | Categorial: 0 – social grant, 1 – salary, 2 – agricultural activities, 4 – remittances | +/− |
| MI | Monthly income | Ordinal: 0 – less than R1000, 2 – R1001–R5000, 3 – R5001–R10000, 4 – more than R10000 | + |
| HHS | Household size | Ordinal: 0 – 1–5, 1 – 6–10, 2 – 11–15, 3 – 15 and above | +/− |
| FEN | Farming enterprise | 0 – crop production, 1 – livestock production, 2 – mixed farming | +/− |
| TEN | Tenure | Nominal: 0 – communal, 1 – leased | + |
| FZ | Farm size (ha) | Ordinal: 0 – 1–5, 1 – 6–10, 2 – 11–20 | + |