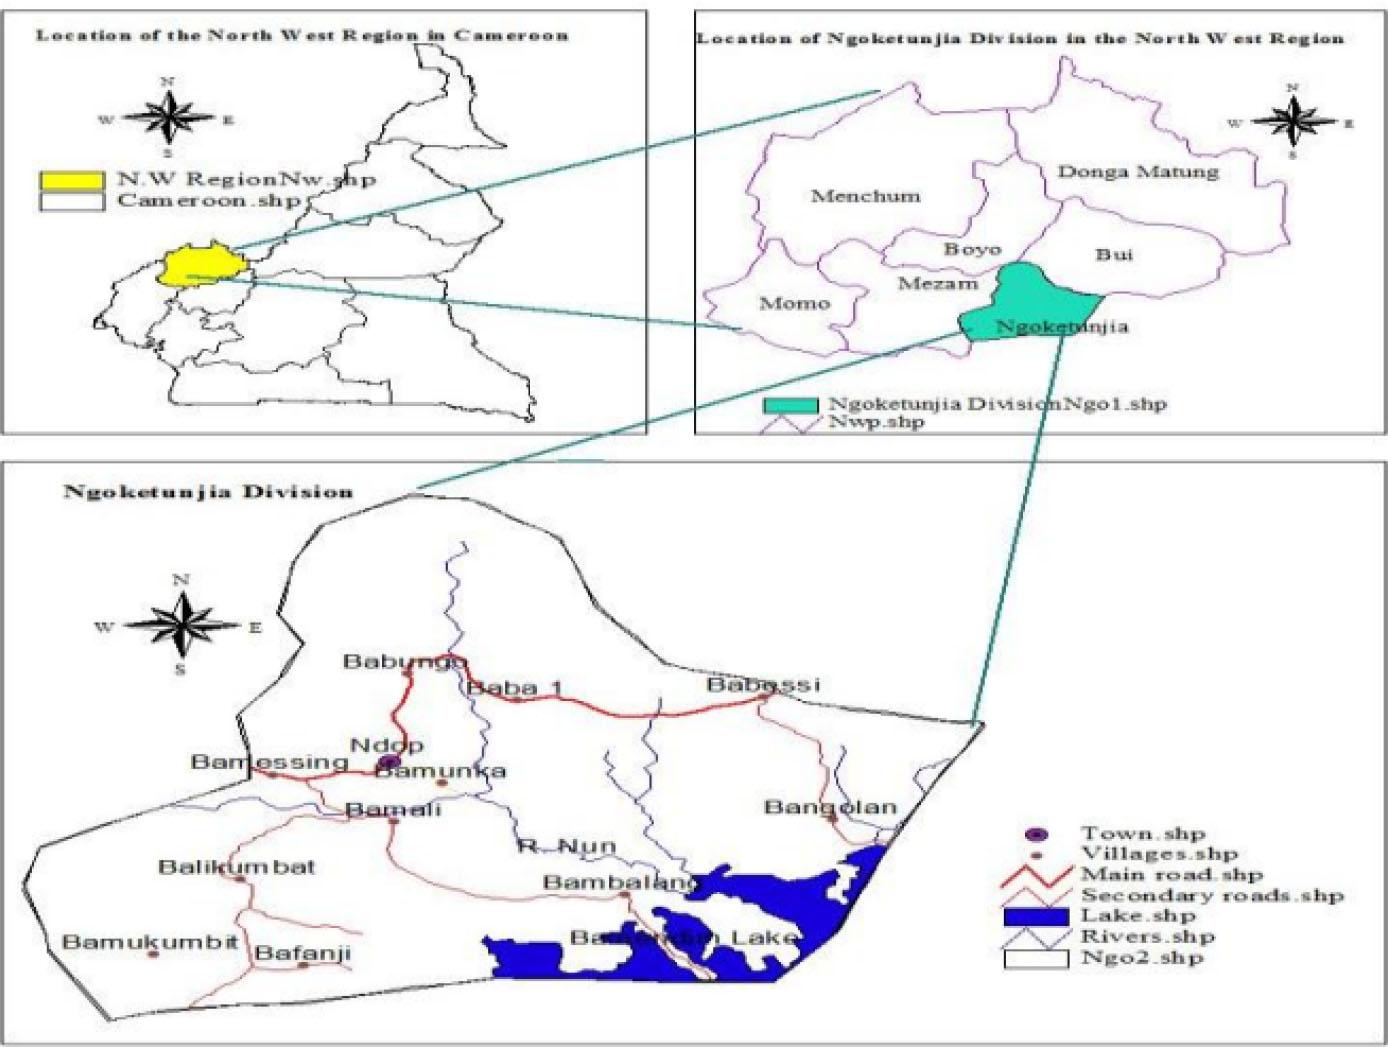
Fig. 1.
Respondents’ age, years of experience and family size
| Role(s) in the rice value chain | Age | Years of experience | Family size | |
|---|---|---|---|---|
| Farmers | Min. | 17 | 3 | 1 |
| Max. | 74 | 55 | 12 | |
| Mean | 48.70 | 23.68 | 4.56 | |
| N | 580 | 580 | 580 | |
| Std. Deviation | 15.01 | 9.66 | 1.52 | |
| Millers | Min. | 28 | 8 | 3 |
| Max. | 78 | 33 | 7 | |
| Mean | 52.55 | 19.73 | 4.60 | |
| N | 40 | 40 | 40 | |
| Std. Deviation | 13.63 | 6.07 | 1.26 | |
| Wholesalers | Min. | 17 | 9 | 2 |
| Max. | 78 | 34 | 7 | |
| Mean | 48.86 | 20.55 | 4.93 | |
| N | 134 | 134 | 134 | |
| Std. Deviation | 12.77 | 5.59 | 1.39 | |
| Retailers | Min | 18 | 9 | 2 |
| Max. | 66 | 32 | 7 | |
| Mean | 46.91 | 18.30 | 4.79 | |
| N | 46 | 46 | 46 | |
| Std. Deviation | 12.27 | 5.15 | 1.21 | |
Profit per kilogram of paddy produced
| Cost item | Farmers | Millers | Wholesalers | Retailers |
|---|---|---|---|---|
| Amount in FCFA | ||||
| Land preparation | 3,700.00 | – | – | – |
| Planting | 1,500.00 | – | – | – |
| Weed control | 500.00 | – | – | – |
| Harvesting | 2,000.00 | – | – | – |
| Transport | 1,000.00 | 500.00 | 200.00 | 120.00 |
| Input | 4,700.00 | 20.00 | 15.00 | 10.00 |
| Purchasing cost of rice | – | 15,000.00 | 16,000.00 | 17,500.00 |
| Warehouse/storage | 10.00 | 50.00 | 150.00 | 40.00 |
| Electric bills | 10.00 | 340.00 | 70.00 | 15.00 |
| Repairs/maintenance | 15.00 | 60.00 | 5.00 | 5.00 |
| Labour | 5.00 | 30.00 | 25.00 | 25.00 |
| Phone calls | 55.00 | 50.00 | 20.00 | 15.00 |
| Other cost (packages, loading. losses etc.) | 380.00 | 30.00 | 10.00 | 5.00 |
| Subtotal variable cost (TVC) | 14,035.00 | 16,080.00 | 16,495.00 | 17,735.00 |
| Total variable cost/kg | 116.96 | 229.71 | 329.90 | 354.70 |
| Farm development due | 100.00 | – | – | – |
| Taxes/market levies | 80.00 | 70.00 | 100.00 | 80.00 |
| Depreciation | 550.00 | 705.00 | 230.00 | 130.00 |
| Subtotal fixed cost (TFC) | 650.00 | 775.00 | 330.00 | 210.00 |
| Total fixed cost/kg | 5.42 | 11.07 | 6.60 | 4.20 |
| Total cost/per plot or/bag (TC=TFC+TVC) | 14,685.00 | 16,855.00 | 16,825.00 | 17,945.00 |
| Total cost/per kg | 122.38 | 240.79 | 336.50 | 358.90 |
| Yield from the purchase cost | 120.00 | 70.00 | 50.00 | 50.00 |
| Selling price/kg | 150.00 | 320.00 | 350.00 | 370.00 |
| Cost per kg | 122.38 | 240.79 | 336.50 | 358.90 |
| Gross income/kg | 33.04 | 90.29 | 20.10 | 15.30 |
| Profit per kg | 27.63 | 79.21 | 13.50 | 11.10 |
| Added value (Price received by actor – Price paid by actor) | 150.00 | 170.00 | 30.00 | 20.00 |
| Gross margin (Gross income × 100 / Total Revenue) | 22.03 | 28.21 | 5.74 | 4.14 |
| Value share (Added value × 100 / Final retail price) | 40.54 | 45.95 | 8.11 | 5.41 |
| CBA (Total revenue/Total cost) | 1.23 | 1.33 | 1.04 | 1.03 |
Sex and actor group membership
| Variable | Category | Your role(s) in the rice value chain | Total | ||||||||
|---|---|---|---|---|---|---|---|---|---|---|---|
| Farmers | Millers | Wholesalers | Retailers | ||||||||
| Freq. | % | Freq. | % | Freq. | % | Freq. | % | Freq | % | ||
| Sex | Male | 222 | 38.3 | 30 | 75.0 | 89 | 66.4 | 19 | 41.3 | 360 | 45.0 |
| Female | 358 | 61.7 | 10 | 25.0 | 45 | 33.6 | 27 | 58.7 | 440 | 55.0 | |
| Total | 580 | 100.0 | 40 | 100.0 | 134 | 100.0 | 46 | 100.0 | 800 | 100.0 | |
| Group membership | No | 474 | 81.7 | 35 | 87.5 | 125 | 93.3 | 46 | 100.0 | 680 | 85.0 |
| Yes | 106 | 18.3 | 5 | 12.5 | 9 | 6.7 | 0 | 0 | 120 | 15.0 | |
| Total | 580 | 100.0 | 40 | 100.0 | 134 | 100.0 | 46 | 100.0 | 800 | 100.0 | |
Other socioeconomic characteristics (farm size, yield and income)
| Your role(s) in the rice value chain | Farm size | Total yield (kg) in 2020 | Total rice (kg) in 2020 | Income | |
|---|---|---|---|---|---|
| Farmers | Mean | 0.2595 | 1 806.00 | 1 806.0 | 276 908.5 |
| N | 580 | 580 | 580 | 580 | |
| Std. Deviation | 0.10963 | 860.80 | 1 043.0 | 171 598.4 | |
| Minimum | 0.07 | 4 | 4 | 60 000 | |
| Maximum | 0.61 | 52 | 145 | 2 682 500 | |
| Millers | Mean | 0.2578 | 2 027.00 | 9 995.0 | 1 649 175 |
| N | 40 | 40 | 40 | 40 | |
| Std. Deviation | 0.13096 | 1 055.87 | 5 048.38 | 832 982.5 | |
| Minimum | 0.15 | 600 | 5 000 | 825 000 | |
| Maximum | 0.53 | 4 100 | 25 000 | 4 125 000 | |
| Wholesalers | Mean | 0.247 | 1 814.90 | 33 884.0 | 5 674 600 |
| N | 134 | 134 | 134 | 134 | |
| Std. Deviation | 0.16347 | 1 201.78 | 16 518.15 | 2 688 919 | |
| Minimum | 0.16 | 600 | 10 000 | 1 700 000 | |
| Maximum | 0.53 | 4 200 | 80 000 | 13 600 000 | |
| Retailers | Mean | NA | NA | 8 608.51 | 1 583 000 |
| N | 46 | 46 | 46 | 46 | |
| Std. Deviation | NA | NA | 3 253.75 | 581 034.8 | |
| Minimum | NA | NA | 5 000 | 925 000 | |
| Maximum | NA | NA | 18 000 | 3 150 000 | |