South Africa's urban population has been growing at a faster rate in the past decades, according to the literature (Arndt et al., 2019). This is reflected in South Africa, as presently (2023) over 60% of South Africa's population reside in urban areas (O'Neill, 2024). The high migration from rural areas to urban areas is mainly driven by the desire for better economic opportunities (Arndt et al., 2019) and improved livelihoods (Alarima, 2018). However, South Africa's economic growth has been slow (Arndt et al., 2019; OECD, 2020) and thus unable to absorb this pressure (Arndt et al., 2019). As a result, the overall unemployment rate is currently standing at 33.9%, while that of young people is estimated to be around 46.5% (Statistics SA, 2022), suggesting that urban dwellers might be struggling to meet their basic needs.
In addition, food prices have been rising globally, resulting in approximately 3 billion people experiencing difficulty with affording food (FAO et al., 2022). South Africa is no exception to this phenomenon, as recent reports have revealed that the cost of the food basket has risen by 13.9% in 2022, with the increases even registered in basic foodstuffs such as bread, milk and maize meal (Business Tech, 2022). Generally, the urban population heavily relies on markets to access food (Nenguda and Scholes, 2022). The heavy reliance on markets in this sector has been attributed to low agricultural production from the urban population (Oguttu et al., 2021). Therefore, the increase in food prices compounded with the high unemployment rate is likely to have a negative impact on the ability of these populations to meet their food security needs.
Previously in South Africa, food insecurity had been viewed as the problem of rural areas (Battersby and Haysom, 2019), resulting in food security policies that are biased towards the rural context (Battersby and Haysom, 2019; Nenguda and Scholes, 2022). However, as new evidence comes to light, it is becoming evident that food insecurity is dire amongst urban dwellers (Battersby and Haysom, 2019; Statistics South Africa, 2019, Nenguda and Scholes, 2022). For example, according to Statistics South Africa (2019), more than 60% of households in urban areas were vulnerable to hunger. Furthermore, in a study conducted by Nenguda and Scholes (2022) in Tembisa Township, Gauteng Province, 76% of households surveyed were food-insecure. The majority of these urban food insecure households are found in peri-urban areas (Battersby and Haysom, 2019).
It is against this background that several researchers have called for home gardening in urban areas as one of the mitigating strategies (Modibedi et al., 2021; Thomas and Terblanche, 2021; Lal, 2020). Apart from being an important source of food for vulnerable households (Nenguda and Scholes, 2022), food gardens are seen as strengthening local food systems and thus bringing about some degree of food sovereignty (Lal, 2020). The importance of building sustainable local food systems has become even more apparent when considering the food supply disruptions that are usually brought by food crises events such as the outbreak of COVID-19 (Lal, 2020).
Several food gardening projects have been initiated and funded through various government projects (Sambo et al., 2022; Modibedi et al., 2021). However, evidence of the use of agriculture as a livelihood strategy by urban population is scanty (Nenguda and Scholes, 2022; Khumalo and Sibanda, 2019). A study conducted by Oguttu et al. (2021) in Gauteng revealed that participation in food gardening was low, with less than 20% of the total sample involved in this activity. This was confirmed by a study by Nengunda and Scholes (2022), where the poor participation of urban dwellers in gardening was attributed to the age of respondents. However, although Statistics South Africa (2019) showed the overall low involvement of households in agricultural activities, KwaZulu Natal Province had the highest number of households involved in these activities. Other peri-urban studies on food gardening applied non-probability sampling techniques (Modibedi et al., 2021; Khumalo and Sibanda, 2019; Mcata, 2019), making it difficult to estimate the adoption of food gardening by urban dwellers.
Furthermore, reasons to participate in food gardening and factors that determine their participation are not fully understood (Tesfamariam et al., 2018), especially in peri-urban areas, thus limiting the ability of policy makers to make informed decisions. There is therefore an urgent need to fill this knowledge gap. Past studies on factors determining households' participation in food gardening were either conducted in rural areas (Tesfamariam et al., 2018) or involved secondary data, which somewhat limited the number of variables that were collected (Oguttu et al., 2021). Mcata (2019), on the other hand, conducted a study in urban areas, using small sample size. It is for that reason that scholars such as Tesfamariam et al. (2018) argue that evidence from other provinces is necessary to ascertain the role played by food gardens and to develop a holistic approach.
Hence, the objective of this study is to assess the participation of respondents in food gardens and determine the socio-demographic factors that associated with food gardening in Ray Nkonyeni Local Municipality.
The study was conducted in Ray Nkonyeni Local Municipality (RNLM), KwaZulu-Natal Province, South Africa. RNLM falls under Ugu District Municipality and is located in the south coastal area of KwaZulu-Natal. The municipality seat is Port Shepstone. The municipality covers 1594 square kilometres and consists of 36 wards. RNLM is characterised by both rural and urban areas, with the coastal belt of this municipality being fully developed. This is also the economic hub, while the interior is less developed. RNLM population is estimated at approximately 392,405 and mainly consists of Africans. According to reports, there has been a steady increase in the population of this area due to economic reasons. Port Shepstone is located 120 km from Durban, which is one of the 7 metropolitan cities in South Africa. RNLM is characterised by high levels of unemployment and poverty. The Integrated Development Plan (IDP) of this municipality further states that agricultural sector contributes about 8.9% to the economy of this municipality (RNLM, 2022). This area was selected for this study to assess the level of adoption of food gardening, as food gardens are regarded as one of the multiple strategies available to combat poverty amongst vulnerable communities.
The study adopted a quantitative, cross-sectional research design. Ethics clearance for the study was granted by UNISA's College of Agriculture Ethics Committee (2019/CAES/047). Four peri-urban areas from RNLM were selected as study sites, namely, Izingolweni, Murchison, Fairview and Louisiana. RNLM consists of 7584 households (Statistics SA, 2011). Using the accepted formula by Krejie and Morgan (1970), a sample size of 364 respondents was determined. A total of 360 households agreed to participate in the study. Due to the absence of a sampling frame, systematic random sampling was used to select the respondents of this study. All the households in the selected residential areas formed part of the sampling frame. The street listings were used to draw a random list of streets, after which we sampled every 5th household in the study area that was chosen to be part of the study. In the event that a household chosen to participate was not found at home, two more visits were arranged before moving to the next one by using the 5-fixed-interval principle. This principle was informed by the average number of households in each street. Each street had approximately 50 households.
Table 1 below represents the distribution of the respondents in terms of the 4 peri-urban areas.
The distribution of respondents
| Area | Sample |
|---|---|
| I – Izingolweni | 136 |
| M – Murchison | 112 |
| L – Lousiana | 56 |
| F – Fairview | 56 |
| Total | 360 |
Source: own elaboration.
A structured questionnaire was designed in English and later translated to isiZulu, which is the local language. The survey was administered face-to-face at the respondents' homes. The inclusion criteria included all households that lived in the area and were available to participate in the study. Variables such as race, gender, age, marital status, level of education, access to land and experience in the household head in agriculture were self-reported, while household structure and participating in food gardening were assessed by observation. The presence of an active garden in the dwelling was regarded as participation in food gardening.
A logistic regression model was used to identify the factors that were significantly correlated with family practice food gardening. Since the dependent variable (family practice food gardening) is dichotomous (0 = Yes and 1 = No), the binary logistic regression model was employed. The equation of the binary logistic regression model is as follows:
ℓ – is the log-odds; b – is the base of the logarithm; and βi – are parameters of the model. The above formula shows that once βi is fixed, we can compute the log odds that Y =1 for a given observation. Therefore, the logistic regression enables us to compute the probability p that Y = 1 given a set of observations (X1, X2 … Xi).
The model building process included performing univariate analysis to identify independent variables significantly associated with the dependent variable at a cut-off point of p ≤ 0.20. Later, a binary logistic regression model was fitted using the manual backward selection method, employing all the variables that are significantly associated with the dependent variable in the univariate analysis.
Confounders were tested in the model by assessing the measure of association before and after adjusting for a potential confounding variable. A particular variable is confirmed as a confounder when the estimated measure of association varies by more than 10%. All confounding variables (age of the household head, numbers of employed household members and dwelling type) were kept in the model.
Multicollinearity was assessed by calculating the Variance Inflation Factor (VIF) and tolerance values. All the independent variables had VIFs of less than 3 and tolerance values greater than 0.20. These confirmed that there was multicollinearity was not a problem.
The Omnibus test was conducted to evaluate the model's goodness of fit. It was evident from the likelihood ratio chi-square tests that the model with the predictors fits the data more appropriately than the null model [x2(23) = 222.74; p = 0.00]. In addition, the Hosmer-Lemeshow (HL) test was performed to assess the goodness of fit of the model, and the results showed that the model fitted the data well [x2(8) = 13.89; p = 0.09]. Statistical significance was assessed at α = 0.05.
Socio-demographic characteristics of the respondents are presented in Table 2. Most household heads were Africans, females, above 50 years of age, single and without college education. The dominance of females in this study collaborates the literature (Statistics South Africa, 2022; RNLM, 2022), which reported that in South Africa there are more females that males. Similar observations were also made by Khumalo and Sibanda (2019), who found more females than males in a study that was conducted in Tongaat, eThekwini Municipality, South Africa. The fact that in this study there were more respondents that are aged 50 and above is contrary to the municipality trend, which indicates that the highest population in this area is between 14–35 years (RNLM, 2022). The low participation of younger people in agricultural activities has been attributed to a lack of interest and low incomes in this sector (Thomas and Terblanche, 2021). Generally, women are associated with low incomes, which then translates into poor socioeconomic status. Therefore, their high representation in food gardening could mean that they want to augment their household food access, as it is the norm for people with low socio-economic status to resort to gardening (Oguttu et al., 2021).
Socio-demographic characteristics
| Characteristics | Frequency (n = 360) | Percent |
|---|---|---|
| Race | ||
| African | 357 | 99.2 |
| Colored | 3 | 0.8 |
| Gender of the HH | ||
| Male | 111 | 30.8 |
| Female | 249 | 69.2 |
| Age | ||
| 18–30 | 18 | 5.0 |
| 31–40 | 58 | 16.1 |
| 41–50 | 80 | 22.2 |
| 51–60 | 97 | 26.9 |
| 61–70 | 76 | 21.1 |
| 71–80 | 24 | 6.7 |
| over 80 | 7 | 1.9 |
| Marital status of the HH | ||
| Single | 196 | 54.4 |
| Married | 98 | 27.2 |
| Divorced | 31 | 8.6 |
| Widow | 23 | 6.4 |
| Cohabiting | 12 | 3.3 |
| Level of formal education of the HH | ||
| No education | 30 | 8.3 |
| Primary school | 86 | 23.9 |
| High school | 201 | 55.8 |
| Tertiary | 43 | 11.9 |
| Household structure | ||
| Formal (own) | 322 | 89.5 |
| Informal (own) | 12 | 3.3 |
| Renting | 26 | 7.2 |
| No of household members | ||
| 1–3 | 101 | 28.1 |
| 4–6 | 181 | 50.3 |
| 7–9 | 74 | 20.6 |
| > 9 | 4 | 1.1 |
| Access to land | ||
| Yes | 303 | 84.2 |
| No | 57 | 15.8 |
| Experience of the HH in agriculture | ||
| Yes | 291 | 80.8 |
| No | 69 | 19.2 |
Source: own elaboration.
As shown in Table 2, the majority of respondents in this study were residing in formal structures, while a larger proportion of the households had 4 or more members. These findings are in line with what was reported in the 2020 General Household Survey, namely, that over 80% of the population in KwaZulu-Natal lives in formal structurers (STATSSA, 2021).
The majority of the households (84.2%) had access to land, which is a determining factor in gardening (Nontu, 2021; Khumalo and Sibanda, 2019; David and Grobler, 2022). Previous studies indicate that households that do not have access to land tend to shy away from gardening, and as such in a study that was conducted by Khumalo and Sibanda (2019), when comparing urban and peri-urban agriculture participants and non-peri urban agriculture participant's demographics, it was found that the majority of non-participants had limited access to land. While land can be rented, this could be a challenge for low-socio economic households, as the ones described in this study.
A positive finding in this study is that the majority of the respondents had experience in agriculture (80.8%). This was considered an important variable for two reasons. Mcata (2019) argues that due to familiarity with farming practices, farming experience has a positive influence on engaging in gardening as livelihood strategy. The significance of agricultural experience was further confirmed by Oguttu et al. (2021) that people who had rural origins had high odds of participating in agriculture due to the gardening experience they possess. For example, in a study by Mdiya and Mdoda (2021), participating households had 10 years' experience in agriculture. This could explain why most studies have shown food gardening as mainly dominated by older people (Mcata, 2019; Oguttu et al., 2021), because they usually have more gardening experience than the younger generation.
The economic characteristics of the respondents varied and are presented in Table 3. Most respondents were either unemployed (47.8%) or in part-time employment (20.0%). The majority of respondents (67.2%) reported that there are between 1–2 household members who are employed. The percentage distribution of total income shows that over half were earning R3000.00 (three thousand Rands) and below, while the majority (68.9 %) were dependent on one source of income. Considering the cost of living and average price for a food basket, these incomes are significantly low and indicate that most households might be struggling to meet their food demands. According to Pietermaritzburg Economic Justice & Dignity (PMBEJD), the average cost of a household food basket in 2021 was approximately ZAR 4051,20 (PMBEJD, 2021). The prices are likely to be higher in 2023, as food prices continue to soar.
Socio-economic characteristics of the respondents
| Characteristics | Frequency (n = 360) | Percent |
|---|---|---|
| Employment status of the HH | ||
| Unemployed | 172 | 47.8 |
| Employed Part-time | 72 | 20.0 |
| Employed Full-time | 116 | 32.2 |
| No. of employed hh members | ||
| No members | 83 | 23.1 |
| 1–2 | 242 | 67.2 |
| 3–4 | 28 | 7.8 |
| 5–6 | 6 | 1.7 |
| > 6 | 1 | 3 |
| Total monthly income | ||
| > R1000 | 23 | 6.4 |
| R1000–R2000 | 92 | 25.6 |
| R2001–R3000 | 106 | 29.4 |
| R3001–R4000 | 68 | 18.9 |
| R4001–R5000 | 35 | 9.7 |
| Over R5000 | 35 | 10.0 |
| Total no. of sources of household income | ||
| 1 source of income | 248 | 68.9 |
| 2 sources of income | 96 | 26.7 |
| 3 sources of income | 16 | 4.4 |
| Sources of income | ||
| Wages | 252 | 70.0 |
| Pension | 86 | 23.9 |
| Family business | 8 | 2.2 |
| Informal income | 15 | 4.2 |
| Social welfare grants | 123 | 34.2 |
Source: own elaboration.
Taking into account that there were households with more than one source of income, the numbers on the sources of income were above 100%. Most households (68.9%) in this study had one source of income. The main source of income (70%) was wages, followed by social grants (34.2%). Having more than one source of income helps in increasing the amount of disposable income. However, there were fewer households with more than one source of income and their impact was not significant. The majority of respondents' source of income in this study was wages, and as indicated above these were significantly low. This could be attributed to the high unemployment rate in South Africa and low education levels of the respondents in this study. Taking into consideration that the majority of households in this study had high school education or lower, the literature indicates that although high school education in South Africa may be sufficient to understand agricultural information (Mdiya and Mdoda, 2021), it is not enough to secure lucrative jobs (Tesfamariam et al., 2018). Therefore, participating in gardening is significant for this community, as it can help to supplement the reported low incomes by reducing reliance on markets.
The majority of respondents (72.5%) in this study owned food gardens. With regard to the type of gardens, home gardens were more prevalent (84.7%) than community gardens (Table 4). This confirms the findings of Roberts and Shackleton (2018), who noted the declining number of urban community gardens in a study conducted in the Eastern Cape, South Africa. In terms of the reasons for participating in food gardening, the results show that a larger segment was participating in food gardens for household consumption with only a few respondents participating to generate income. Household consumption as the primary reason for gardening is well documented in the literature (Maponya et al., 2021; Phulkerd et al., 2020; Roberts and Shackleton, 2018). This is attributed to the fact that as vulnerable households struggle to meet their household food demands, they resort to gardening as a mitigating strategy (Roberts and Shackleton, 2018; Mdiya and Mdoda, 2021). The literature indicates that households only consider selling when there is a surplus (Mdiya and Mdoda, 2021), therefore this also suggests that households are not producing enough, which is why selling comes after providing for the household members.
Participation of respondents on food gardening
| Characteristics | Frequency (n = 360) | Percent |
|---|---|---|
| Participation in food gardening | ||
| Not participating | 99 | 27.5 |
| Participating | 261 | 72.5 |
| Type of garden | 116 | 32.2 |
| Home garden | 221 | 84.7 |
| Community garden | 40 | 15.3 |
| Reason for gardening | ||
| Own consumption | 238 | 91.2 |
| Income generation | 39 | 6.1 |
| Improve health and nutrition | 16 | 14.9 |
| Number of active hh members | ||
| 1–3 | 242 | 93.1 |
| 4–6 | 15 | 5.7 |
| 7–9 | 2 | 0.8 |
| > 9 | 1 | 0.4 |
| Source of irrigation | ||
| Taps | 190 | 72.8 |
| Rainwater tanks | 104 | 39.8 |
| Dam | 52 | 19.9 |
| Borehole | 1 | 0.4 |
| Spring | 1 | 0.4 |
| No irrigation | 3 | 1.1 |
Source: own elaboration.
With reference to maintaining the garden, most respondents in this study indicated that the number of active members ranged from 1 to 3 household members. This supports the view that labour for food gardening is mainly provided by household members. With regard to this, Balasha et al. (2019) concluded in their study conducted in Lubumbashi, Congo that the responsibility of maintaining gardens largely rests on women, with a small contribution from men and children. As indicated earlier, the reason for this could be the fact that men are often away pursuing other income-generating activities, while children attend school.
The main source of irrigation for most respondents was running water from taps (72.8%). Access to water plays a major role in household food production because rainfall is unreliable (Sida, 2019), therefore the fact that the majority of respondents in this study had access to taps is encouraging. However, water in urban areas is expensive, which can impact on poor households (Oguttu et al., 2021). The high dependency of garden owners on taps in this study is contrary to observations made in the Eastern Cape, where most of the respondents relied on rivers and streams (Mdiya and Mdoda, 2021). However, whether the water was onsite or offsite was not measured in this study. This is of significance, as fetching water for irrigation off-site often doubles the workload and could constitute a challenge for the elderly. The inconsistencies between the two studies could be due to the fact that the latter study was conducted in a rural area where piped water might still not be accessible. For example, the 2020 General Household Survey in South Africa revealed that piped water was only accessible to 46.6% of households (Statistics SA, 2021).
The respondents in this study had planted a varied number of crops in their gardens. Vegetables planted by most respondents included spinach (92.3%), cabbage (73.9%), amadumbe (70.1%), maize (60.9%) and beans (50.6%). There was also a reasonable number of respondents who had planted onion (47.5%), beetroot (39.5%), sweet potato (38.7%), carrot (36.8%) and butternut (23%), while fewer than 20% had planted tomatoes and banana. Climatic conditions and soil types play a major role in determining the type of crops grown (Machete, 2020). These results indicate that respondents cultivate mainly vegetables, as previous reported by StatsSA (2019). Furthermore, the results demonstrate the diversity of the crops that are cultivated. Such diversification in food gardening is largely associated with varied diets and a subsequent improvement in the household's food security status (Silvestri et al., 2015).
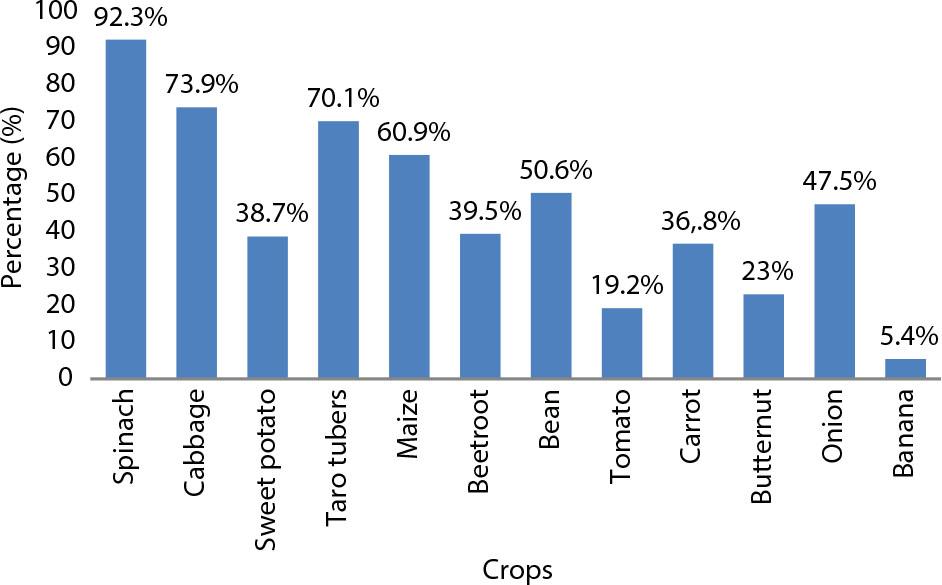
Types of food crops grown
Multiple responses were permitted hence the percentages are above 100%.
Source: own elaboration.
A number of demographic and economic characteristics were included in the logistic model. Of these eight variables, five were significantly associated with food gardening positive coefficients (Table 5). With regard to formal education, the variable was marginally significant at the 10% level, indicating that respondents with tertiary education are more likely (OR = 6.599: p = .070) to own food gardens than those without formal education. These findings correspond with those reported in previous studies (Mdiya and Mdoda, 2021; Mcata, 2019), where it was observed that an increase in the years of schooling boosted the likelihood of the household participating in gardening. Schooling creates awareness about the importance of food security, knowledge about food gardens and innovation (Mdiya and Mdoda, 2021).
Binary logistic regression analysis of the factors correlated with participation in gardening
| Variables | Coefficients B | AOR | P value |
|---|---|---|---|
| Constant | 0.954 | 2.596 | 0.488 |
| Age (Reference 18–30 years) | |||
| 31–40 | –.378 | .685 | .741 |
| 41–50 | .560 | 1.751 | .634 |
| 51–60 | .271 | 1.452 | .819 |
| 61–60 | .373 | 1.452 | .775 |
| 71–80 | –.060 | .941 | .967 |
| >81 | –1.234 | .291 | .459 |
| Education (Reference = No formal education) | |||
| Primary education | .625 | 1.869 | .361 |
| Matric | 1.186 | 3.274 | .121 |
| Tertiary education | 1.887 | 6.599 | .070** |
| Number of household members | |||
| Reference 1–3 = members | |||
| 4–6 members | .886 | 2.426 | .042* |
| 7–9 members | 1.813 | 6.126 | .008* |
| > 9 members | 19.672 | 350 234 731.78 | 1.000 |
| Number of employed household members | |||
| (Reference = no employed members) | |||
| 1–2 members employed | –.444 | .641 | .430 |
| 3–4 employed | –.913 | .401 | .282 |
| > 4 | –25.460 | .000 | .999 |
| Marital status (Reference = single) | |||
| Married | –.183 | .833 | .690 |
| Divorced | 2.257 | 9.552 | .097** |
| Widowed | –.867 | .420 | .218 |
| Cohabiting | –1.670 | .188 | .244 |
| Dwelling type (Reference point= formal housing) | |||
| Informal | 1.454 | 4.282 | .236 |
| Renting | 1.330 | 3.780 | .246 |
| Access to land | 4.897 | 133.882 | <0.001* |
| Agric experience | 2.518 | 12.398 | <0.001* |
Significant at p < 0.05.
Marginally significant at 0.05 < p < 0.10.
The results showed that the odds of owning food gardens amongst divorced respondents is 9.552 times higher than among those who are single. The difference was significant (p = .097) at the 10% level. According to a study that was conducted in Australia, divorced women were found to be more food-insecure than those that are single (Butcher et al., 2019). This could be the reason why divorced households in this study resort to home gardening. Food gardens have been linked to increased food supply and the subsequent decline in food insecurity (David and Grobler, 2022). In support of this view, divorce was strongly associated with gardening and the ability to commercialize their garden produce, since they wish to cater for their household expenses, which was the conclusion of a study conducted in Sri Lanka (Mufeeth et al., 2021).
Having more household members was significantly associated with owning food gardens. This was shown by the fact that households with 4–6 household members (OR = 2.426: p = .042:) and those with 7–9 members (OR = 6.126: p = .008) were more likely to own food gardens when compared those with 1–3 household members. Similar findings were also reported by Oguttu et al. (2021). While some authors associate the participation of large household sizes with an increase in labour capacity (Bongiwa and Obi, 2015), some argue that large households are likely to stay in freestanding houses. Such houses are associated with space, thereby eliminating the issue of access to land being a barrier (Schupp et al., 2016). However, it is well known that there is a strong association between large households and food insecurity (De Wet-Billings, 2023; Tambe et al., 2023). Therefore, it can be argued that these households are resorting to food gardening to mitigate food shortages.
Access to arable land was also conducive to owning food gardens (OR = 133.882), with results showing higher odds of owning a garden for those that had access to arable land (p ≤ 0.001). It is well known that a strong correlation exists between having access to arable land and home gardening. These findings are similar to what was reported by previous studies (Khumalo and Sibanda, 2019). However, it has also been revealed in previous studies that though land may be accessible, it is often of insufficient size to make a significant contribution towards the food security of gardening households.
Likewise, having agricultural experience was highly significant at the 5% level, with results revealing that respondents with agricultural experience (OR = 12.398; p = <0.001) were more likely to own food gardens when compared to those that did not have. This implies that through experience, respondents become aware of the benefits of gardens and might gain critical gardening skills, which encourages them to continue participating. The importance of experience in encouraging gardening is widely documented in the literature. For example, David and Glober (2022) concluded in their study that a lack of gardening skills and knowledge limits the participation of many urban dwellers. Philander and Karriem (2014) reported that people who have migrated from rural areas often participate in gardening because they already have gardening experience. According to research, past gardening improves participation and the sustainability of gardens (Lee and Matarrita-Cascante, 2019). In addition to this, David and Glober (2022) argue that farming knowledge and skills translate into better garden yields.
The level of participation in gardening in this area was high (72.5%). This shows that respondents in the study area are using gardening to reduce food demand pressure, which is particularly crucial when considering the socio-economic factors in this study. The study therefore recommends that in order to promote food gardening in peri-urban areas, variables such as education and skills transfer should be targeted. Adult-based education needs to be promoted, which could include nutrition education, thus not only raising awareness about gardening but also about nutrition sensitive gardens, meal plans and meal preparation. This could be augmented by providing skills transfer programs, which can be offered by extension services and community-based organisations. Secondly, access to arable land for gardening is of utmost importance. Studies designed to investigate the amount of land these households have access to are therefore highly recommended. Such knowledge will help to establish whether there is a need for land redistribution in the area. Finally, the results revealed a positive correlation between households headed by divorced persons and food gardening. This calls for targeting support for these households to promote food gardening and to fight food insecurity.