
Fig. 1.
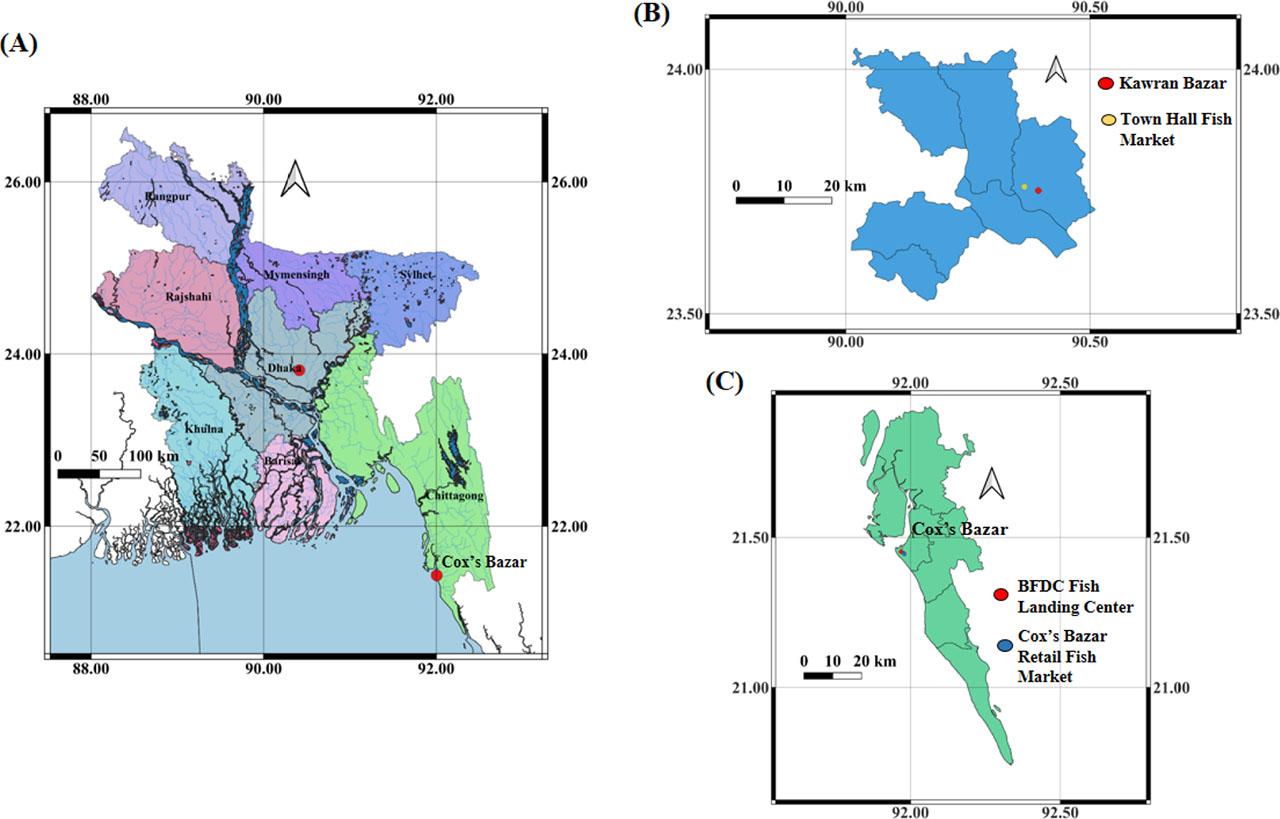
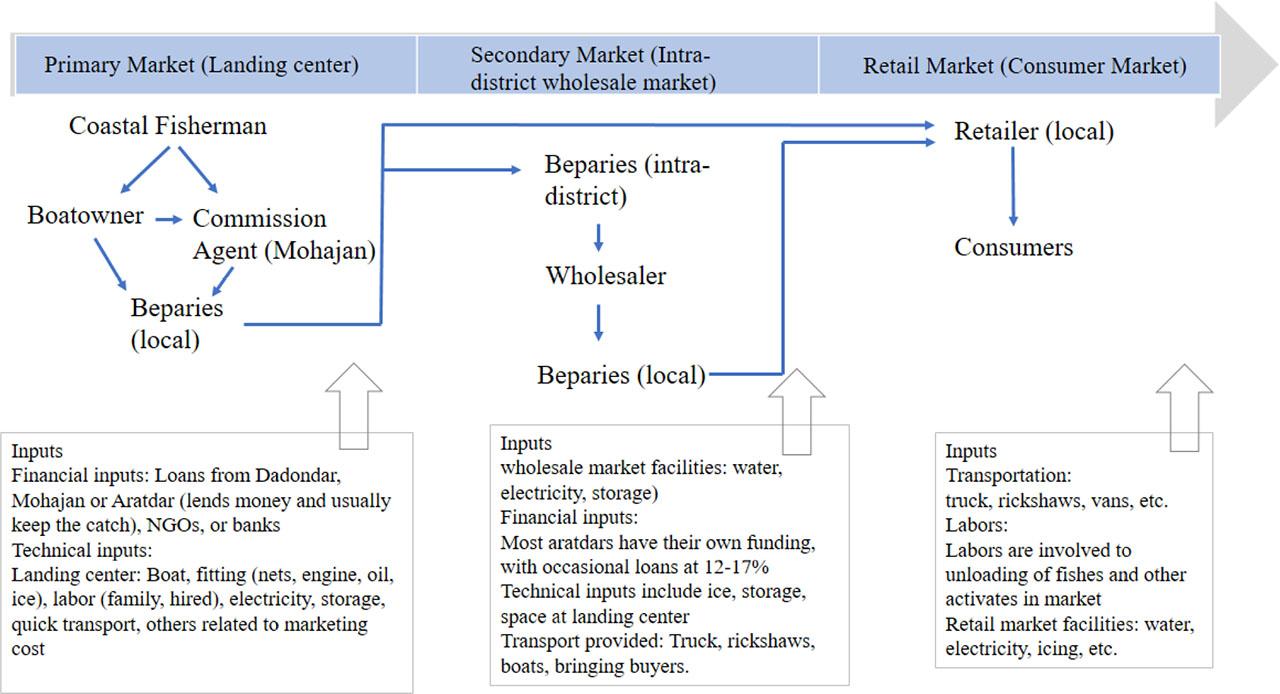
Fig. 2.
| (B) | ||||||
|---|---|---|---|---|---|---|
| Purchase price | Marketing cost | Sale price | Marketing margin | Marketing profit | Total gross marketing margin | |
| Purchase price | 1 | 0.212 | 0.999** | 0.561* | 0.546* | –0.611** |
| Marketing cost | 0.212 | 1 | 0.211 | 0.227 | 0.105 | –0.052 |
| Sale price | 0.999** | 0.212 | 1 | 0.587** | 0.572** | –0.587** |
| Marketing margin | 0.561* | 0.227 | 0.587** | 1 | 0.992** | –0.117 |
| Marketing profit | 0.546* | 0.105 | 0.572** | 0.992** | 1 | –0.113 |
| Total gross marketing margin | –0.611** | –0.052 | –0.587** | –0.117 | –0.113 | 1 |
Purchase price, marketing costs, sale price, marketing margin, market profit and total gross marketing margin of hilsa, silver pomfret and mackerel tuna, 2001–2022
| Hilsa | Silver pomfret | Mackerel tuna | ||||||||||
|---|---|---|---|---|---|---|---|---|---|---|---|---|
| 2001 | 2007 | 2014 | 2022 | 2001 | 2007 | 2014 | 2022 | 2001 | 2007 | 2014 | 2022 | |
| Primary market | ||||||||||||
| Purchase price ($ kg−1) | 1.32 | 1.48 | 6.76 | 10.20 | 3.17 | 2.68 | 7.86 | 7.88 | 0.79 | 0.97 | 1.63 | 2.12 |
| Marketing costs ($ kg−1) | 0.09 | 0.08 | 0.12 | 0.12 | 0.12 | 0.09 | 0.12 | 0.11 | 0.08 | 0.07 | 0.11 | 0.08 |
| Sales price ($ kg−1) | 1.46 | 1.66 | 7.58 | 11.52 | 3.38 | 3.04 | 8.81 | 8.89 | 0.92 | 1.20 | 1.82 | 2.53 |
| Marketing margin ($ kg−1) | 0.14 | 0.18 | 0.81 | 1.31 | 0.21 | 0.35 | 0.94 | 1.01 | 0.12 | 0.24 | 0.20 | 0.40 |
| Marketing profit ($ kg−1) | 0.05 | 0.10 | 0.69 | 1.20 | 0.10 | 0.26 | 0.83 | 0.90 | 0.04 | 0.16 | 0.08 | 0.32 |
| Total gross marketing margin (%) | 9.64 | 10.99 | 10.71 | 11.40 | 6.25 | 11.66 | 10.71 | 11.36 | 13.46 | 19.70 | 10.71 | 16.00 |
| Secondary market | ||||||||||||
| Purchase price ($ kg−1) | 1.46 | 1.71 | 7.58 | 11.52 | 3.38 | 3.04 | 8.81 | 8.89 | 0.92 | 1.20 | 1.82 | 2.53 |
| Marketing costs ($ kg−1) | 0.03 | 0.06 | 0.13 | 0.41 | 0.03 | 0.04 | 0.13 | 0.26 | 0.02 | 0.04 | 0.13 | 0.25 |
| Sales price ($ kg−1) | 1.53 | 1.81 | 8.56 | 13.13 | 3.51 | 3.15 | 9.95 | 10.10 | 0.99 | 1.29 | 2.06 | 3.03 |
| Marketing margin ($ kg−1) | 0.07 | 0.10 | 0.98 | 1.62 | 0.12 | 0.10 | 1.15 | 1.21 | 0.07 | 0.08 | 0.24 | 0.51 |
| Marketing profit ($ kg−1) | 0.05 | 0.04 | 0.85 | 1.21 | 0.10 | 0.06 | 1.02 | 0.95 | 0.05 | 0.04 | 0.11 | 0.25 |
| Total gross marketing margin (%) | 4.60 | 5.43 | 11.50 | 12.31 | 3.52 | 3.29 | 11.50 | 12.00 | 7.14 | 6.25 | 11.50 | 16.67 |
| Consumer market | ||||||||||||
| Purchase price ($ kg−1) | 1.53 | 1.86 | 8.56 | 13.13 | 3.51 | 3.10 | 9.95 | 10.10 | 0.99 | 1.42 | 2.06 | 3.03 |
| Marketing costs ($ kg−1) | 0.06 | 0.07 | 0.16 | 0.08 | 0.06 | 0.09 | 0.16 | 0.08 | 0.06 | 0.07 | 0.16 | 0.07 |
| Sales price | 1.71 | 2.14 | 9.59 | 14.75 | 3.70 | 3.41 | 11.15 | 11.62 | 1.15 | 1.67 | 2.31 | 3.54 |
| Marketing margin ($ kg−1) | 0.18 | 0.28 | 1.03 | 1.62 | 0.19 | 0.32 | 1.19 | 1.52 | 0.16 | 0.25 | 0.25 | 0.51 |
| Marketing profit ($ kg−1) | 0.12 | 0.21 | 0.87 | 1.53 | 0.13 | 0.22 | 1.03 | 1.43 | 0.10 | 0.19 | 0.09 | 0.44 |
| Total gross marketing margin (%) | 10.31 | 13.17 | 10.71 | 10.96 | 5.24 | 9.23 | 10.71 | 13.04 | 13.85 | 15.16 | 10.72 | 14.29 |
Overview of empirical data collection methods during the study period
| Market | Location of market | Participants | Sample size | Tools |
|---|---|---|---|---|
| Primary Market (Landing center) | BFDC landing center, Cox's Bazar | Fisherman | 30 | Individual interview, Focus group discussion (FGD) |
| Mahajon | 08 | |||
| Bepari (Supplier) | 12 | |||
| Secondary market | Karwan Bazar, Dhaka | Beparies | 15 | Individual interview, Focus group discussion (FGD) |
| Aratdar (Fish brokers) | 15 | |||
| Consumer market | Cox's Bazar Meteropolitan market | Retailer | 15 | Individual interview |
| Consumer | 30 | |||
| Town Hall Market, Mohammadpur, Dhaka | Retailer | 15 | Individual interview | |
| Consumer | 30 |
Marketing margin ($ kg−1) and profit ($ kg−1) of long- and short-chain marketing channels in the southeast coastal areas of Bangladesh from 1 January 2022 to 15 May 2022
| Primary market | Hilsa (< 1 kg) | Hilsa (> 1 kg) | Mackerel tuna | Black pomfret | Silver pomfret | Bombay duck | Indian mackerel | Bigeye croaker | Red snapper | Gagora catfish |
|---|---|---|---|---|---|---|---|---|---|---|
| Primary market (short- and long-chain marketing channels) | ||||||||||
| Purchase price ($ kg−1) | 6.46 | 10.20 | 2.12 | 4.55 | 7.88 | 1.01 | 2.02 | 2.22 | 4.34 | 2.53 |
| Marketing cost ($ kg−1) | 0.09 | 0.12 | 0.08 | 0.10 | 0.11 | 0.07 | 0.08 | 0.07 | 0.08 | 0.08 |
| Sale price ($ kg−1) | 7.07 | 11.52 | 2.53 | 5.05 | 8.89 | 1.31 | 2.53 | 2.63 | 5.05 | 3.03 |
| Marketing margin ($ kg−1) | .61 | 1.31 | 0.40 | 0.51 | 1.01 | 0.30 | 0.51 | 0.40 | 0.71 | 0.51 |
| Marketing profit ($ kg−1) | 0.51 | 1.20 | 0.32 | 0.40 | 0.90 | 0.23 | 0.43 | 0.33 | 0.62 | 0.43 |
| Total gross marketing margin (%) | 8.57 | 11.40 | 16.00 | 10.00 | 11.36 | 23.08 | 20.00 | 15.38 | 14.00 | 16.67 |
| Secondary market (long-chain marketing channel) | ||||||||||
| Purchase price ($ kg−1) | 7.07 | 11.52 | 2.53 | 5.05 | 8.89 | 1.31 | 2.53 | 2.63 | 5.05 | 3.03 |
| Marketing cost ($ kg−1) | 0.37 | 0.41 | 0.25 | 0.26 | 0.26 | 0.20 | 0.24 | 0.21 | 0.24 | 0.24 |
| Sale price ($ kg−1) | 8.28 | 13.13 | 3.03 | 5.86 | 10.10 | 1.82 | 3.03 | 3.23 | 6.06 | 3.64 |
| Marketing margin ($ kg−1) | 1.21 | 1.62 | 0.51 | 0.81 | 1.21 | 0.51 | 0.51 | 0.61 | 1.01 | 0.61 |
| Marketing profit ($ kg−1) | 0.85 | 1.21 | 0.25 | 0.55 | 0.95 | 0.30 | 0.26 | 0.40 | 0.77 | 0.37 |
| Total gross marketing margin (%) | 14.63 | 12.31 | 16.67 | 13.79 | 12.00 | 27.78 | 16.67 | 18.75 | 16.67 | 16.67 |
| Consumer market (long-chain marketing channel) | ||||||||||
| Purchase price ($ kg−1) | 8.28 | 13.13 | 3.03 | 5.86 | 10.10 | 1.82 | 3.03 | 3.23 | 6.06 | 3.64 |
| Marketing cost ($ kg−1) | 0.08 | 0.08 | 0.07 | 0.08 | 0.08 | 0.05 | 0.07 | 0.06 | 0.07 | 0.07 |
| Sale price ($ kg−1) | 9.09 | 14.75 | 3.54 | 6.57 | 11.62 | 2.32 | 3.54 | 4.04 | 7.07 | 4.55 |
| Marketing margin ($ kg−1) | 0.81 | 1.62 | 0.51 | 0.71 | 1.52 | 0.51 | 0.51 | 0.81 | 1.01 | 0.91 |
| Marketing profit ($ kg−1) | 0.73 | 1.53 | 0.44 | 0.63 | 1.43 | 0.46 | 0.44 | 0.75 | 0.94 | 0.84 |
| Total gross marketing margin (%) | 8.89 | 10.96 | 14.29 | 10.77 | 13.04 | 21.74 | 14.29 | 20.00 | 14.29 | 20.00 |
| Consumer market (short-chain marketing channel) | ||||||||||
| Purchase price ($ kg−1) | 7.07 | 11.52 | 2.53 | 5.05 | 8.89 | 1.31 | 2.53 | 2.63 | 5.05 | 3.03 |
| Marketing cost ($ kg−1) | 0.04 | 0.05 | 0.03 | 0.04 | 0.04 | 0.03 | 0.04 | 0.04 | 0.04 | 0.03 |
| Sale price ($ kg−1) | 7.88 | 12.83 | 2.83 | 6.06 | 9.90 | 1.62 | 2.83 | 3.03 | 6.06 | 3.43 |
| Marketing margin ($ kg−1) | 0.81 | 1.31 | 0.30 | 1.01 | 1.01 | 0.30 | 0.30 | 0.40 | 1.01 | 0.40 |
| Marketing profit ($ kg−1) | 0.77 | 1.27 | 0.28 | 0.97 | 0.97 | 0.28 | 0.26 | 0.37 | 0.97 | 0.38 |
| Total gross marketing margin (%) | 10.26 | 10.24 | 10.71 | 16.67 | 10.20 | 18.75 | 10.71 | 13.33 | 16.67 | 11.76 |
Common and scientific names of nine marine fish species of the southeast coastal areas of Bangladesh
| SL No. | Common name | Scientific name | Weight (kg) |
|---|---|---|---|
| 1a. | Hilsa | Tenualosa ilisha | 1–1.8 |
| 1b. | Hilsa | Tenualosa ilisha | 0.5–0.7 |
| 2. | Mackerel tuna | Euthynnus affinis | 0.3–0.5 |
| 3. | Black pomfret | Parastromateus niger | < 0.5 |
| 4. | Silver pomfret | Stromateus argenteus | 0.25–0.4 |
| 5. | Bombay duck | Harpodon nehereus | 0.05–0.1 |
| 6. | Indian mackerel | Rastrelliger kanagurta | 0.1–0.25 |
| 7. | Bigeye croaker | Pennahia anea | 0.2–0.3 |
| 8. | Red snapper | Lutjanus campechanus | 0.3–0.6 |
| 9. | Gagora catfish | Arius gagora | >0.8 |
The sources of the data on marketing margin and profit for three marine fish species of Bangladesh
| Species | Reference | Study Area |
|---|---|---|
| Hilsa (Tenualosa ilisha), Silver Pomfret (Pampus argenteus) and Mackerel Tuna (Euthynnus affinis) | Islam et al., 2001 |
|
| Islam et al., 2007 |
| |
| Rabbani et al., 2017 |
|
Marketing costs ($ kg−1) for the long- and short-chain marketing channels in the southeast coastal areas of Bangladesh from 1 January 2022 to 15 May 2022
| Item | Hilsa (< 1 kg) | Hilsa (> 1 kg) | Mackerel tuna | black Pomfret | silver Pomfret | Bombay duck | Indian mackerel | Bigeye croaker | Red snapper | Gagora catfish |
|---|---|---|---|---|---|---|---|---|---|---|
| Primary market (short and long-chain marketing channel) | ||||||||||
| Transportation cost | 0.02 | 0.02 | 0.02 | 0.02 | 0.02 | 0.02 | 0.02 | 0.02 | 0.02 | 0.02 |
| Unloading | 0.01 | 0.01 | 0.01 | 0.01 | 0.01 | 0.004 | 0.01 | 0.01 | 0.01 | 0.01 |
| Icing | 0.04 | 0.05 | 0.03 | 0.04 | 0.04 | 0.03 | 0.03 | 0.02 | 0.03 | 0.03 |
| Landing station toll | 0.02 | 0.03 | 0.02 | 0.03 | 0.03 | 0.02 | 0.02 | 0.02 | 0.02 | 0.02 |
| Wages | 0.01 | 0.01 | 0.01 | 0.01 | 0.01 | 0.01 | 0.01 | 0.01 | 0.01 | 0.01 |
| House rent | 0.004 | 0.004 | 0.003 | 0.003 | 0.003 | 0.002 | 0.002 | 0.002 | 0.002 | 0.002 |
| Electricity cost | 0.01 | 0.01 | 0.01 | 0.01 | 0.01 | 0.01 | 0.01 | 0.01 | 0.01 | 0.01 |
| Total | 0.09 | 0.12 | 0.08 | 0.10 | 0.11 | 0.07 | 0.08 | 0.07 | 0.08 | 0.08 |
| Secondary market (long-chain marketing channel) | ||||||||||
| Transportation cost | 0.04 | 0.06 | 0.03 | 0.04 | 0.04 | 0.03 | 0.03 | 0.03 | 0.03 | 0.04 |
| Unloading | 0.01 | 0.01 | 0.01 | 0.01 | 0.01 | 0.01 | 0.01 | 0.01 | 0.01 | 0.01 |
| Cork sheet | 0.05 | 0.06 | 0.06 | 0.05 | 0.06 | 0.04 | 0.05 | 0.03 | 0.05 | 0.04 |
| Packaging | 0.02 | 0.02 | 0.02 | 0.02 | 0.02 | 0.02 | 0.02 | 0.02 | 0.02 | 0.02 |
| Icing | 0.04 | 0.05 | 0.04 | 0.04 | 0.04 | 0.02 | 0.04 | 0.01 | 0.03 | 0.04 |
| Wages | 0.01 | 0.01 | 0.01 | 0.01 | 0.01 | 0.01 | 0.01 | 0.01 | 0.01 | 0.01 |
| Aratdar commission | 0.20 | 0.20 | 0.10 | 0.10 | 0.10 | 0.10 | 0.10 | 0.10 | 0.10 | 0.10 |
| House rent | 0.002 | 0.002 | 0.002 | 0.002 | 0.002 | 0.002 | 0.002 | 0.002 | 0.002 | 0.002 |
| Electricity cost | 0.003 | 0.003 | 0.003 | 0.003 | 0.003 | 0.003 | 0.003 | 0.003 | 0.003 | 0.003 |
| Total | 0.37 | 0.41 | 0.25 | 0.26 | 0.26 | 0.21 | 0.24 | 0.21 | 0.24 | 0.24 |
| Consumer market (long-chain marketing channel) | ||||||||||
| Transportation cost | 0.04 | 0.04 | 0.03 | 0.04 | 0.04 | 0.02 | 0.03 | 0.03 | 0.04 | 0.04 |
| Unloading | 0.01 | 0.01 | 0.01 | 0.01 | 0.01 | 0.01 | 0.01 | 0.01 | 0.01 | 0.01 |
| Icing | 0.03 | 0.04 | 0.03 | 0.03 | 0.03 | 0.02 | 0.03 | 0.02 | 0.03 | 0.02 |
| House rent | 0.003 | 0.003 | 0.003 | 0.003 | 0.003 | 0.003 | 0.003 | 0.003 | 0.003 | 0.003 |
| Electricity cost | 0.003 | 0.003 | 0.003 | 0.003 | 0.003 | 0.3 | 0.3 | 0.3 | 0.3 | 0.3 |
| Total | 0.08 | 0.08 | 0.07 | 0.08 | 0.08 | 0.05 | 0.07 | 0.06 | 0.07 | 0.07 |
| Consumer market (short-chain marketing channel) | ||||||||||
| Transportation cost | 0.02 | 0.02 | 0.01 | 0.01 | 0.01 | 0.01 | 0.01 | 0.01 | 0.01 | 0.01 |
| Unloading | 0.01 | 0.01 | 0.01 | 0.01 | 0.01 | 0.01 | 0.01 | 0.01 | 0.01 | 0.01 |
| Icing | 0.02 | 0.03 | 0.01 | 0.02 | 0.02 | 0.01 | 0.03 | 0.02 | 0.02 | 0.01 |
| House rent | 0.003 | 0.003 | 0.003 | 0.003 | 0.003 | 0.003 | 0.003 | 0.003 | 0.003 | 0.003 |
| Electricity cost | 0.003 | 0.003 | 0.003 | 0.003 | 0.003 | 0.003 | 0.003 | 0.003 | 0.003 | 0.003 |
| Total | 0.05 | 0.05 | 0.03 | 0.04 | 0.04 | 0.03 | 0.05 | 0.04 | 0.04 | 0.03 |