
Table 1
Range of concentrations for species in the off-line analysis.
| Na+ (µg m–3) | H2SO4 (µg m–3) | NH3 (µg m–3) | HNO3 (µg m–3) | HCl (µg m–3) | Ca2+ (µg m–3) | K+ (µg m–3) | Mg2+ (µg m–3) | RH (%) | T (K) | |
|---|---|---|---|---|---|---|---|---|---|---|
| Standard set of conditionsa | ||||||||||
| Min | 0.024 | 0.52 | 0.28 | 0.04 | 0.02 | 0.003 | 0.002 | 0.001 | 10.6 | 236 |
| Max | 5.4 | 10.3 | 13.5 | 9.2 | 8.5 | 0.53 | 0.33 | 0.2 | 96 | 306 |
| European conditionsb | ||||||||||
| Min | 0.06 | 0.57 | 0.28 | 0.06 | 0.03 | 0.003 | 0.002 | 0.001 | 12 | 265 |
| Max | 5.4 | 7.4 | 13.5 | 9.1 | 8.5 | 0.53 | 0.33 | 0.2 | 96 | 306 |
[i] a 331,520 tests.
b 23,680 tests.
Table 2
Normalized mean biases and normalized mean errors for the off-line tests.
| NH4+ | Cl– | H+ | NO3– | HNO3 (g) | HCl (g) | NH3 (g) | H2O | Dry PM | |
|---|---|---|---|---|---|---|---|---|---|
| ISORROPIA-lite versus ISORROPIA-II (stable mode, online act. coef.) | |||||||||
| Standard set of conditions | |||||||||
| NMB (%) | 7.8 | 8.4 | 135 | 24 | –22 | –6.2 | –11 | 42 | 4.5 |
| NME (%) | 8.2 | 10 | 137 | 24 | 22 | 7.5 | 11 | 42 | 4.7 |
| European conditions | |||||||||
| NMB (%) | 7.7 | 3.8 | 64 | 13 | –21 | –4.3 | –5.5 | 13 | 3.1 |
| NME (%) | 8.2 | 4.2 | 68 | 13 | 21 | 4.7 | 5.8 | 13 | 3.2 |
| ISORROPIA-II (stable mode, tables) versus ISORROPIA-II (stable mode, online act. coef.) | |||||||||
| Standard set of conditions | |||||||||
| NMB (%) | –0.2 | –0.4 | 1.4 | –0.4 | 0.4 | 0.3 | 0.3 | –1.5 | –0.1 |
| NME (%) | 1.4 | 1.2 | 12 | 4.4 | 4.2 | 0.9 | 1.9 | 2.3 | 0.8 |
| European conditions | |||||||||
| NMB (%) | –1.6 | –0.9 | –3.6 | –2.5 | 4.1 | 1 | 1.2 | –2.1 | –0.6 |
| NME (%) | 2.5 | 1.3 | 9.2 | 4.1 | 6.6 | 1.4 | 1.8 | 2.4 | 1 |
| ISORROPIA-II (metastable mode, online act. coef.) versus ISORROPIA-II (stable mode, online act. coef.) | |||||||||
| Standard set of conditions | |||||||||
| NMB (%) | 7.9 | 8.6 | 136 | 24 | –22 | –6.4 | –11 | 42 | 4.5 |
| NME (%) | 8.1 | 9.9 | 137 | 24 | 22 | 7.3 | 11 | 42 | 4.6 |
| European conditions | |||||||||
| NMB (%) | 8.7 | 4.1 | 65 | 15 | –24 | –4.6 | –6.2 | 13 | 3.5 |
| NME (%) | 8.7 | 4.1 | 65 | 15 | 24 | 4.6 | 6.2 | 13 | 3.5 |
| ISORROPIA-lite (organic aerosol water presence versus absence) | |||||||||
| Standard set of conditions | |||||||||
| NMB (%) | 1.8 | 3.9 | 6.7 | 2.6 | –3.9 | –3.3 | –2.9 | 12 | 0.9 |
| NME (%) | 1.8 | 3.9 | 8.1 | 2.6 | 3.9 | 3.3 | 2.9 | 12 | 0.9 |
| European conditions | |||||||||
| NMB (%) | 2.5 | 2.3 | 7 | 2.3 | –5.3 | –2.8 | –2.1 | 8.2 | 1 |
| NME (%) | 2.5 | 2.3 | 8.5 | 2.3 | 5.3 | 2.8 | 2.1 | 8.2 | 1 |
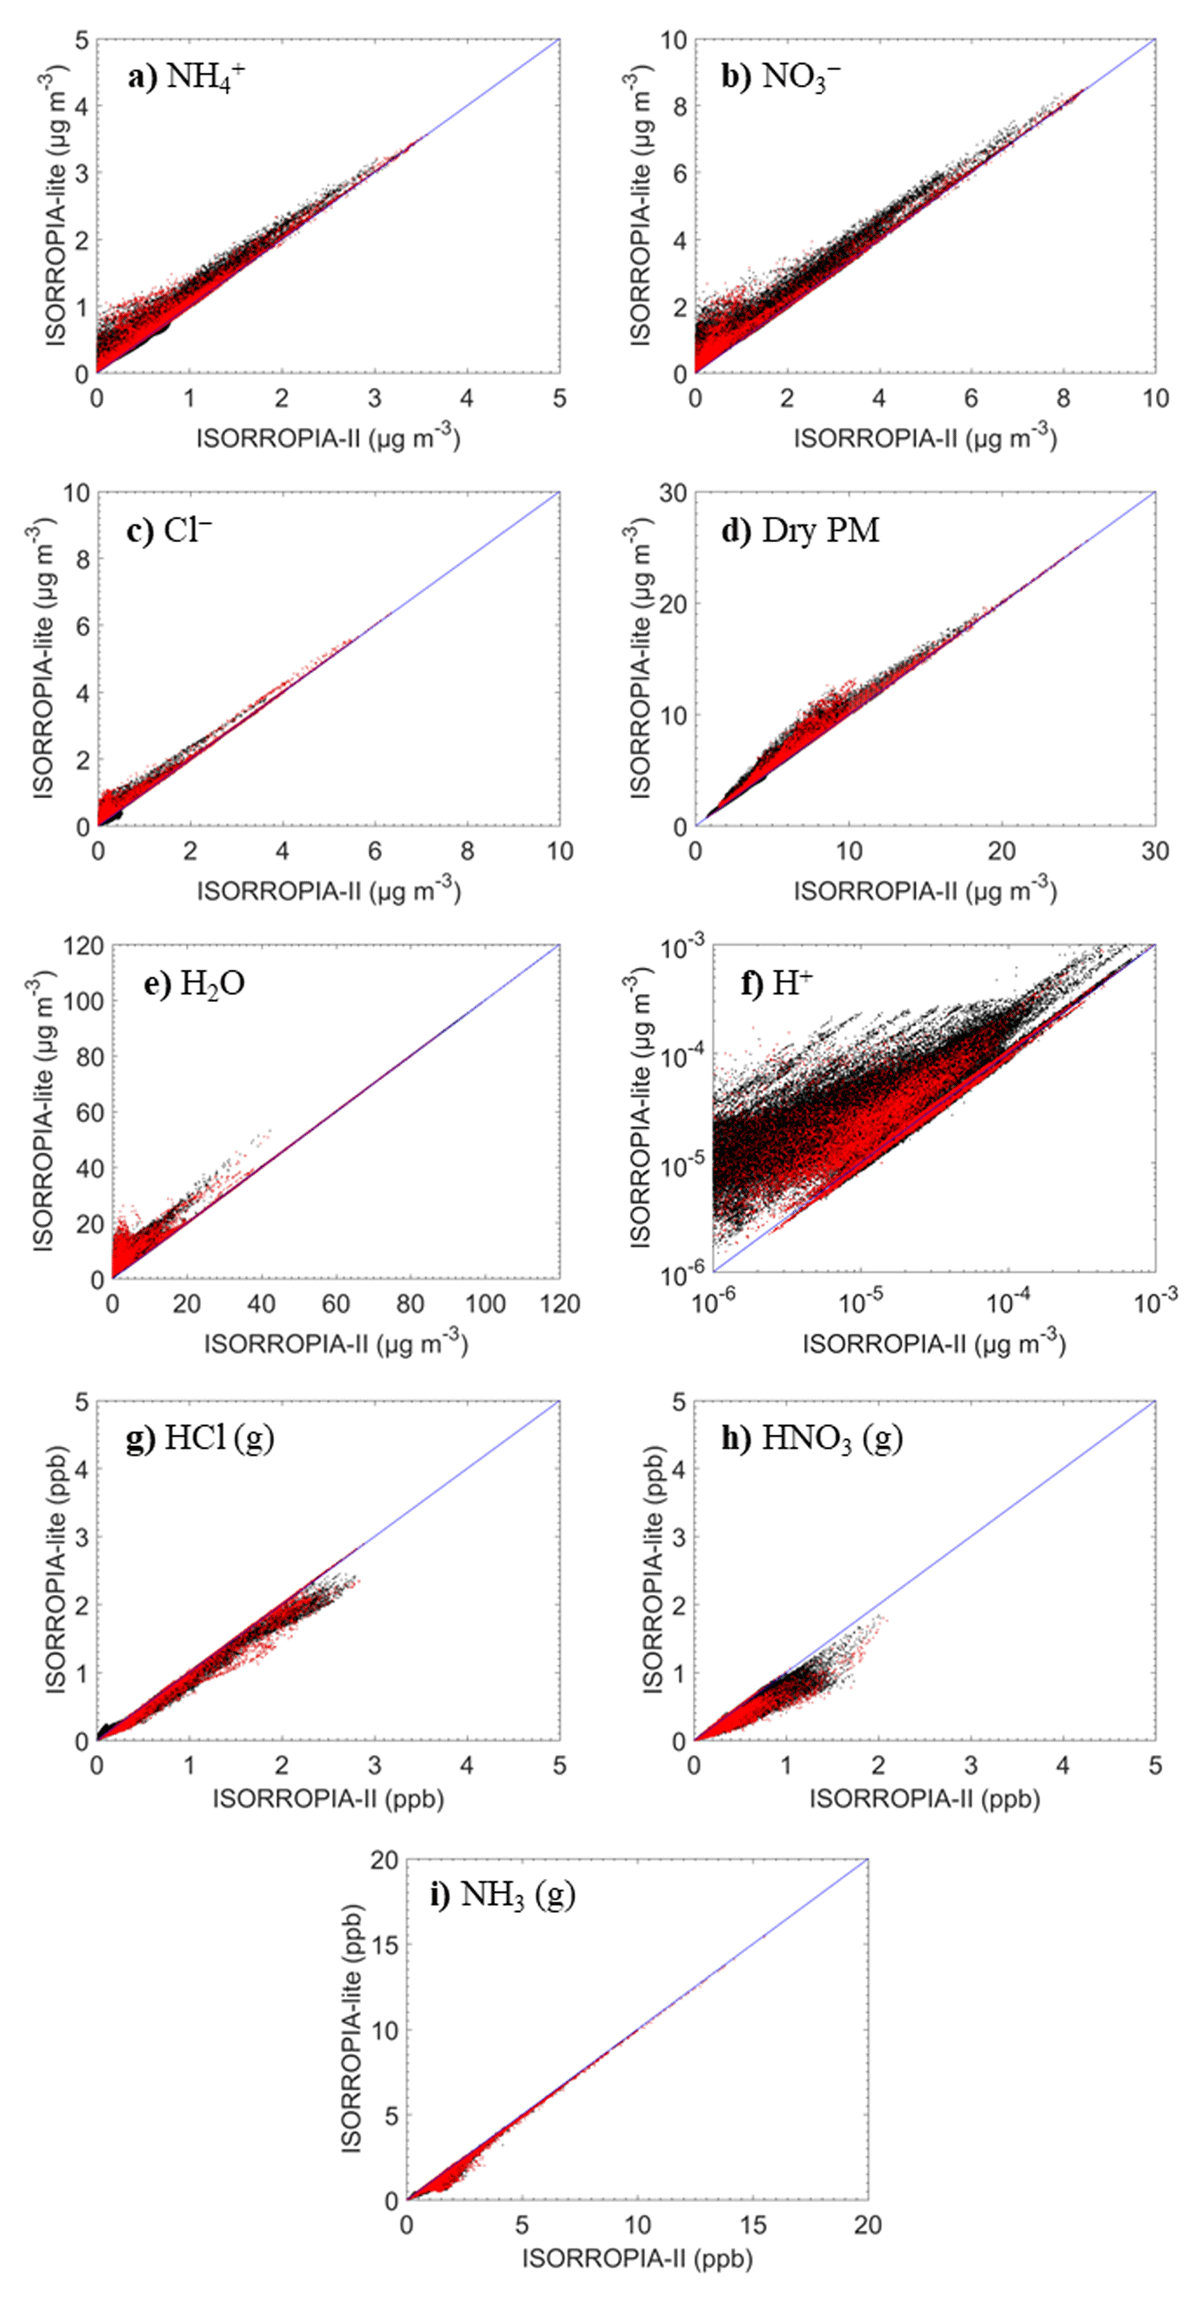
Figure 1
Comparison of the particulate and gas-phase concentrations predicted by ISORROPIA-II in stable mode (with online binary activity coefficients calculation) and ISORROPIA-lite for the off-line simulations for the standard (black) and European (red) set of conditions: a) ammonium, b) nitrate, c) chloride, d) dry PM, e) water, f) hydrogen ion, g) hydrochloric acid, h) nitric acid, and i) ammonia. There are 331,520 points in these graphs.
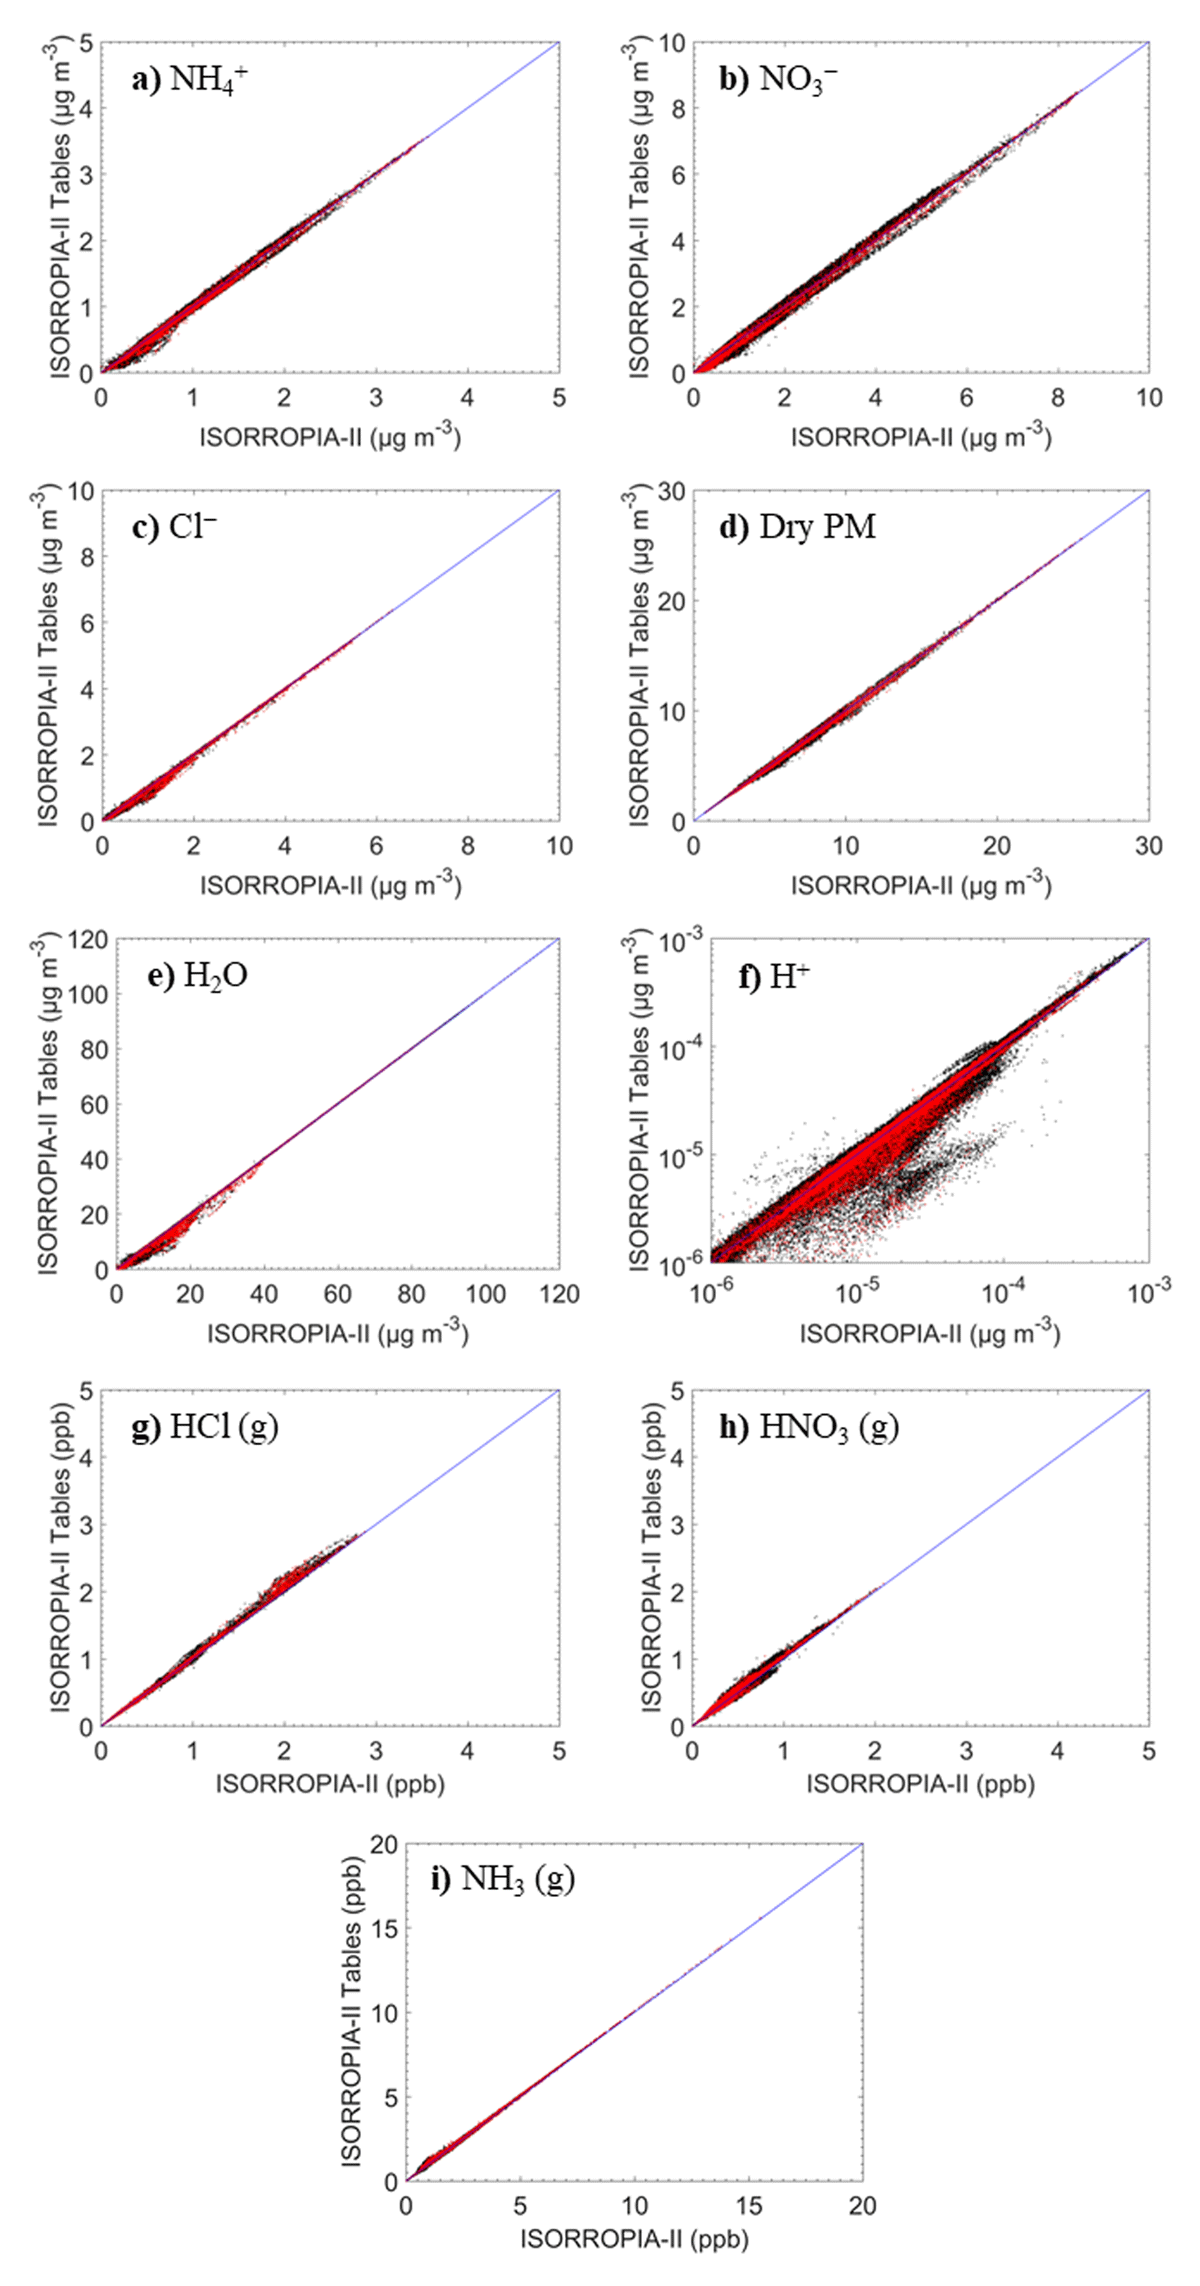
Figure 2
Comparison of the particulate and gas-phase concentrations predicted by ISORROPIA-II in stable mode with online binary activity coefficients calculation and with pre-calculated tables for the off-line simulations for the standard (black) and European (red) set of conditions: a) ammonium, b) nitrate, c) chloride, d) dry PM, e) water, f) hydrogen ion, g) hydrochloric acid, h) nitric acid, and i) ammonia. There are 331,520 points in these graphs.
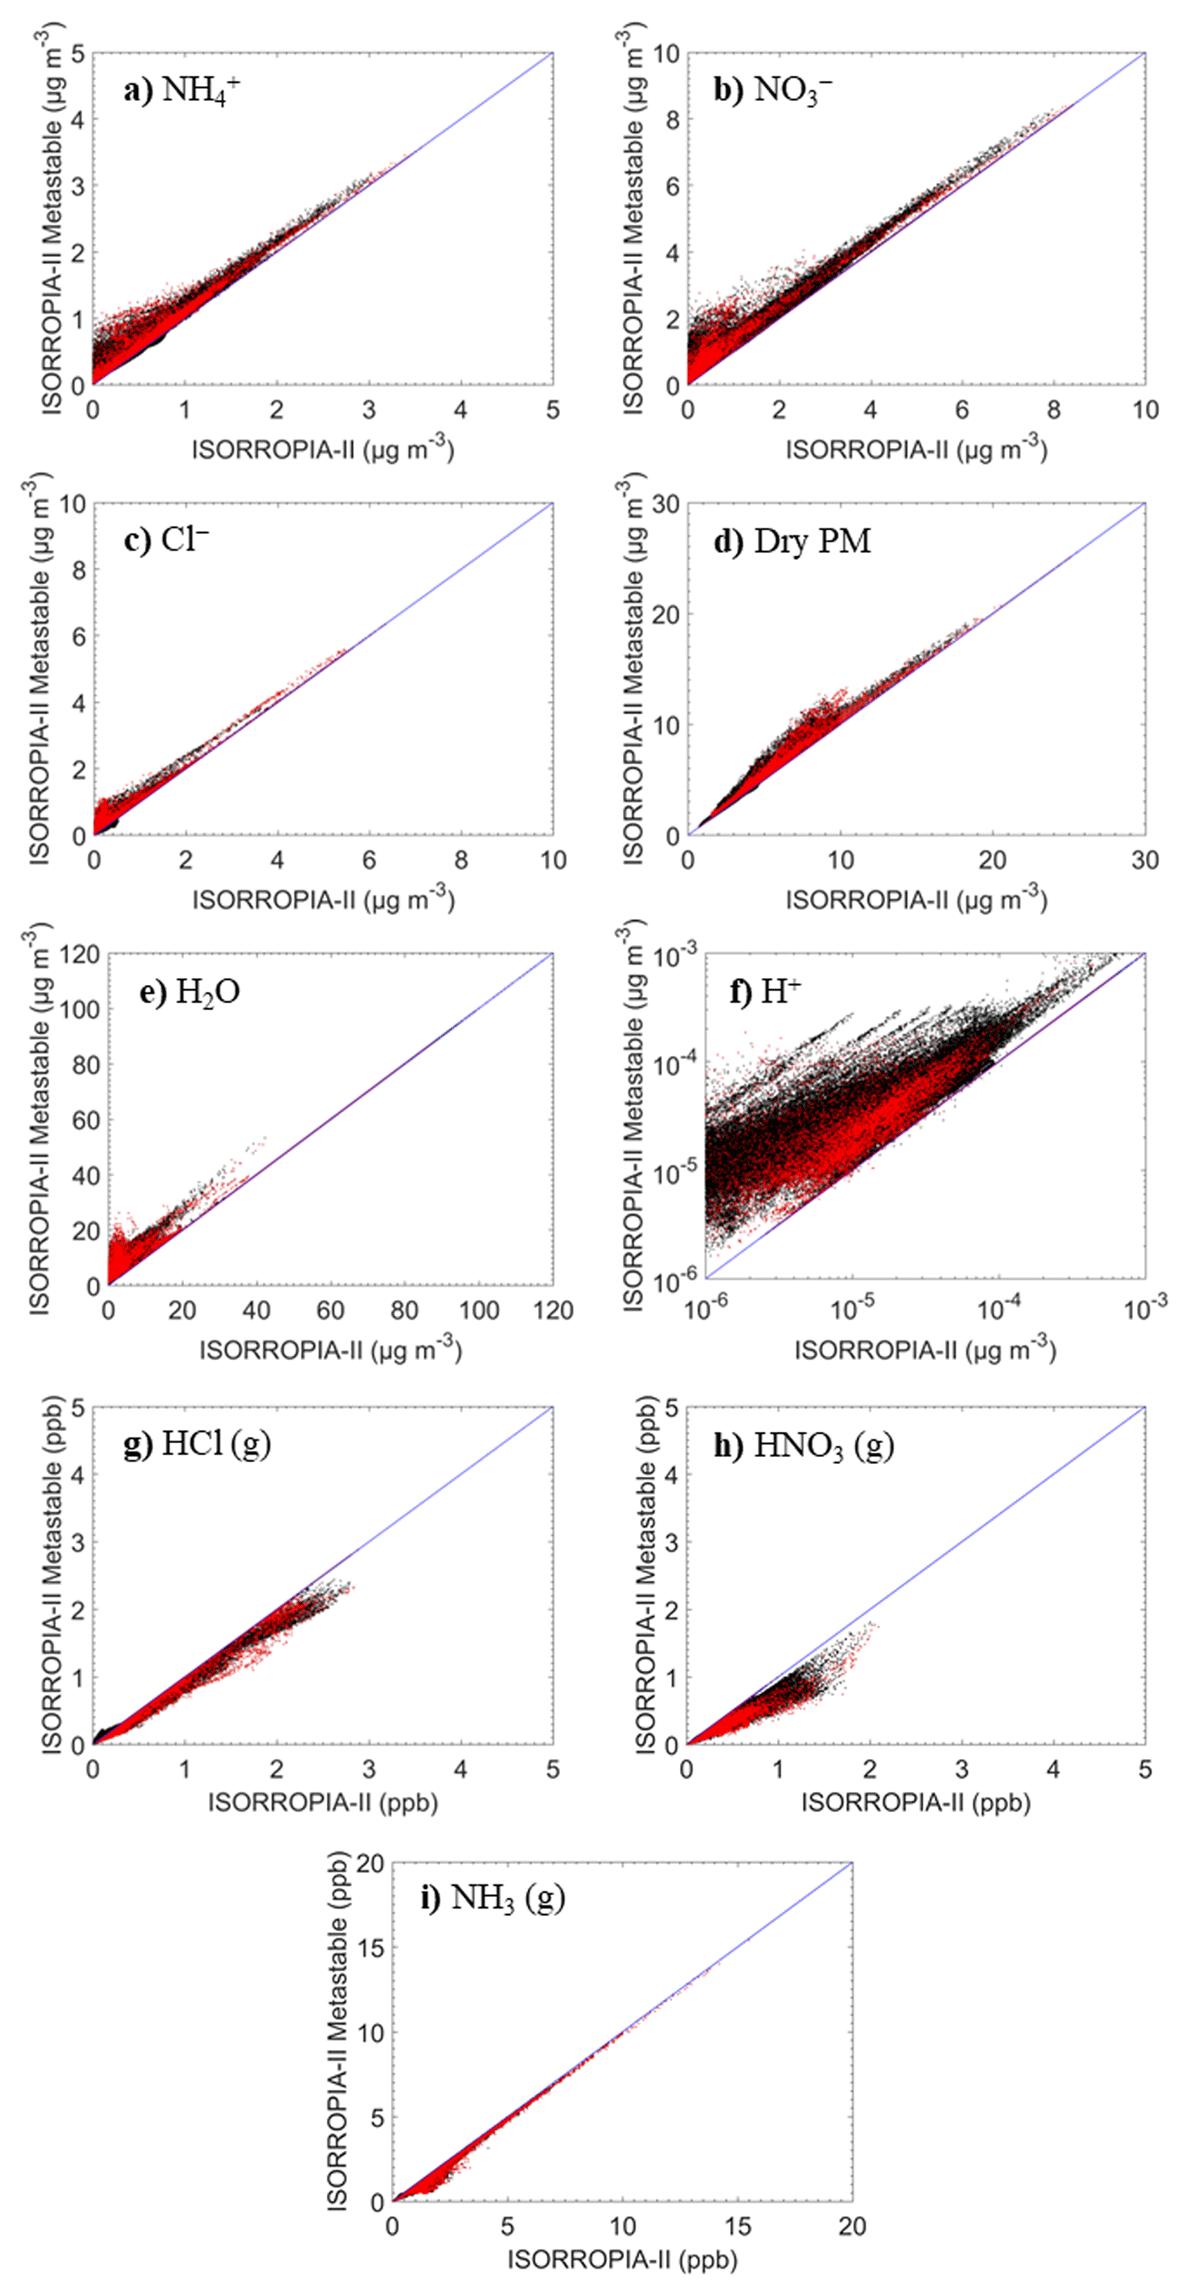
Figure 3
Comparison of the particulate and gas-phase concentrations predicted by ISORROPIA-II (with online binary activity coefficients calculation) in stable and metastable mode for the off-line simulations for the standard (black) and European (red) set of conditions: a) ammonium, b) nitrate, c) chloride, d) dry PM, e) water, f) hydrogen ion, g) hydrochloric acid, h) nitric acid, and i) ammonia. There are 331,520 points in these graphs.
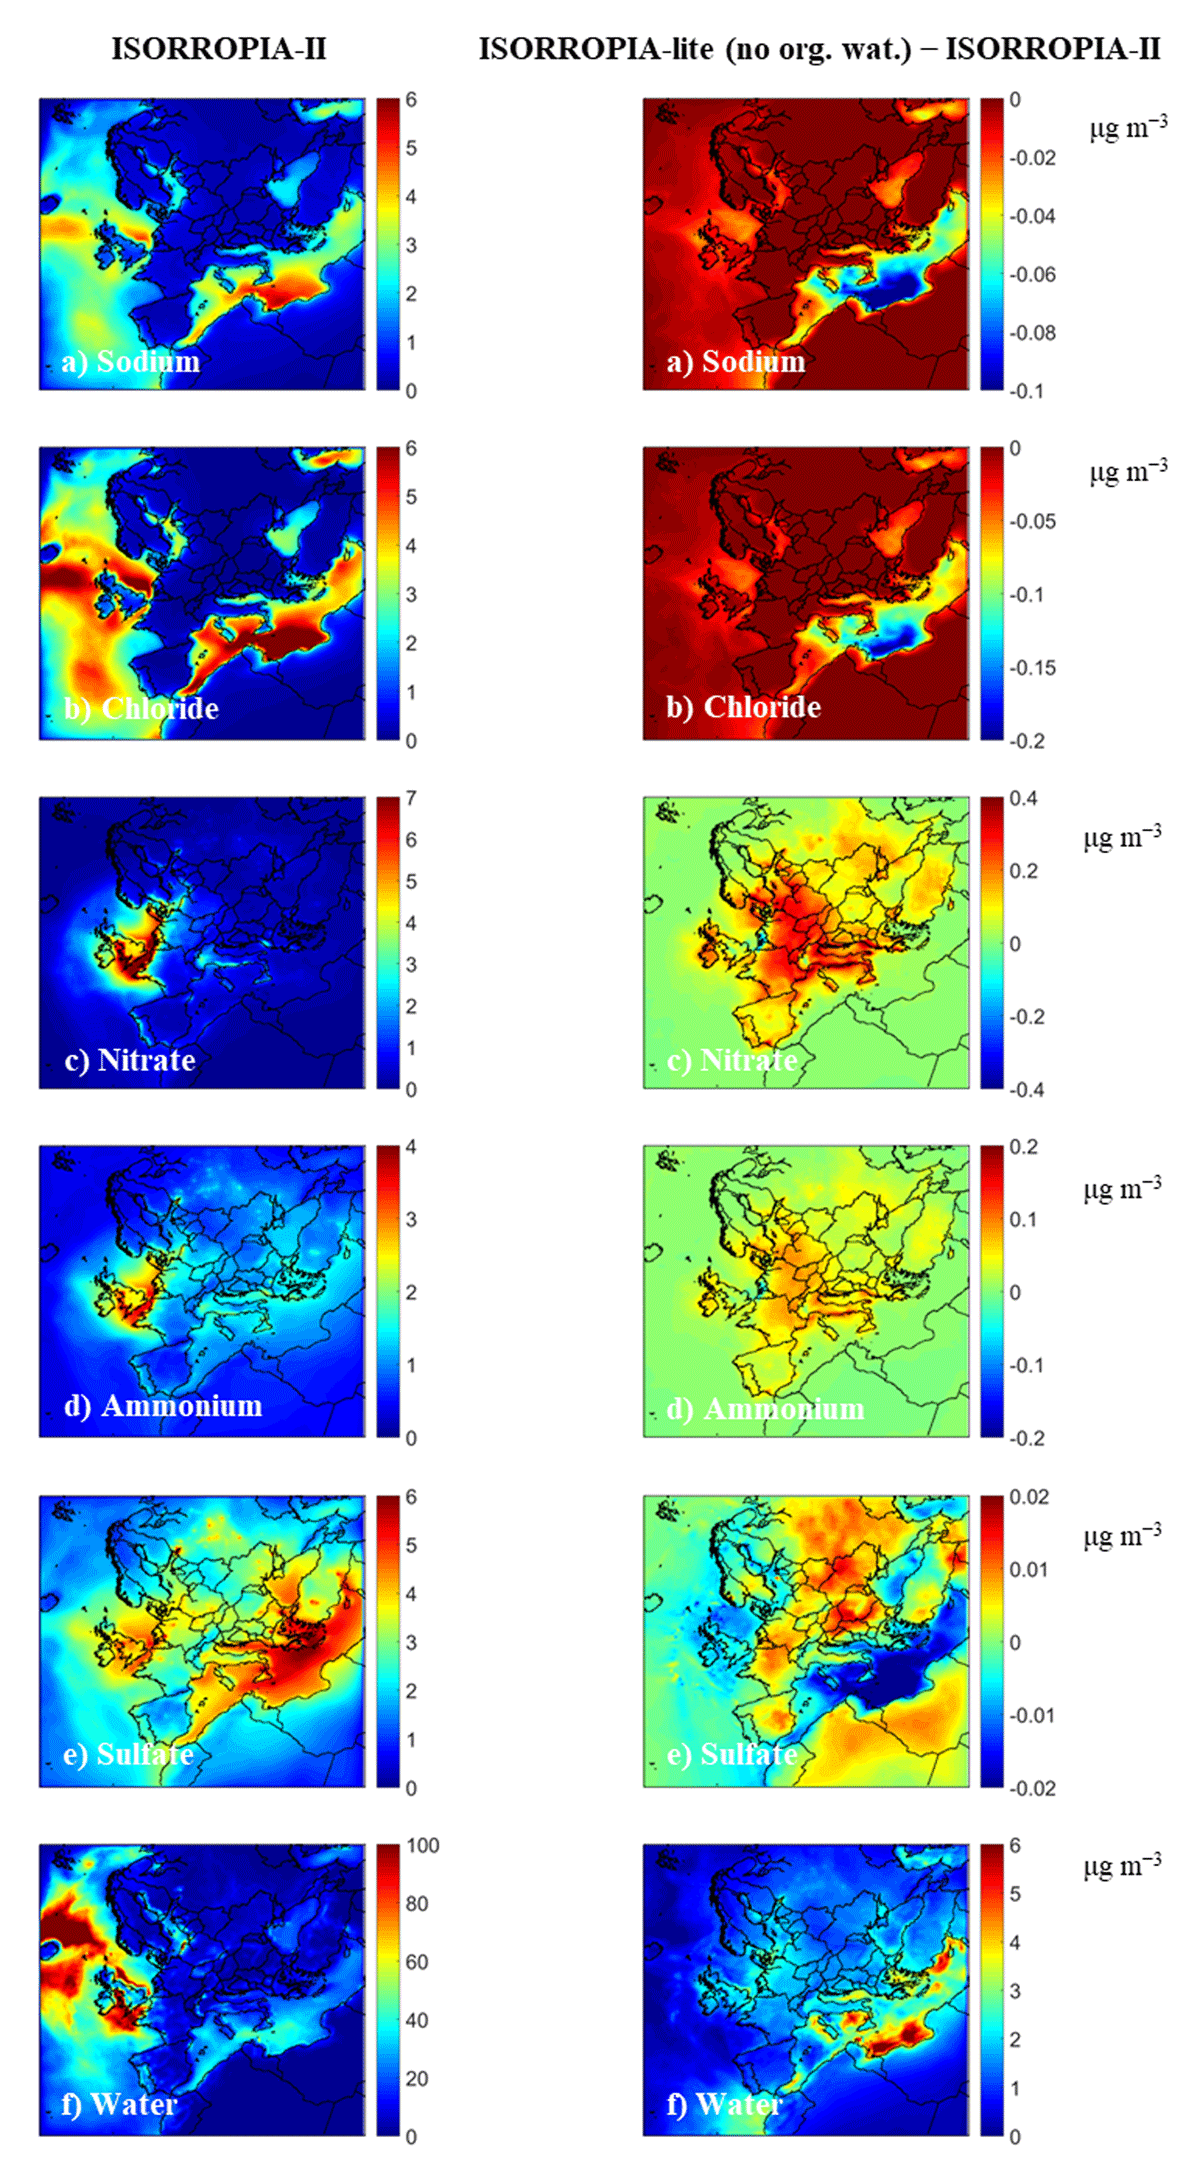
Figure 4
Average ground-level PM10 concentrations (in μg m–3) of a) sodium, b) chloride, c) nitrate, d) ammonium, e) sulfate, and f) water using ISORROPIA-II in stable mode with online calculation of binary activity coefficients and ISORROPIA-lite without organic water during May 2008.
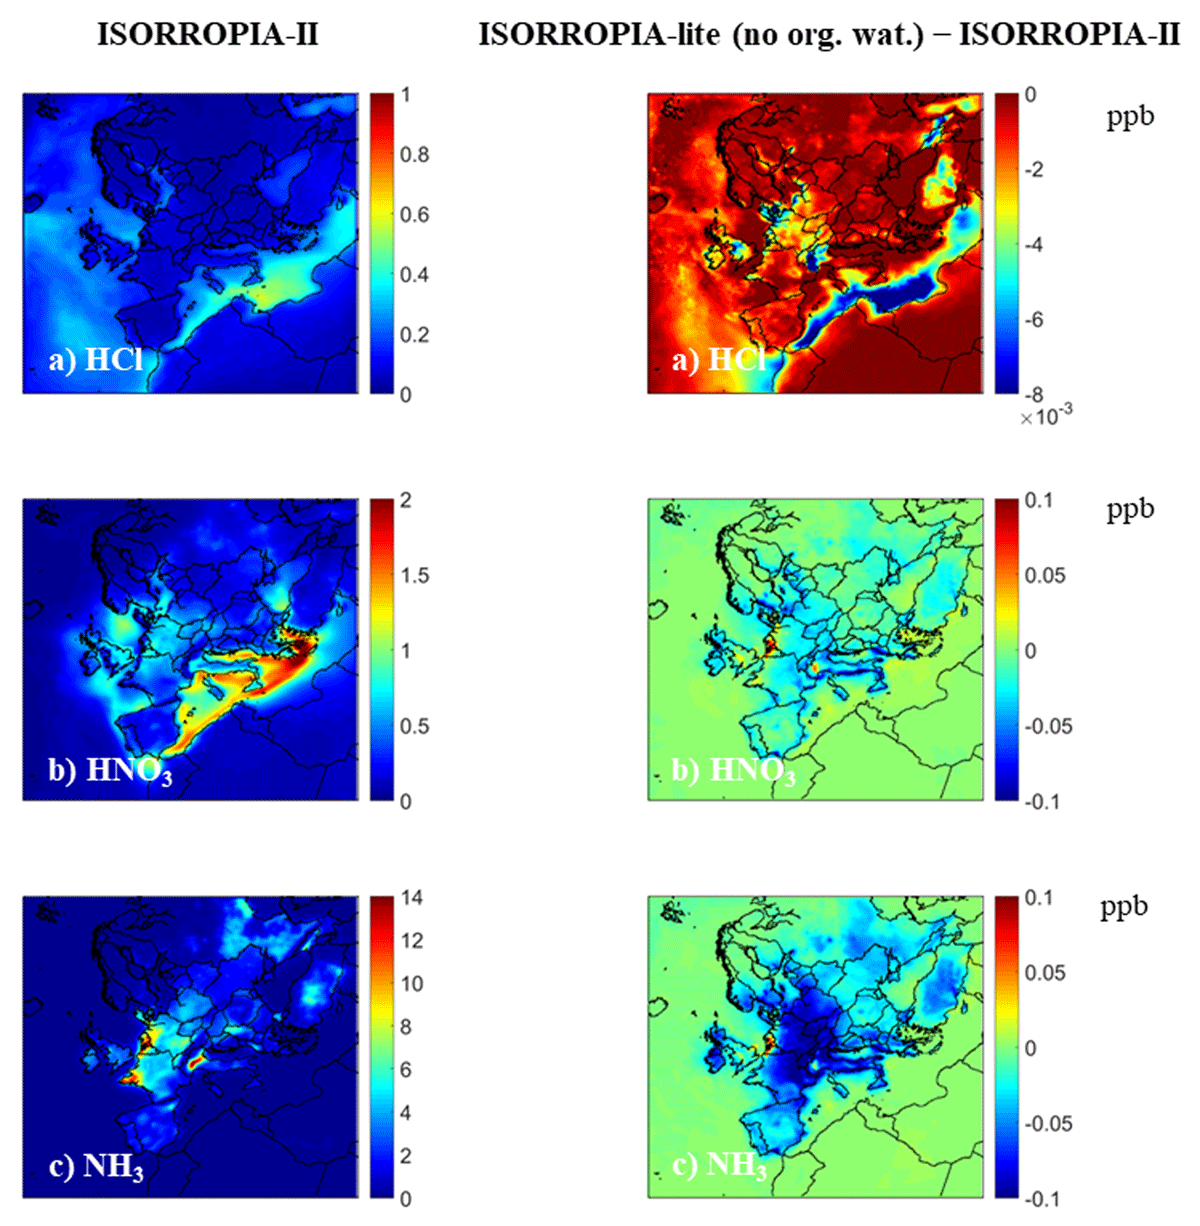
Figure 5
Average predicted ground-level concentrations (in ppb) of a) hydrochloric acid, b) nitric acid and c) ammonia using ISORROPIA-II in stable mode with online calculation of binary activity coefficients and ISORROPIA-lite without organic water during May 2008.
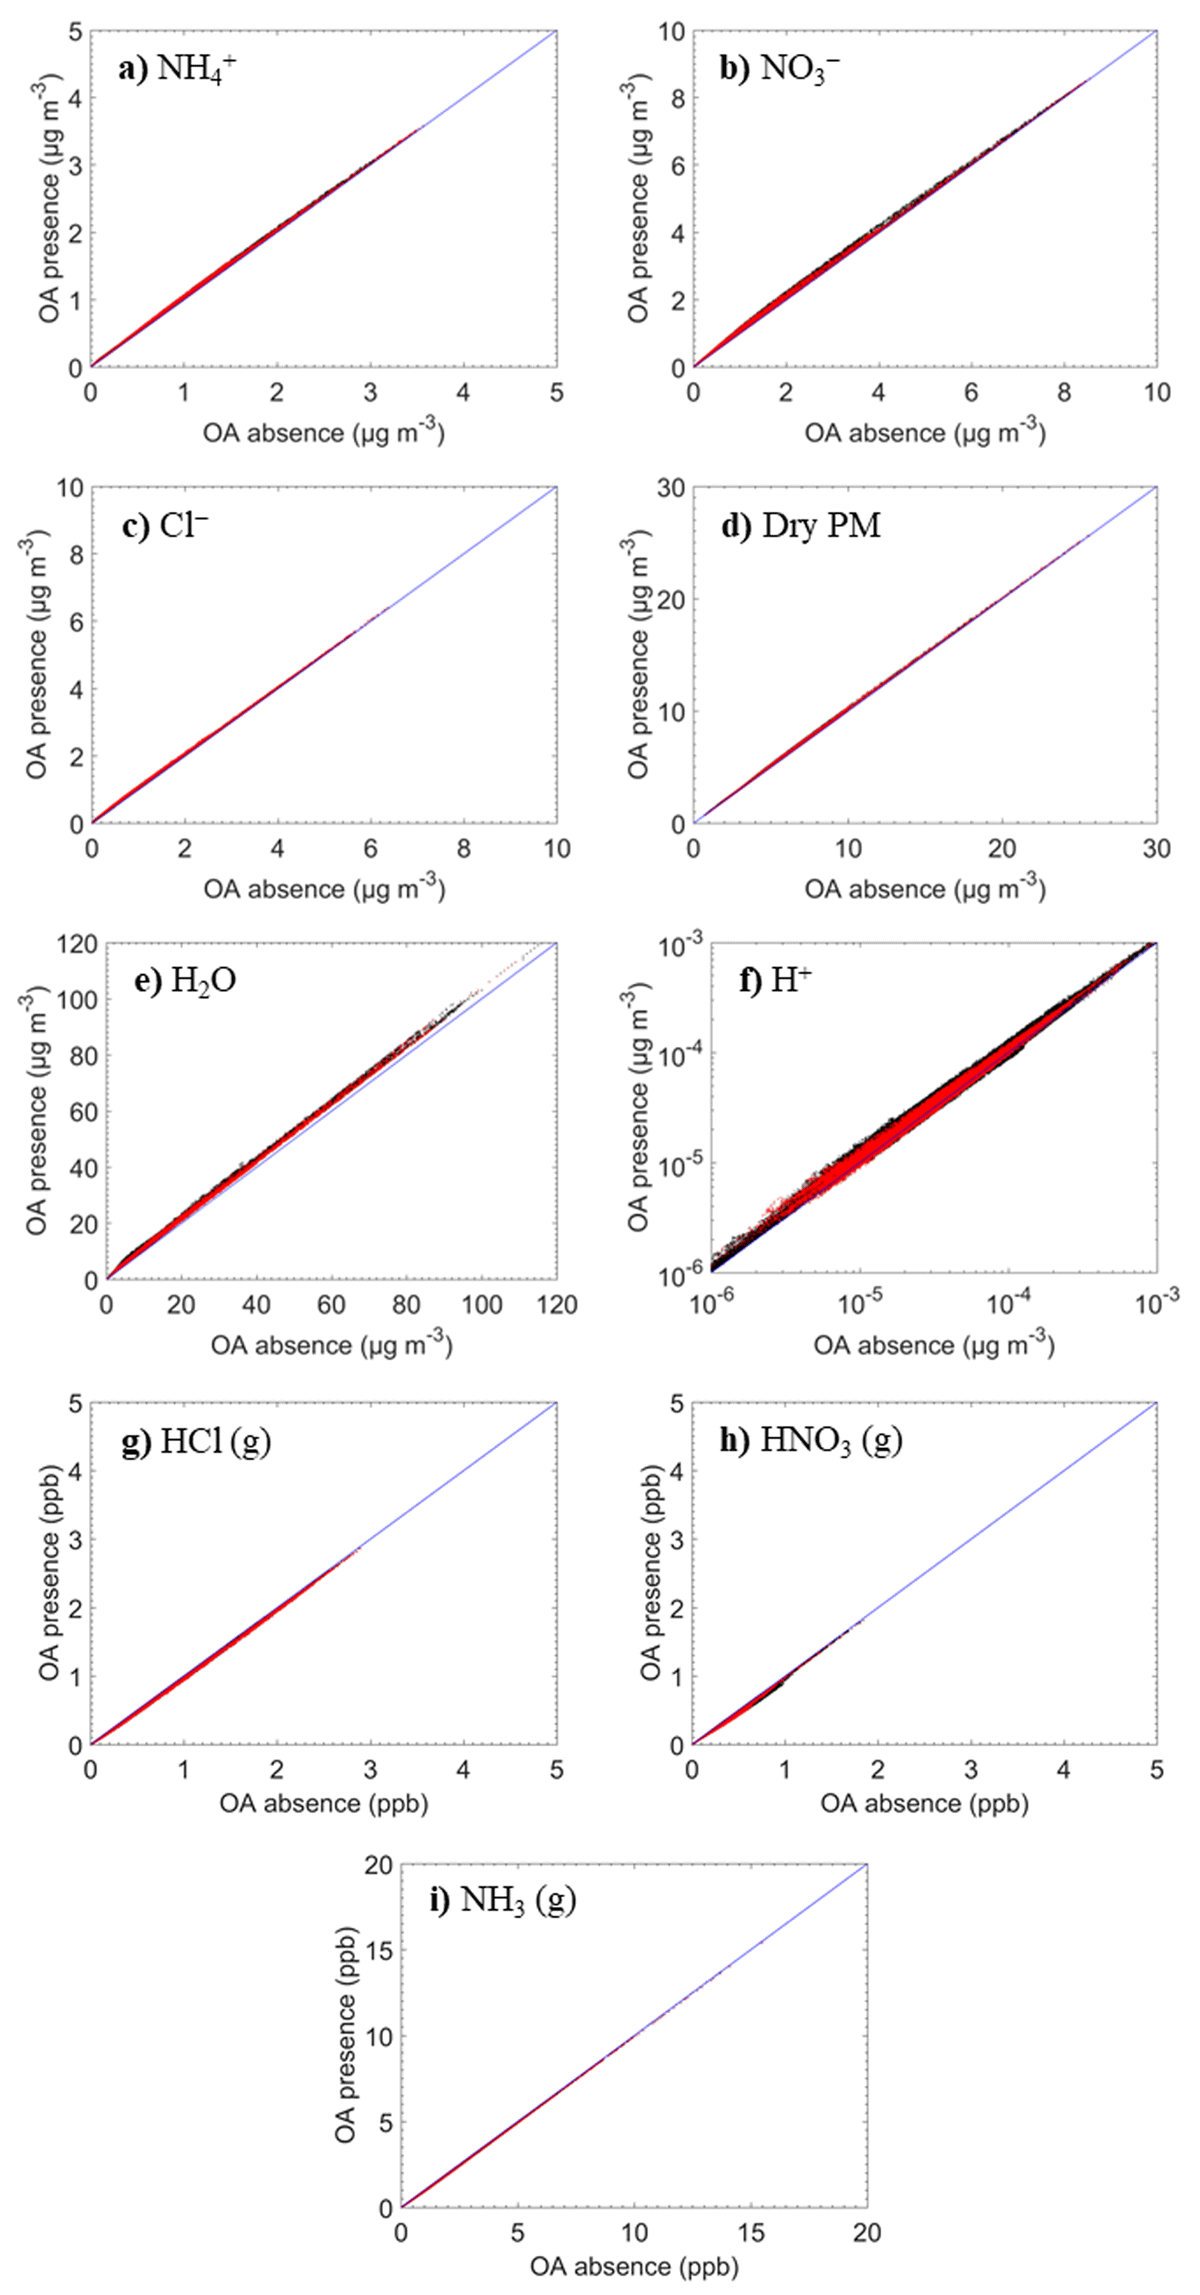
Figure 6
Comparison of the particulate and gas-phase concentrations predicted by ISORROPIA-lite when the organic aerosol water is present and absent for the off-line simulations for the standard (black) and European (red) set of conditions: a) ammonium, b) nitrate, c) chloride, d) dry PM, e) water, f) hydrogen ion, g) hydrochloric acid, h) nitric acid, and i) ammonia. There are 331,520 points in these graphs.
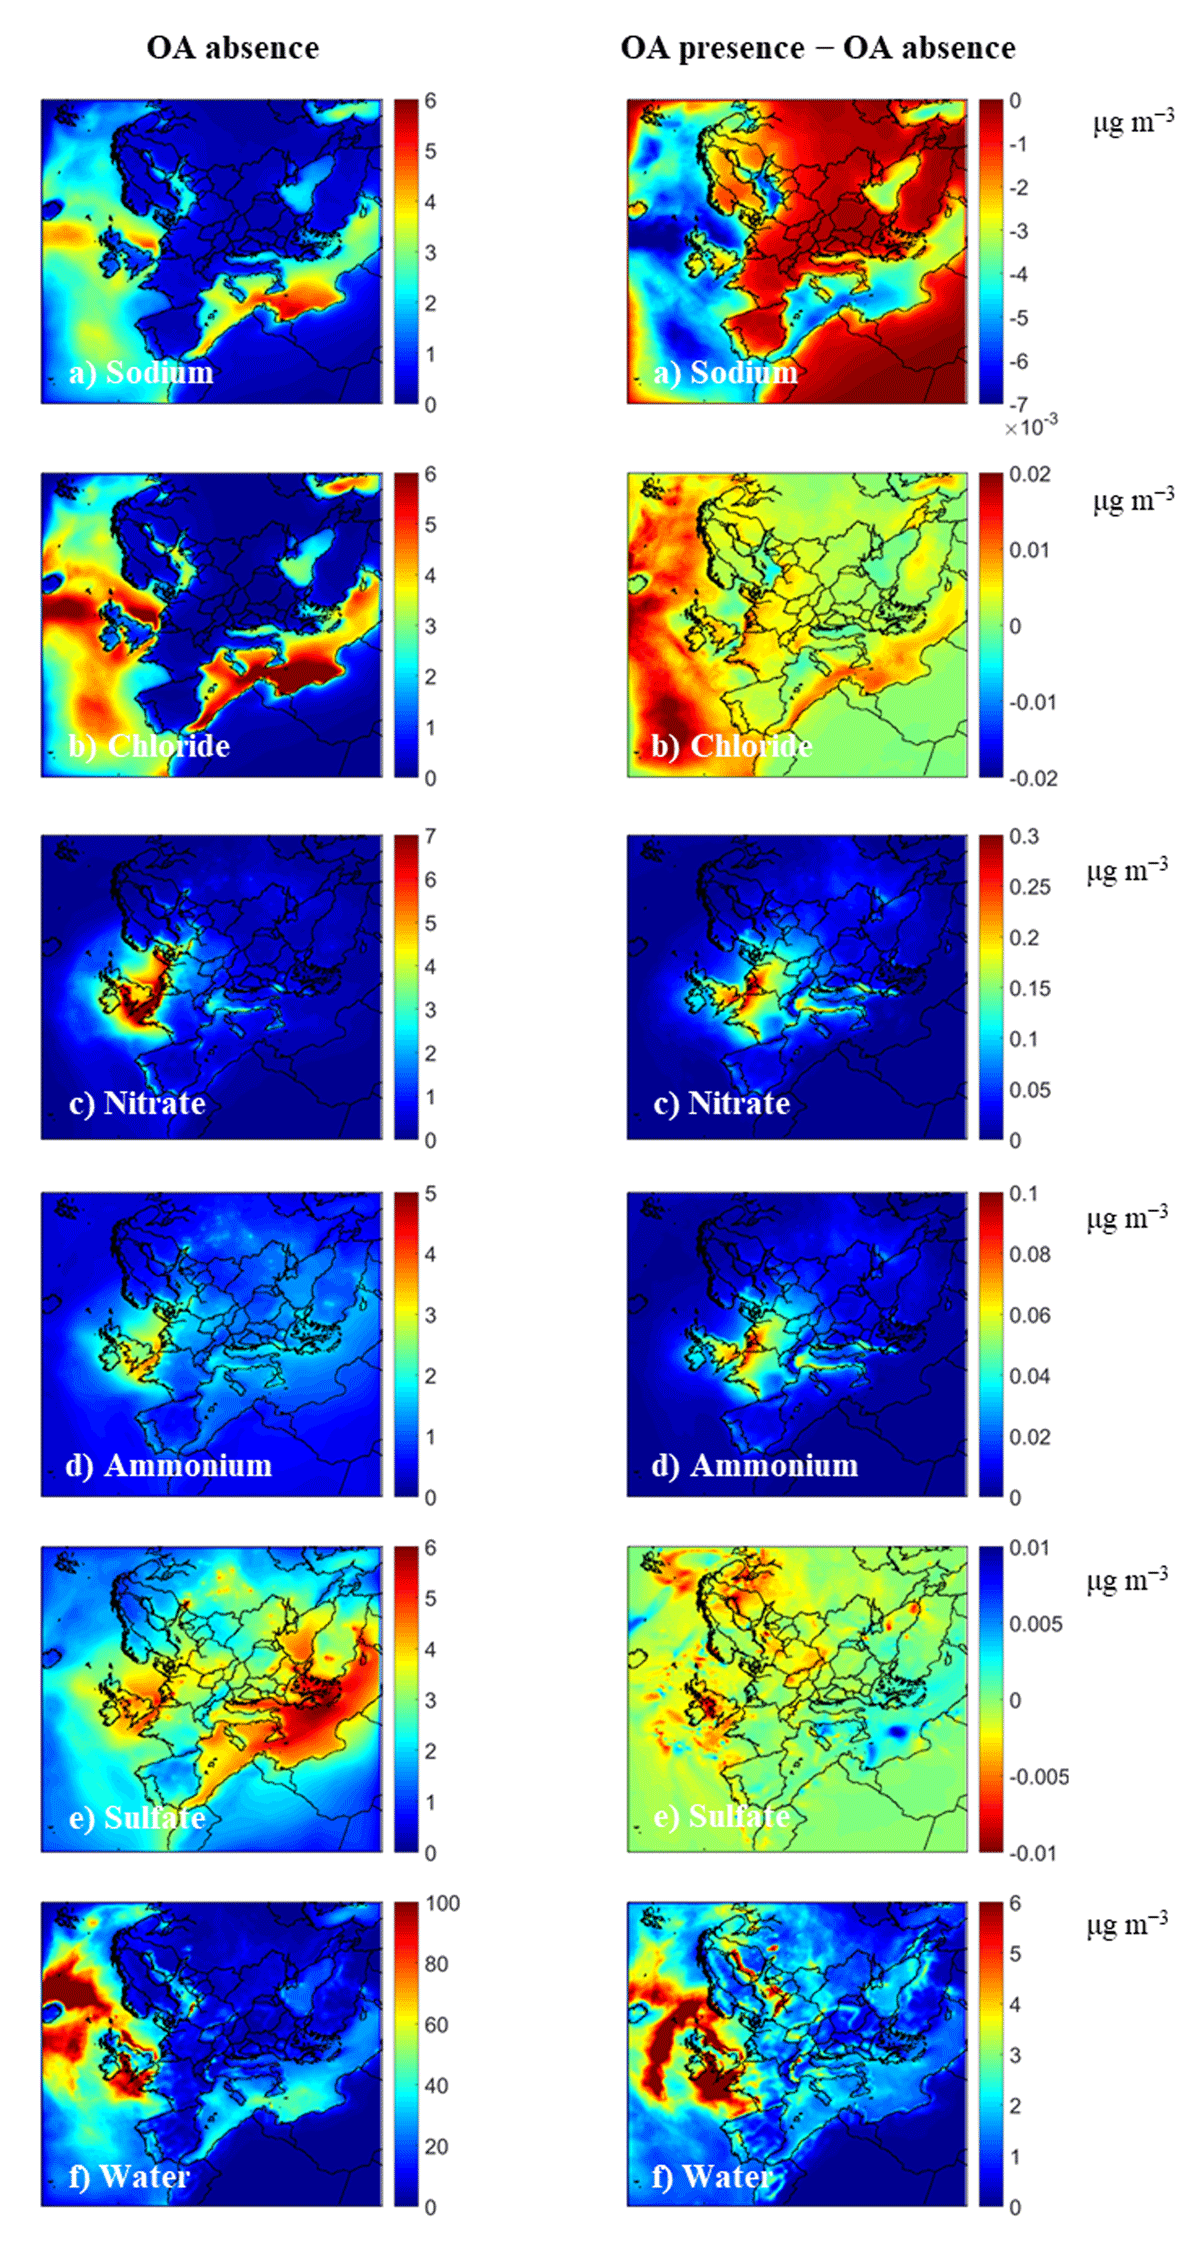
Figure 7
Average ground-level PM10 concentrations (in μg m–3) of a) sodium, b) chloride, c) nitrate, d) ammonium, e) sulfate, and f) water using ISORROPIA-lite when the organic aerosol water is absent and present in the simulation during May 2008.
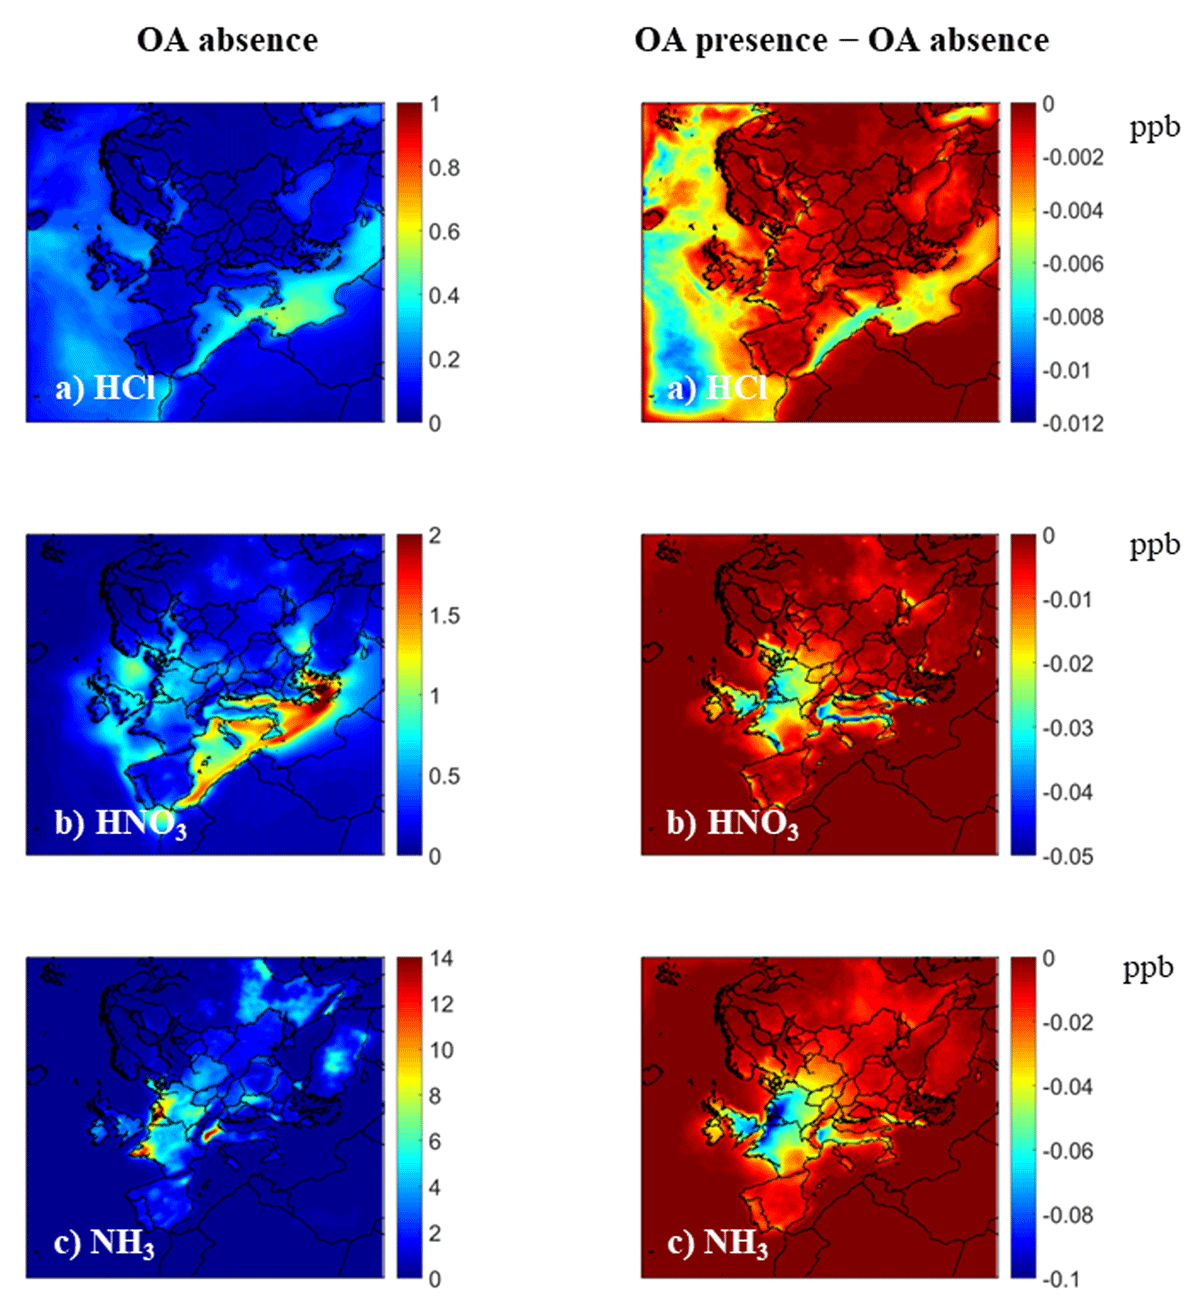
Figure 8
Average predicted ground-level concentrations (in ppb) of a) hydrochloric acid, b) nitric acid and c) ammonia using ISORROPIA-lite when the organic aerosol water is absent and present in the simulation during May 2008.
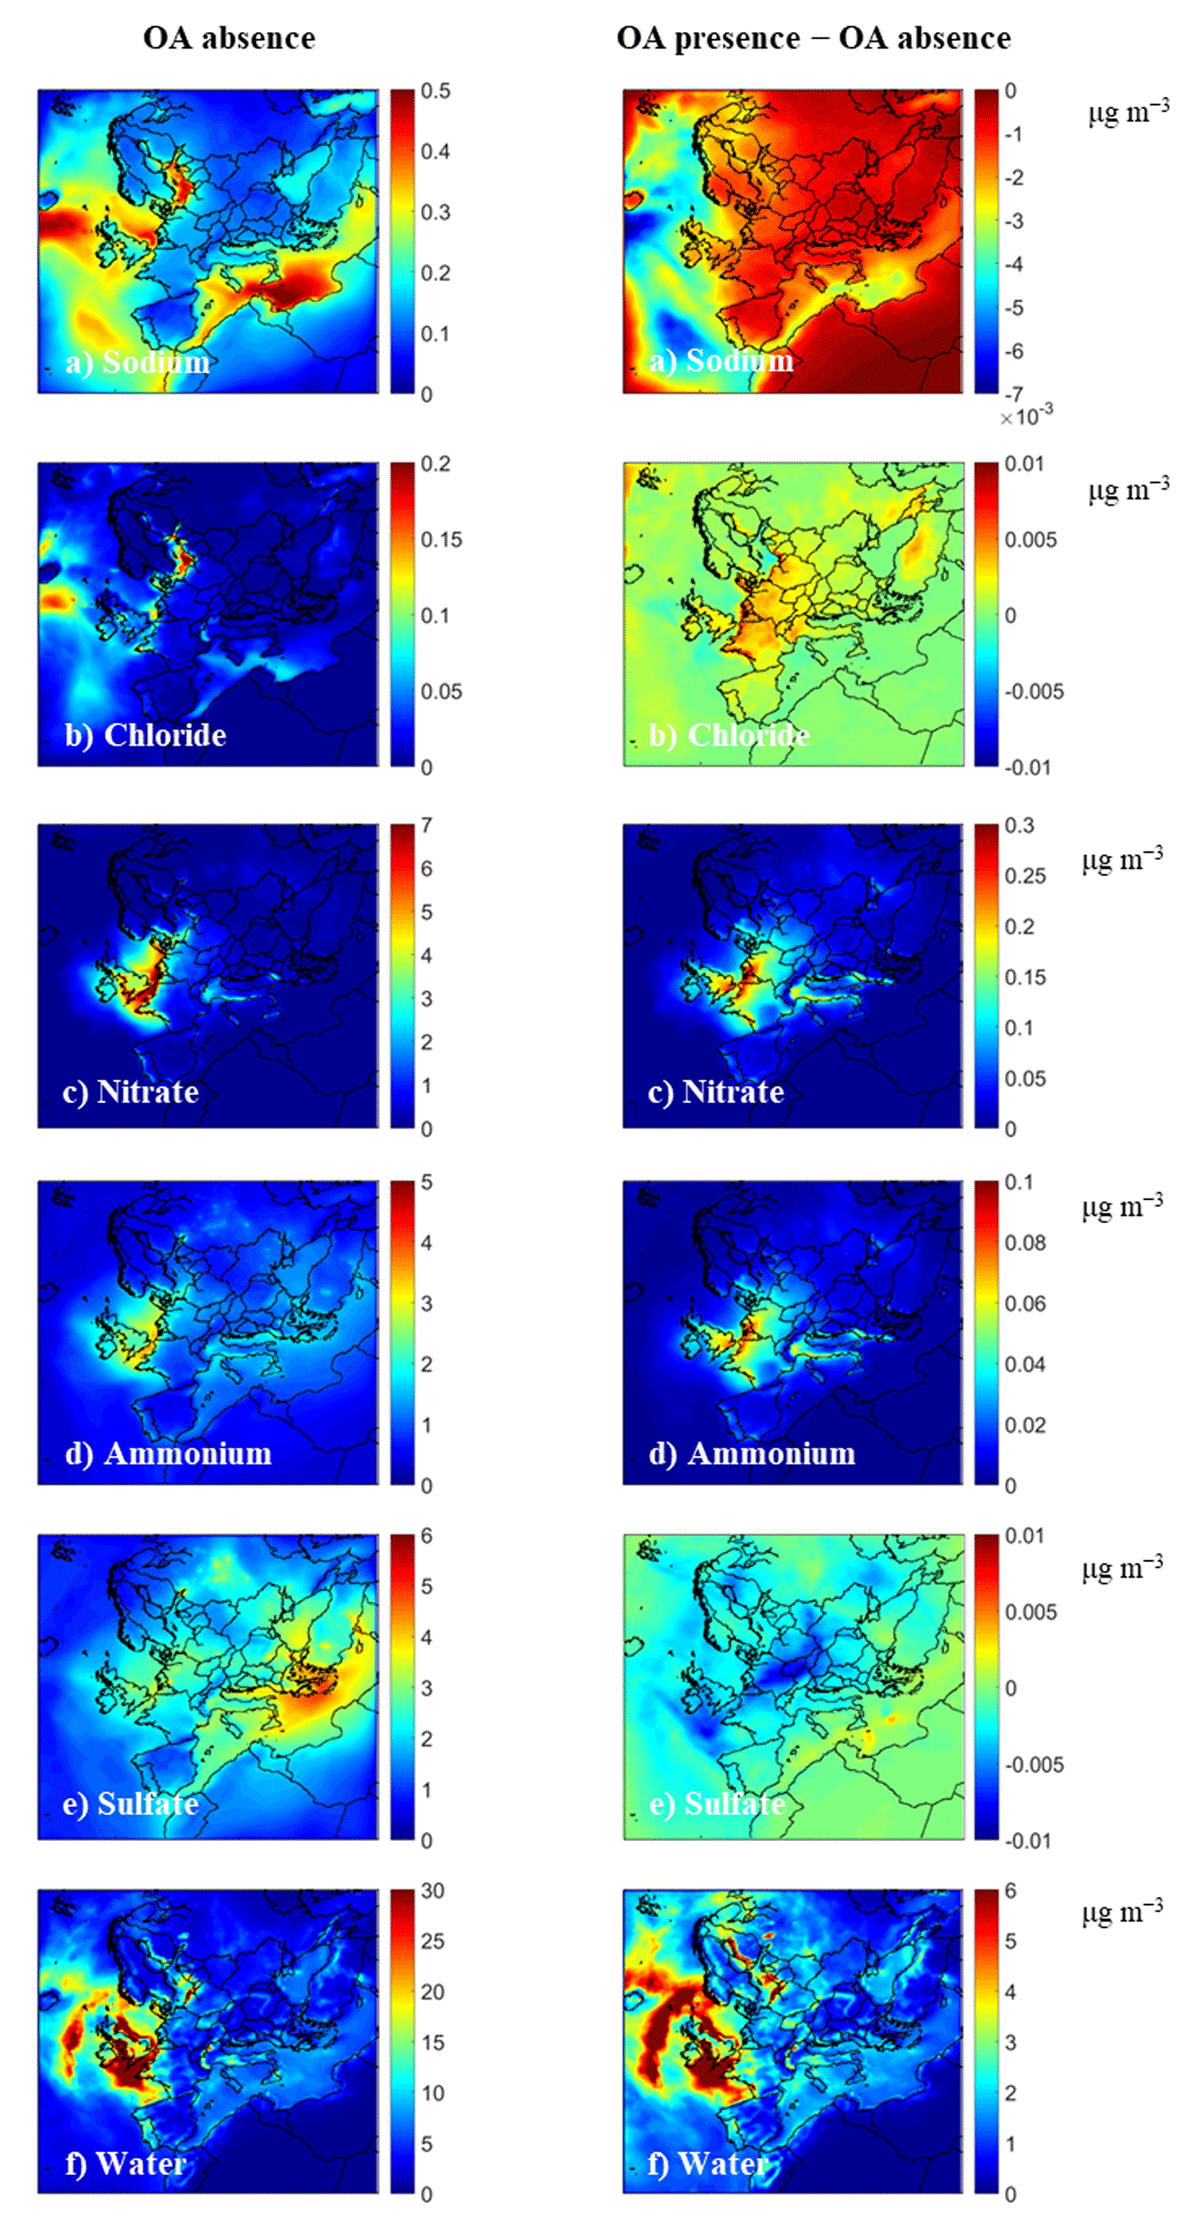
Figure 9
Average ground-level PM1 concentrations (in μg m–3) of a) sodium, b) chloride, c) nitrate, d) ammonium, e) sulfate, and f) water using ISORROPIA-lite when the organic aerosol water is absent and present in the simulation during May 2008.
Table 3
Characteristics of the four selected sites.
| SITE | TYPE OF SITE | SOA LEVELS | AMMONIUM LEVELS | NITRATE LEVELS | SULFATE LEVELS | RH LEVELS | LOCATION IN EUROPE |
|---|---|---|---|---|---|---|---|
| Finokalia, Greece | Remote | High | Modest | Low | High | High | South |
| Cabauw, Netherlands | Rural | High | High | High | High | High | North |
| Melpitz, Germany | Rural | High | Modest | High | High | High | North |
| Paris, France | Urban | High | Modest | High | High | High | West |
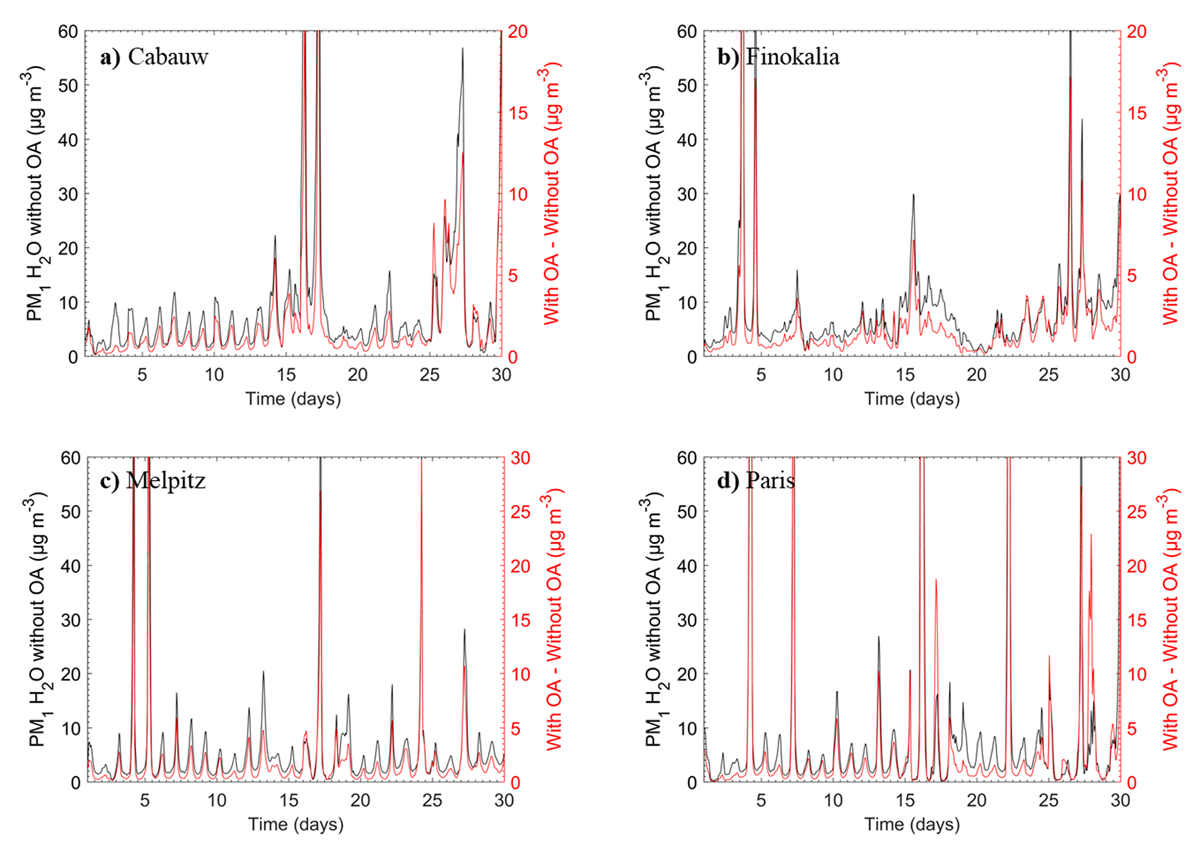
Figure 10
PM1 water concentration (in μg m–3) when the organic aerosol water is absent (black) and the corresponding concentration difference when is present (red) in the simulation for a) Cabauw, Netherlands; b) Finokalia, Greece; c) Melpitz, Germany; and d) Paris, France during May 2008.
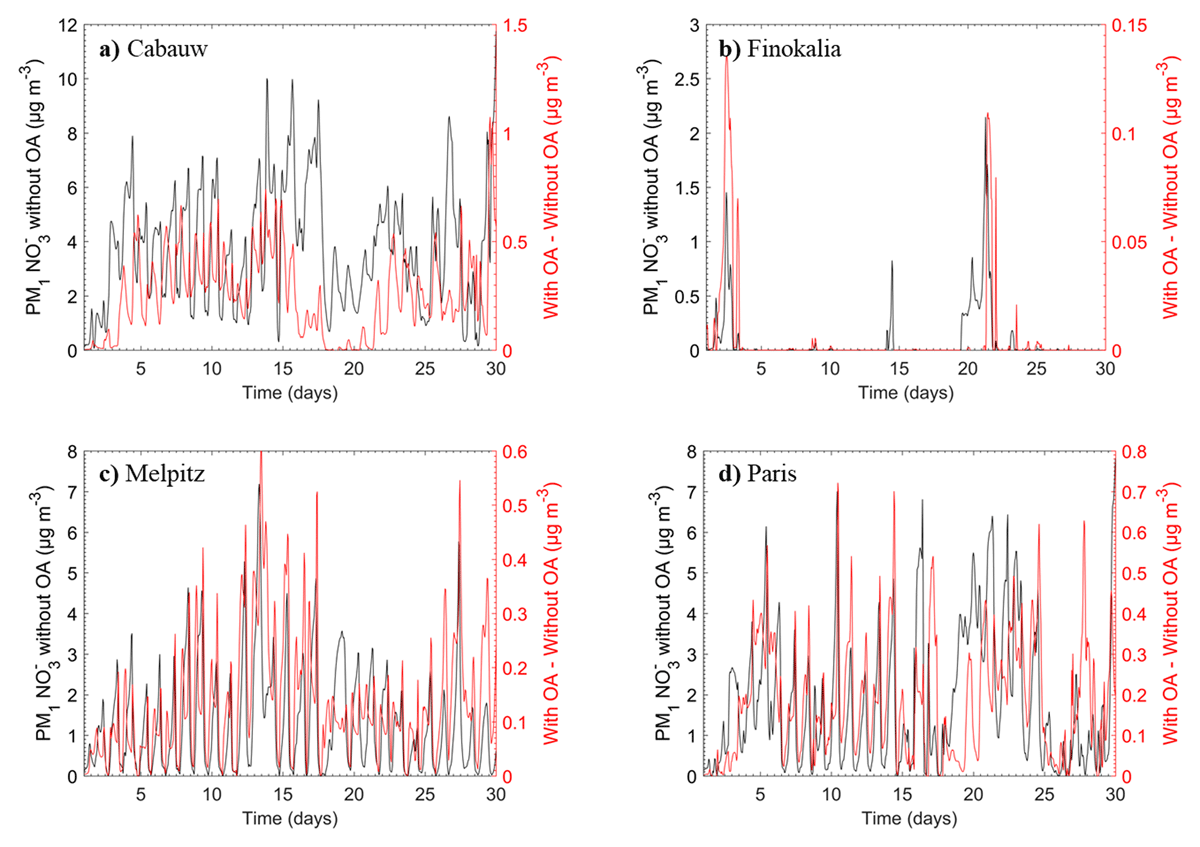
Figure 11
PM1 nitrate concentration (in μg m–3) when the organic aerosol water is absent (black) and the corresponding concentration difference when is present (red) in the simulation for a) Cabauw, Netherlands; b) Finokalia, Greece; c) Melpitz, Germany; and d) Paris, France during May 2008.
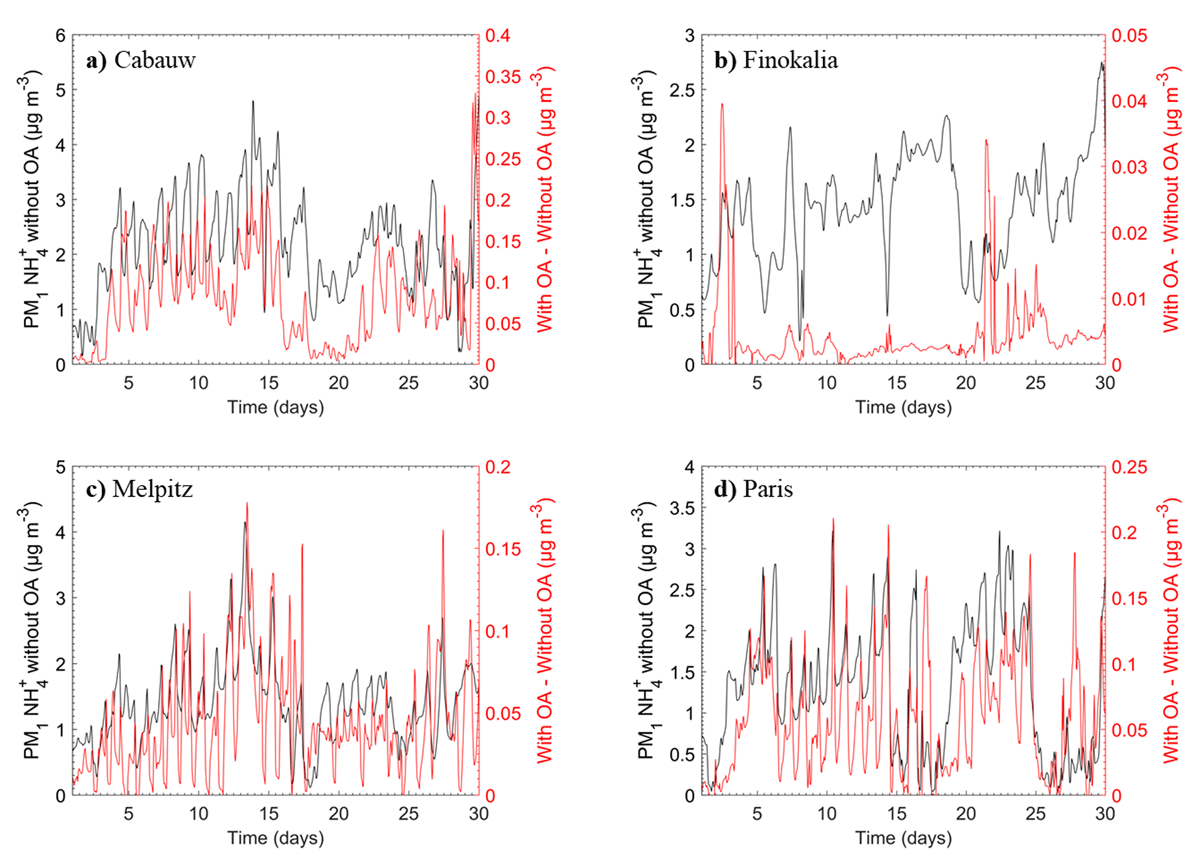
Figure 12
PM1 ammonium concentration (in μg m–3) when the organic aerosol water is absent (black) and the corresponding concentration difference when is present (red) in the simulation for a) Cabauw, Netherlands; b) Finokalia, Greece; c) Melpitz, Germany; and d) Paris, France during May 2008.