
| Charney+ mode: | A = 0.25, B = 1, 1/C = 0.6 for l = 1, k = 2 |
| Green mode: | A = 0.25, B = 1, 1/C = 0.4 for l = 1, k = 1 |
| Tropopause mode: | A = 0.25, B = 1, 1/C = 0.08 for l = 1, k = 4 |
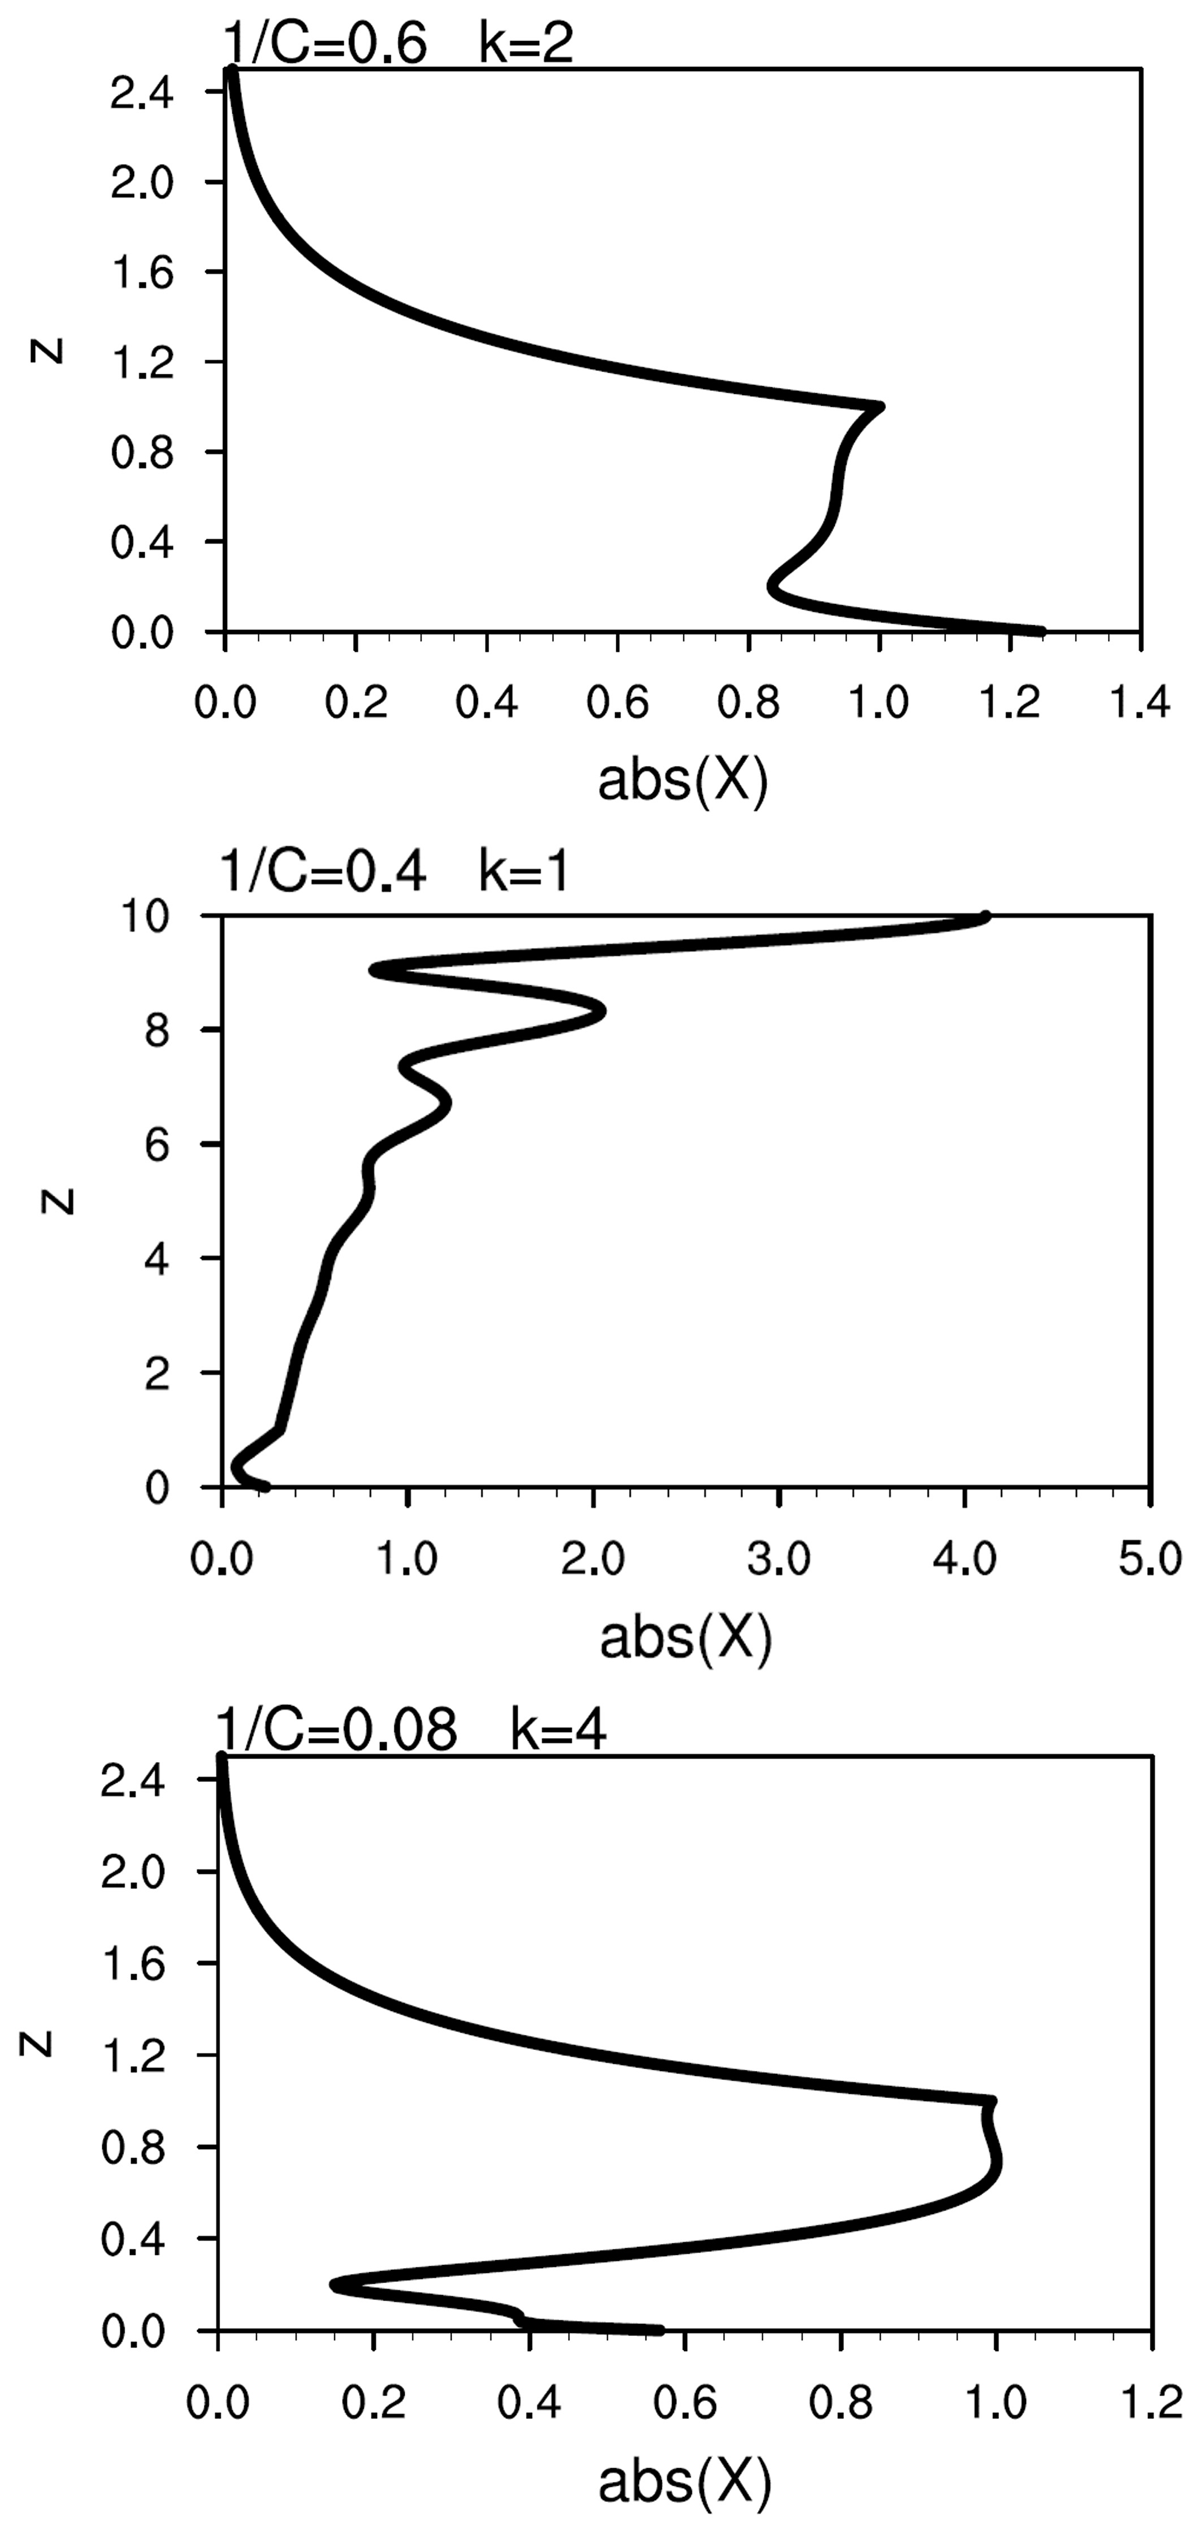
Figure 1
Vertical variation of the magnitude of the eigenfunction χ of (top) Charney+ mode, (middle) Green mode and (bottom) Tropopause mode. Charney+ and Tropopause modes are shown from z = 0 to 2.5; their values are virtually zero higher up. Green mode is shown from z = 0 to 10.
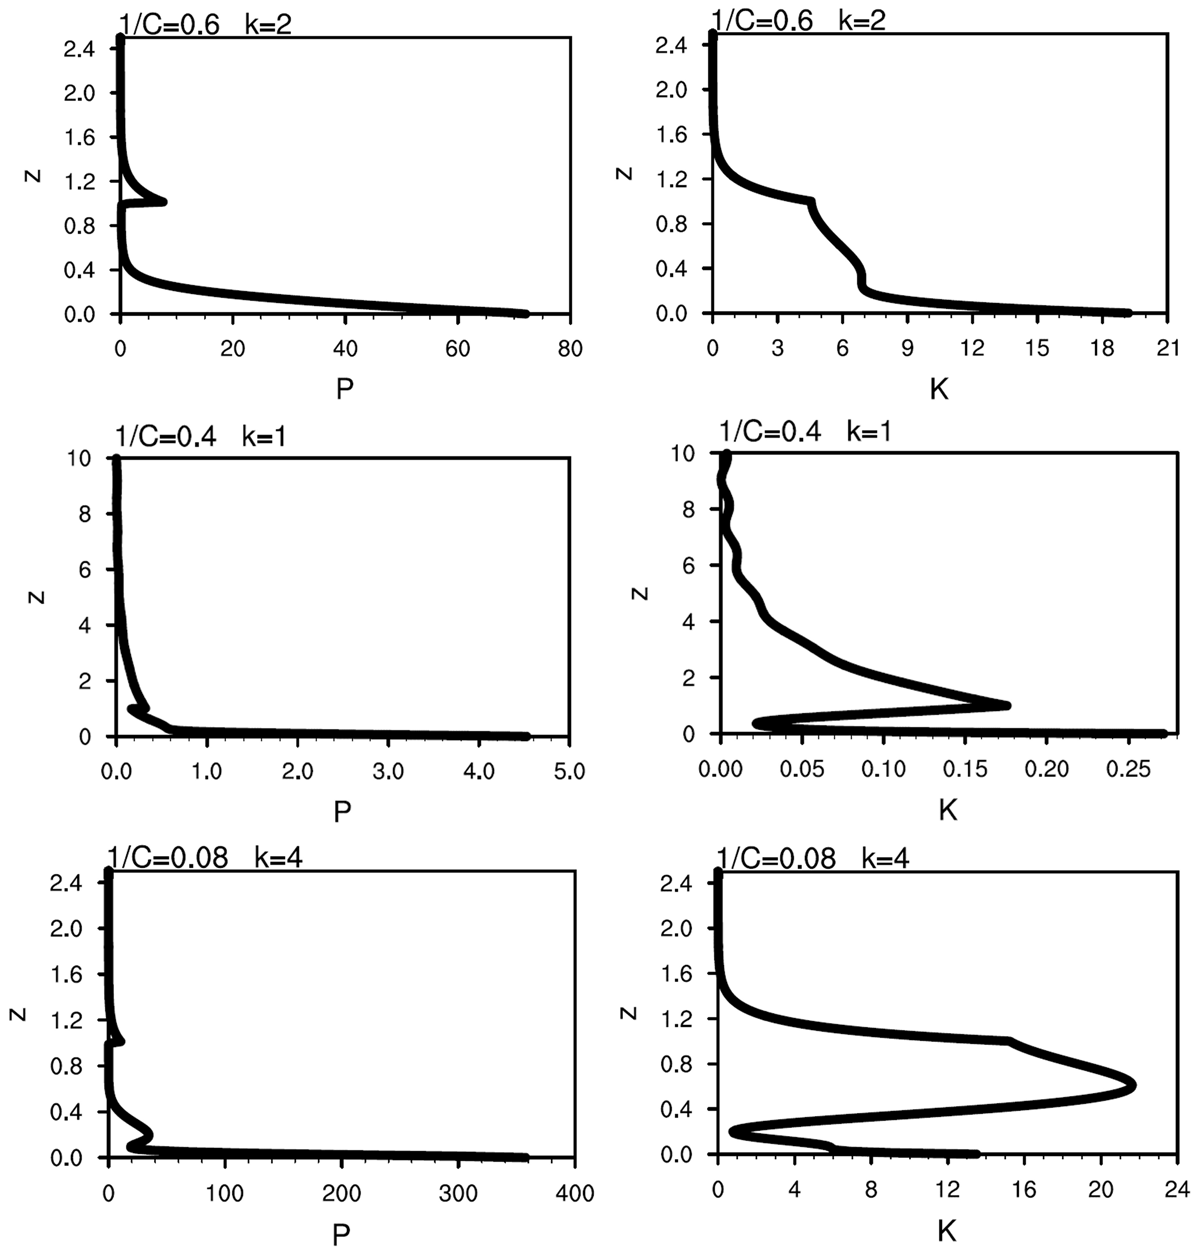
Figure 2
Vertical distribution of the non-dimensional horizontal integrated eddy available potential energy EAPE, P*, for (top-left) Charney+ mode, (mid-left) Green mode and (bot-left) Tropopause mode ; That of the eddy kinetic energy EKE, K*, for (top-right) Charney+ mode, (mid-right) Green mode and (bot-right) Tropopause mode. The non-dimensional parameters, 1/C and k, associated with these modes are indicated at the top of each panel with the remaining parameters having common values: l = 1, A = 0.25, B = 1. Charney+ and Tropopause modes are shown from z = 0 to 2.5; their values are virtually zero higher up. Green mode is shown from z = 0 to 10.
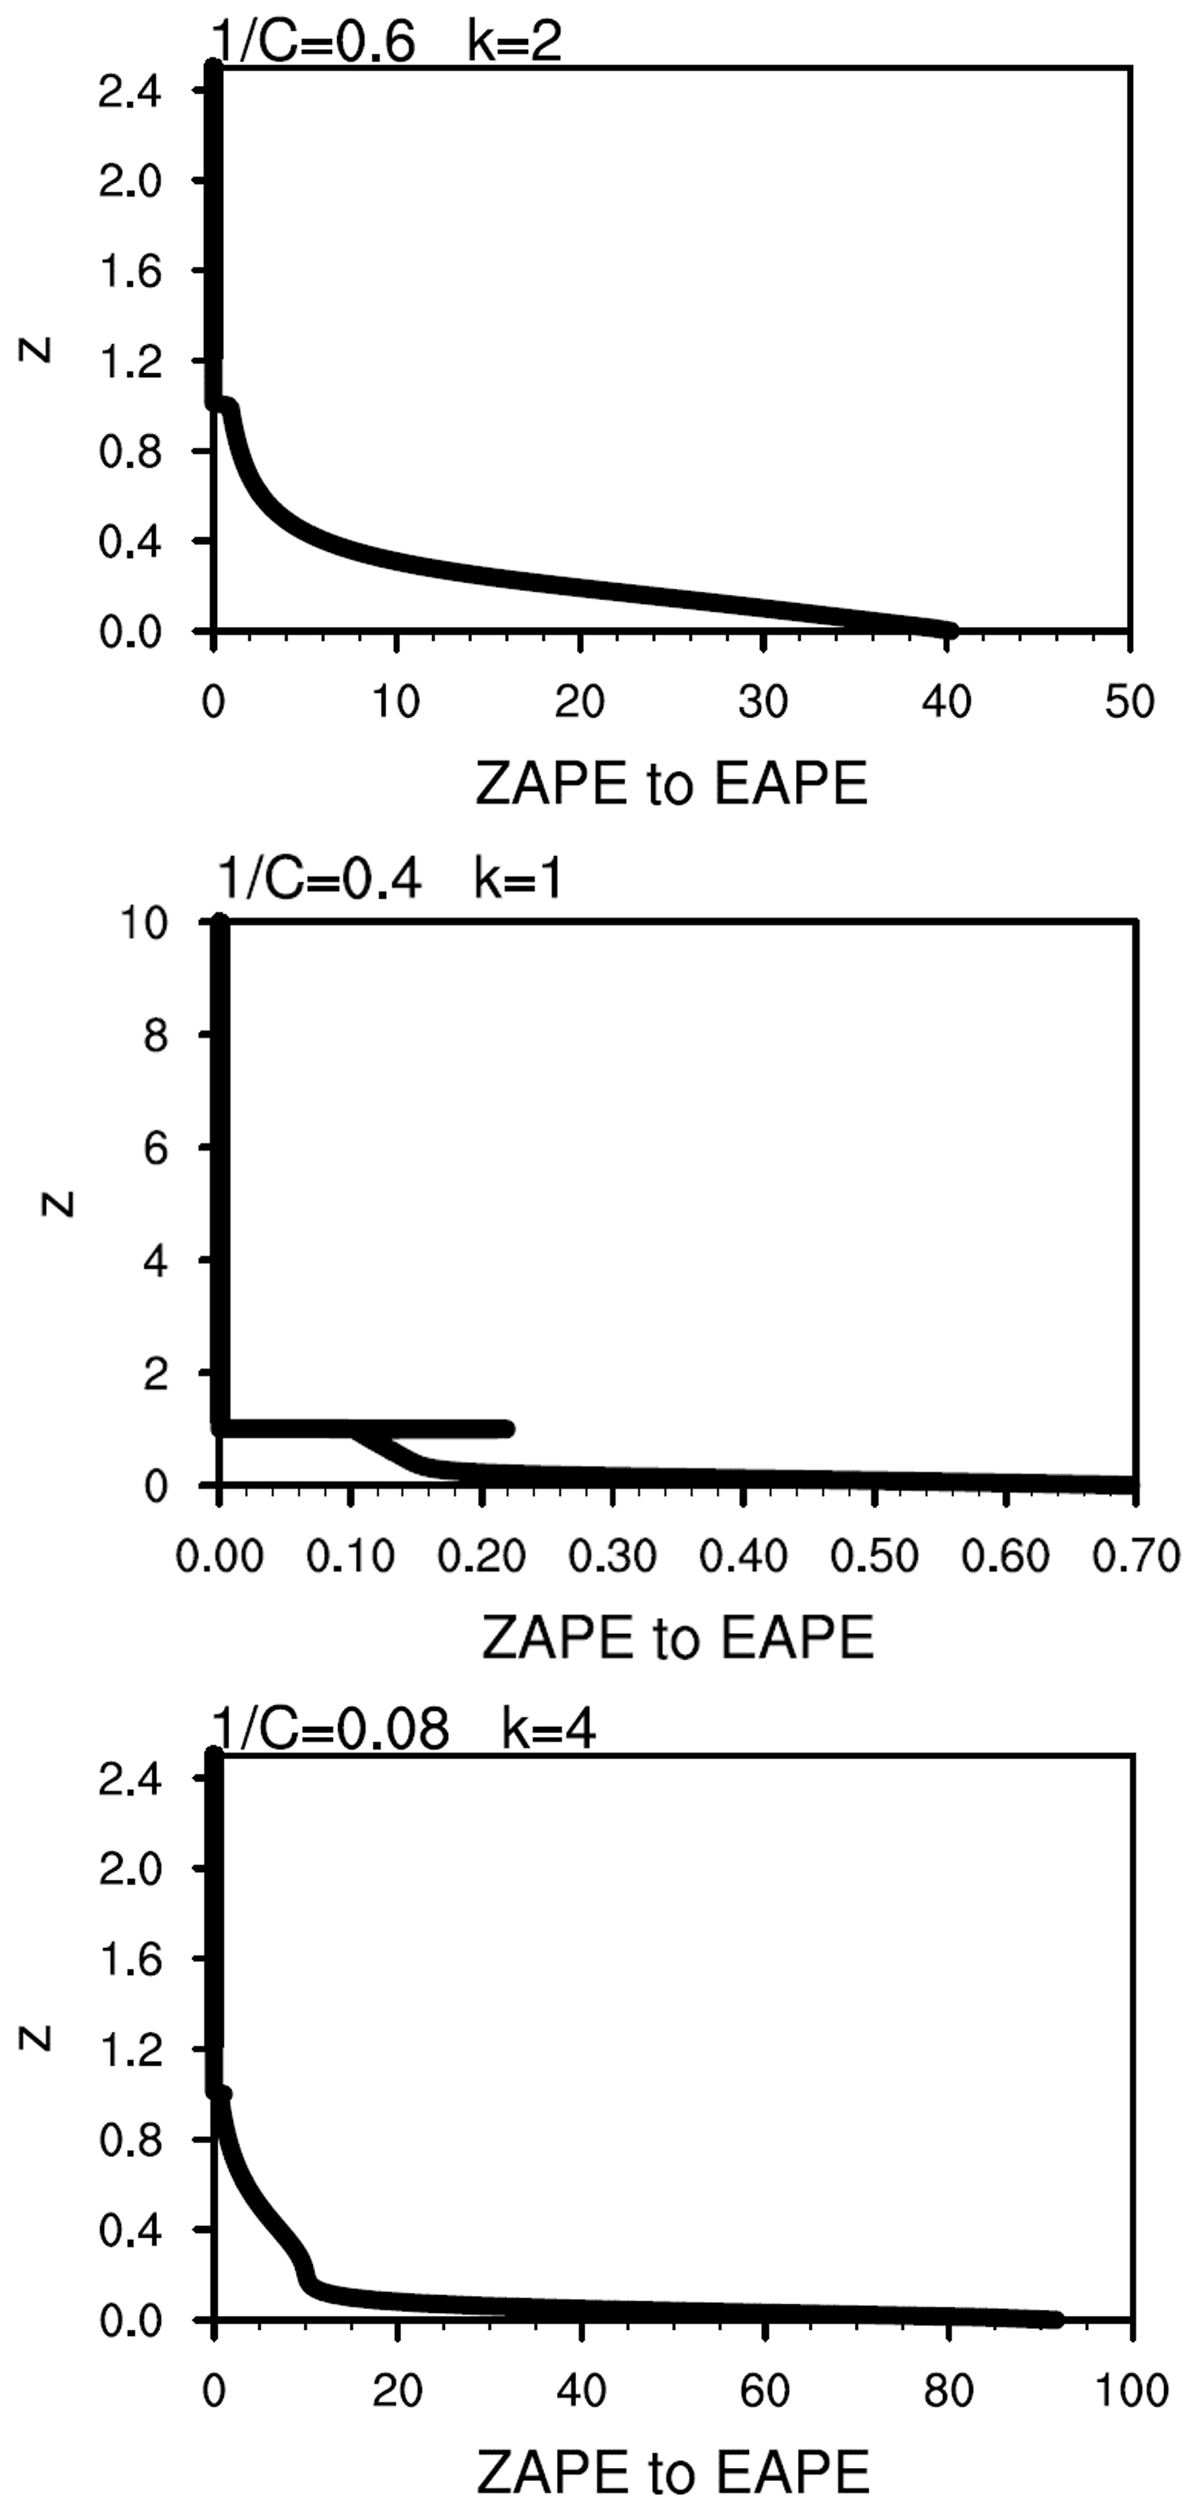
Figure 3
Vertical distribution of the non-dimensional horizontal integrated conversion rate from the basic available potential energy ZAPE to eddy available potential energy EAPE, for Charney+ mode (top), Green mode (middle) and Tropopause mode (bottom). The non-dimensional parameters, 1/C and k, associated with these modes are indicated at the top of each panel with l = 1, A = 0.25, B = 1, as the common values of the remaining parameters. Charney+ and Tropopause modes are shown from z = 0 to 2.5; their values are virtually zero higher up. Green mode is shown from z = 0 to 10.
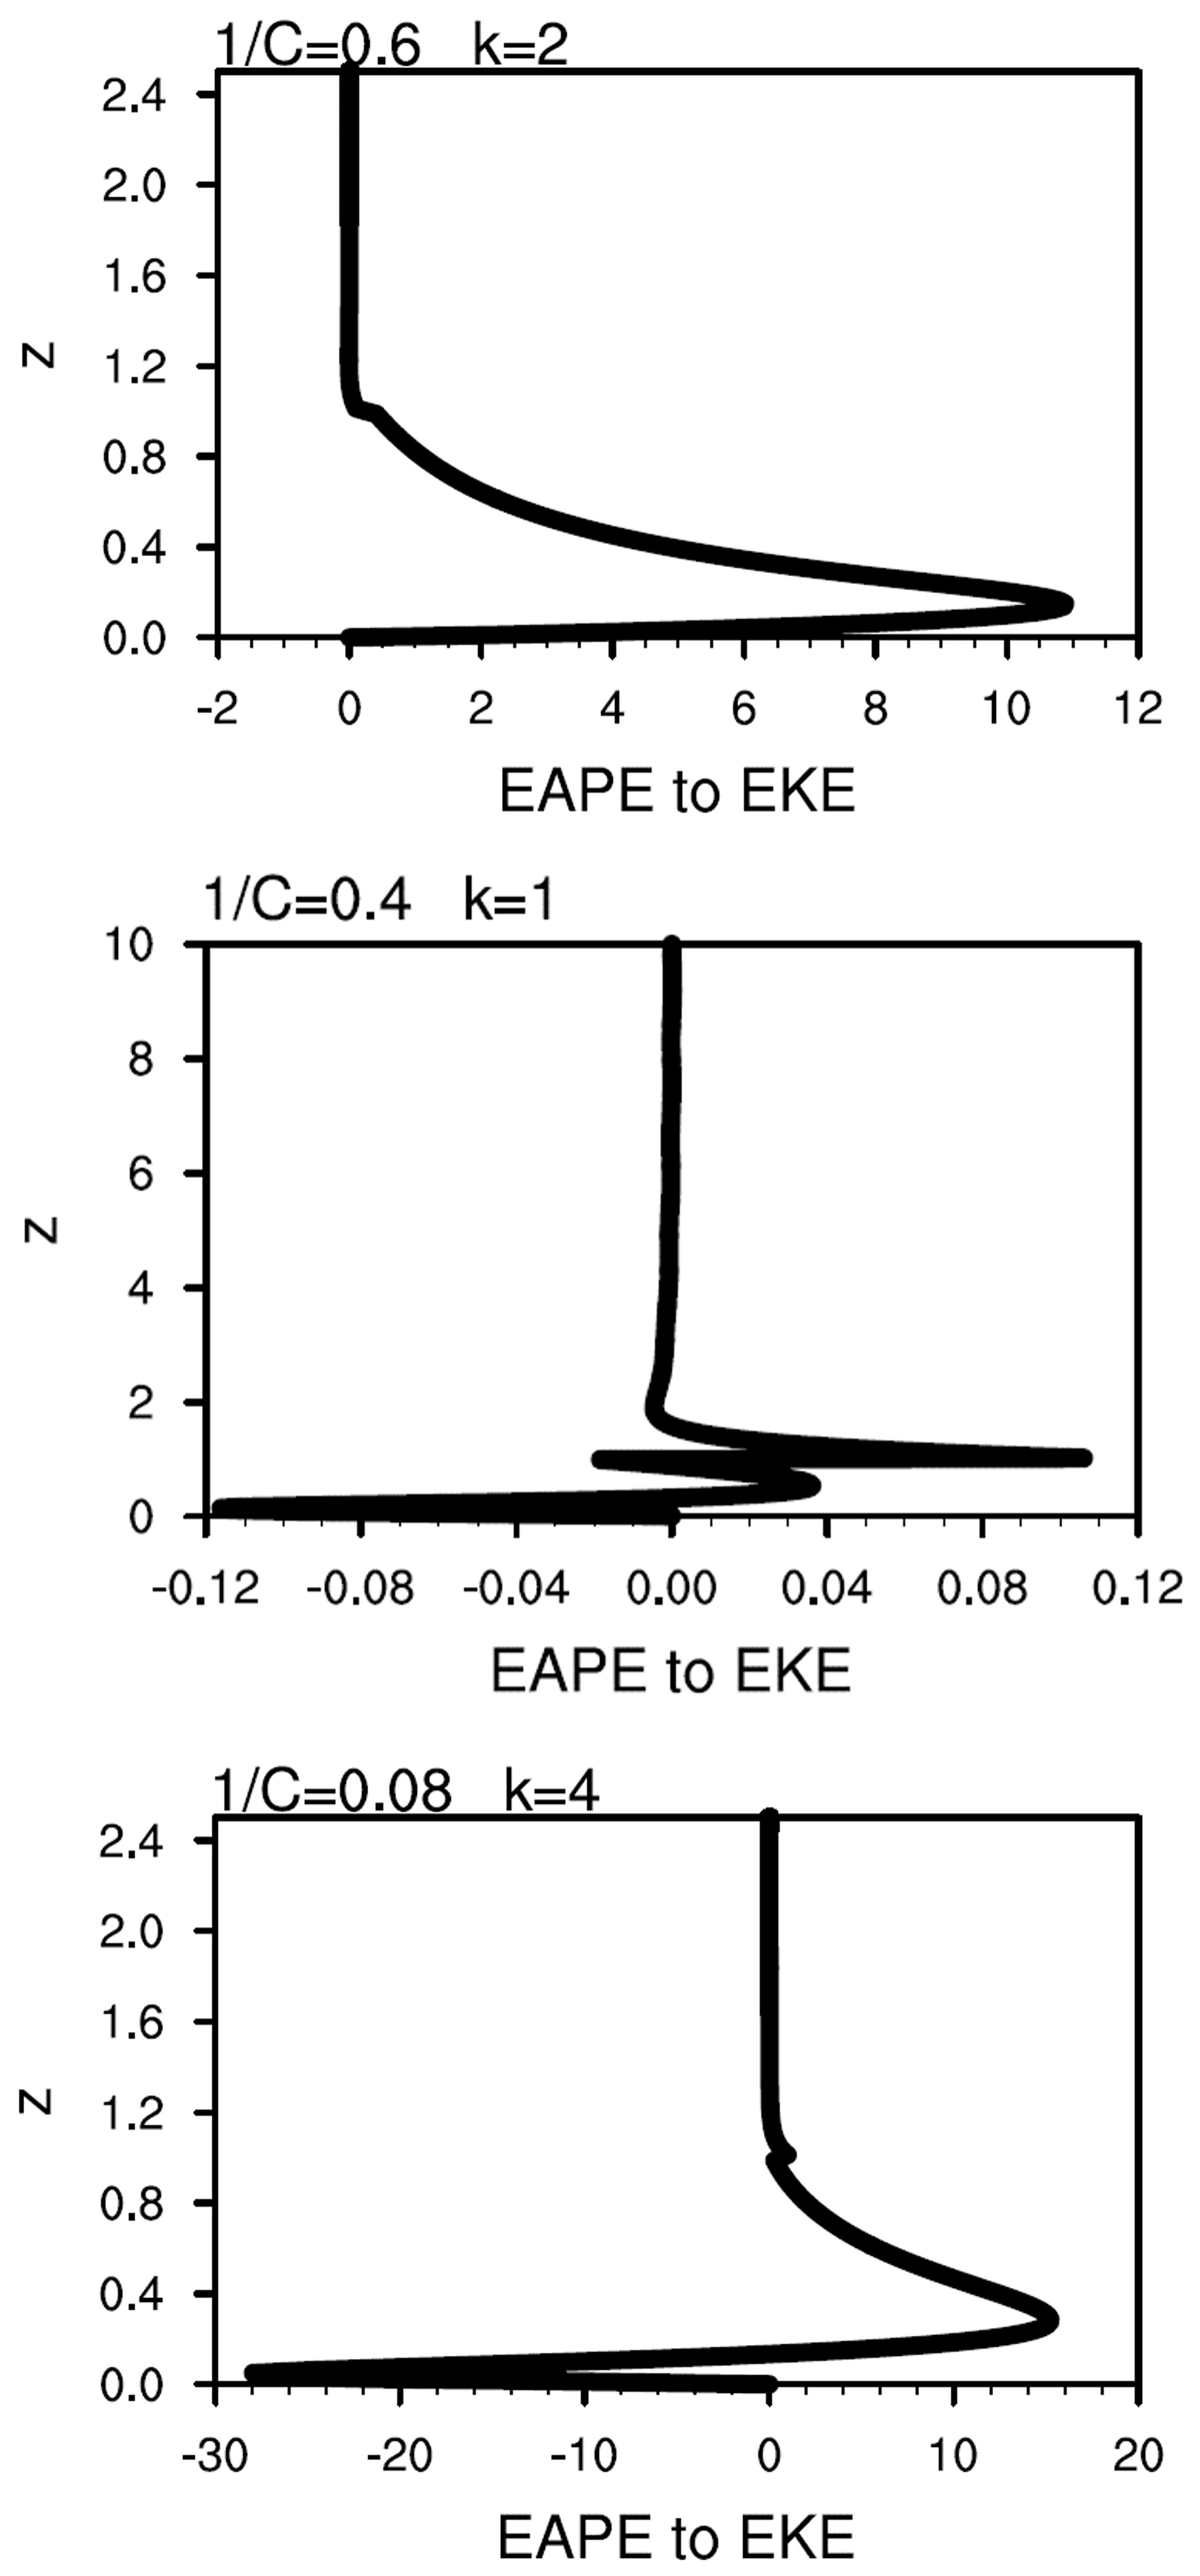
Figure 4
Vertical distribution of the non-dimensional horizontal integrated conversion rate from the eddy available potential energy to eddy kinetic energy, P to K, for Charney+ mode (top), Green mode (middle) and Tropopause mode (bottom). The non-dimensional parameters, 1/C and k, associated with these modes are indicated at the top of each panel with l = 1, A = 0.25, B = 1. as the common values of the remaining parameters. Charney+ and Tropopause modes are shown from z = 0 to 2.5; their values are virtually zero higher up. Green mode is shown from z = 0 to 10.
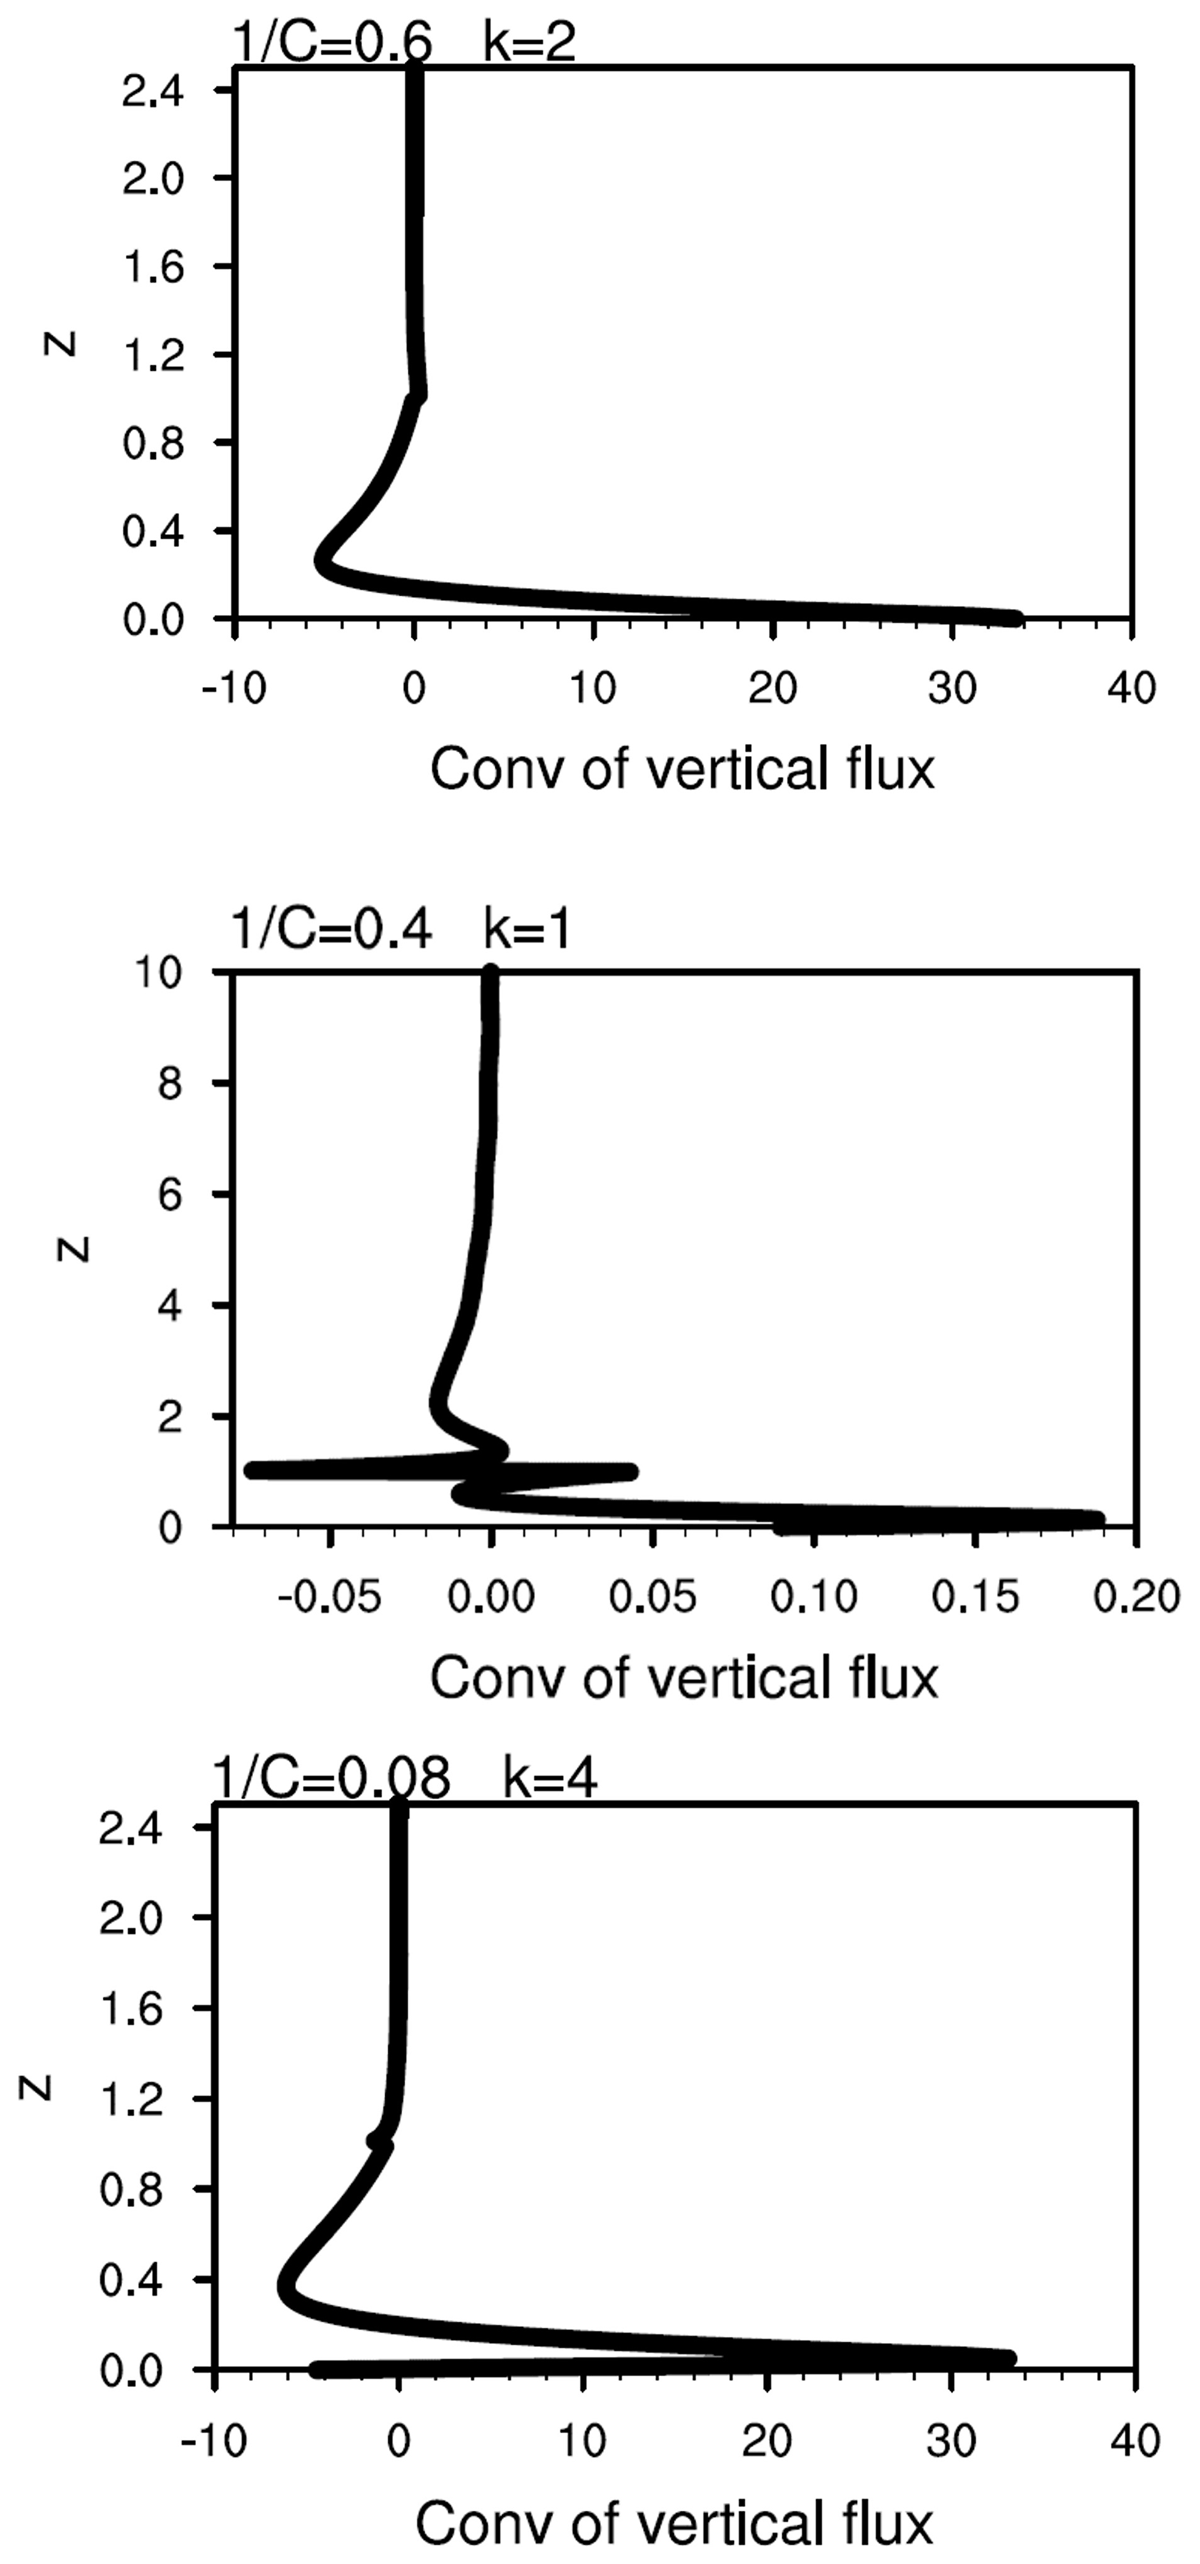
Figure 5
Vertical distribution of the convergence of vertical wave flux, , for the Charney+ mode (top), Green mode (middle) and Tropopause mode (bottom). The non-dimensional parameters, 1/C and k, associated with these modes are indicated at the top of each panel with l = 1, A = 0.25, B = 1. as the common values of the remaining parameters. Charney+ and Tropopause modes are shown from z = 0 to 2.5; their values are virtually zero higher up. Green mode is shown from z = 0 to 10.
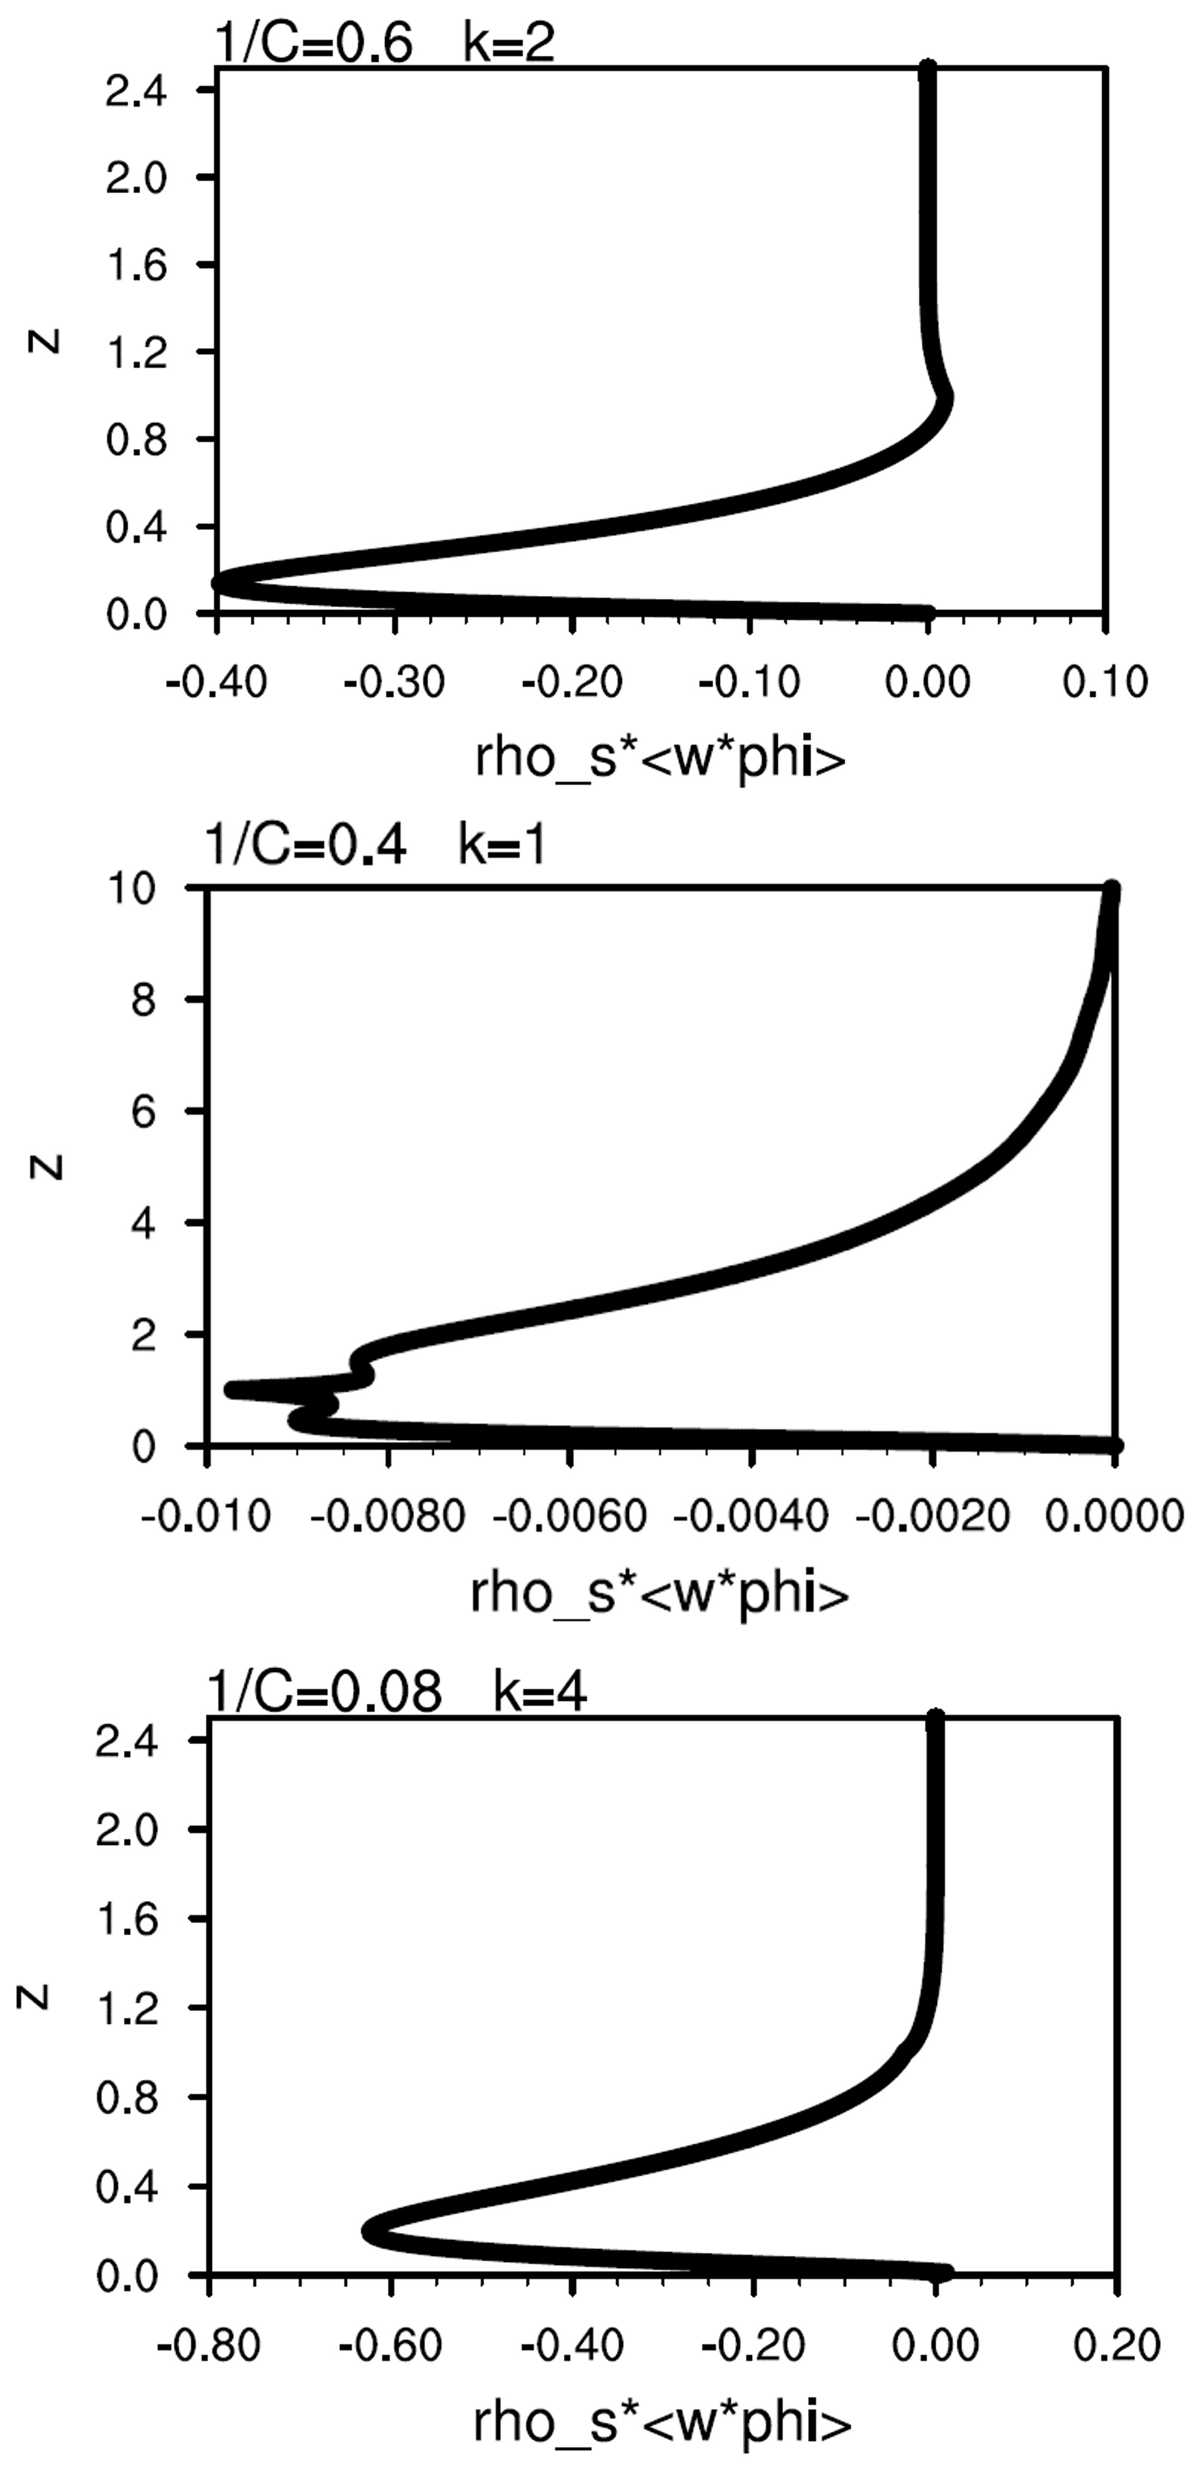
Figure 6
Vertical distribution of vertical wave flux, ρs⟨wϕ⟩, for the (top) Charney+ mode, (middle) Green mode and (bot) Tropopause mode. Charney+ and Tropopause modes are shown from z = 0 to 2.5; their values are virtually zero higher up, Green mode is shown from z = 0 to 10.
Table 1
A comparison of the growth rates for each of the three normal modes as measured by three separate corresponding energetic-based estimates γ1, γ2, and γ3 as well as the imaginary part of the eigenvalue, σi.
| GROWTH RATE | k = 2, 1/C = 0.6 (CHARNEY+) | k = 1, 1/C = 0.4 (GREEN) | k = 4, 1/C = 0.08 (TROPOPAUSE) |
|---|---|---|---|
| (KE) γ1 | 0.275 | –0.009 | 0.095 |
| (APE) γ2 | 0.236 | 0.078 | 0.150 |
| (E) γ3 | 0.265 | 0.058 | 0.124 |
| (Eigenvalue) σi | 0.279 | 0.076 | 0.128 |