
Table 1
Overview on used datasets, including information on spatial and temporal resolution as well as available time period.
| DATA | RESOLUTION | TIME | |
|---|---|---|---|
| E-OBS V20e | 0.25° (reg) | daily | 1950–2018 |
| 0.1° (reg) | daily | 1950–2018 | |
| IBERIA01 | 0.1° (reg) | daily | 1971–2015 |
| ERA5 | 0.25° (reg) | daily | 1979–2018 |
| ERA MiKlip | 0.22° (rot) | daily | 1961–2016 |
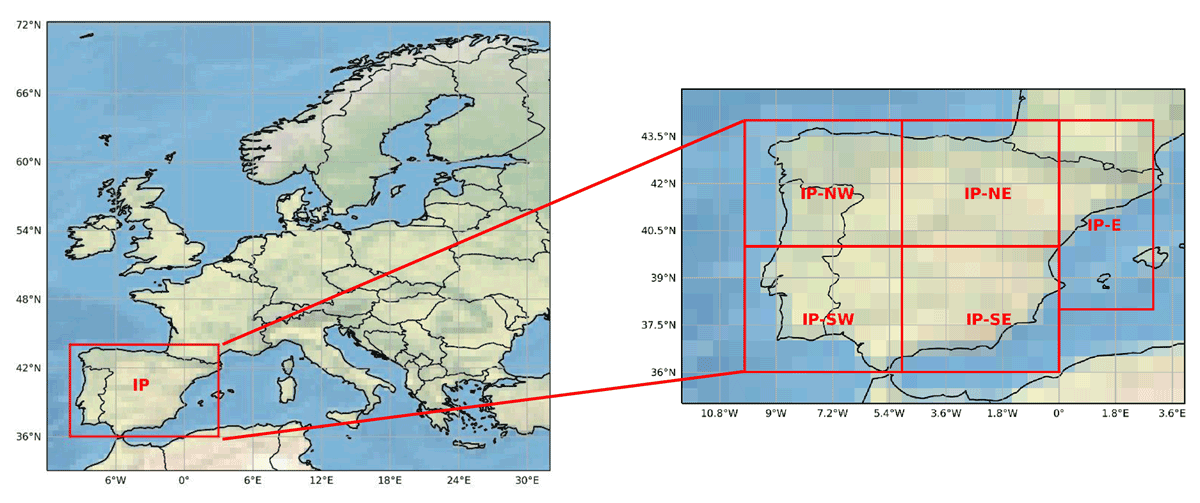
Figure 1
Iberian Peninsula (IP; PRUDENCE region 2; 10°W-3°E, 36°N-44°N) and sub-regions: IP-NW (10°W-5°W, 40°N-44°N), IP-NE (5°W-0°E, 40°N-44°N), IP-SW (10°W-5°W, 36°N-40°N), IP-SE (5°W-0°E, 36°N-40°N), and IP-E (0°E-3°E, 38°N-44°N).
| • Normal: | 1.0 > EDI > –1.0 (80.1%) |
| • Dry: | –1.0 ≥ EDI > –1.5 (9.8%) |
| • Severe dry: | –1.5 ≥ EDI > –2.0 (1.7%) |
| • Extreme dry: | EDI ≤ –2 (0.04%) |
| • Mild drought: | 0.0 > SPI > –1.0 (34%) |
| • Moderate drought: | –1.0 ≥ SPI > –1.5 (9.2%) |
| • Severe drought: | –1.5 ≥ SPI > –2.0 (4.4%) |
| • Extreme drought: | SPI ≤ –2.0 (2.3%) |
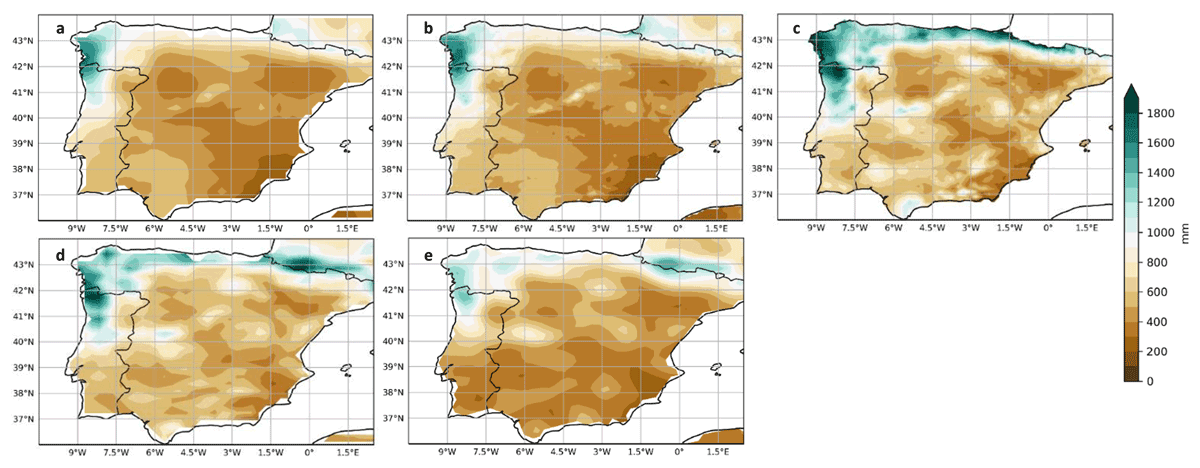
Figure 2
Climatology of annual precipitation sums (in mm) for the hydrological years of the period 1981–2010, i.e. hydrological years 1981/1982 – 2009/2010: (a) E-OBS V20e 0.25°, (b) E-OBS V20e 0.1°, (c) IBERIA01, (d) ERA5, (e) ERA MiKlip.
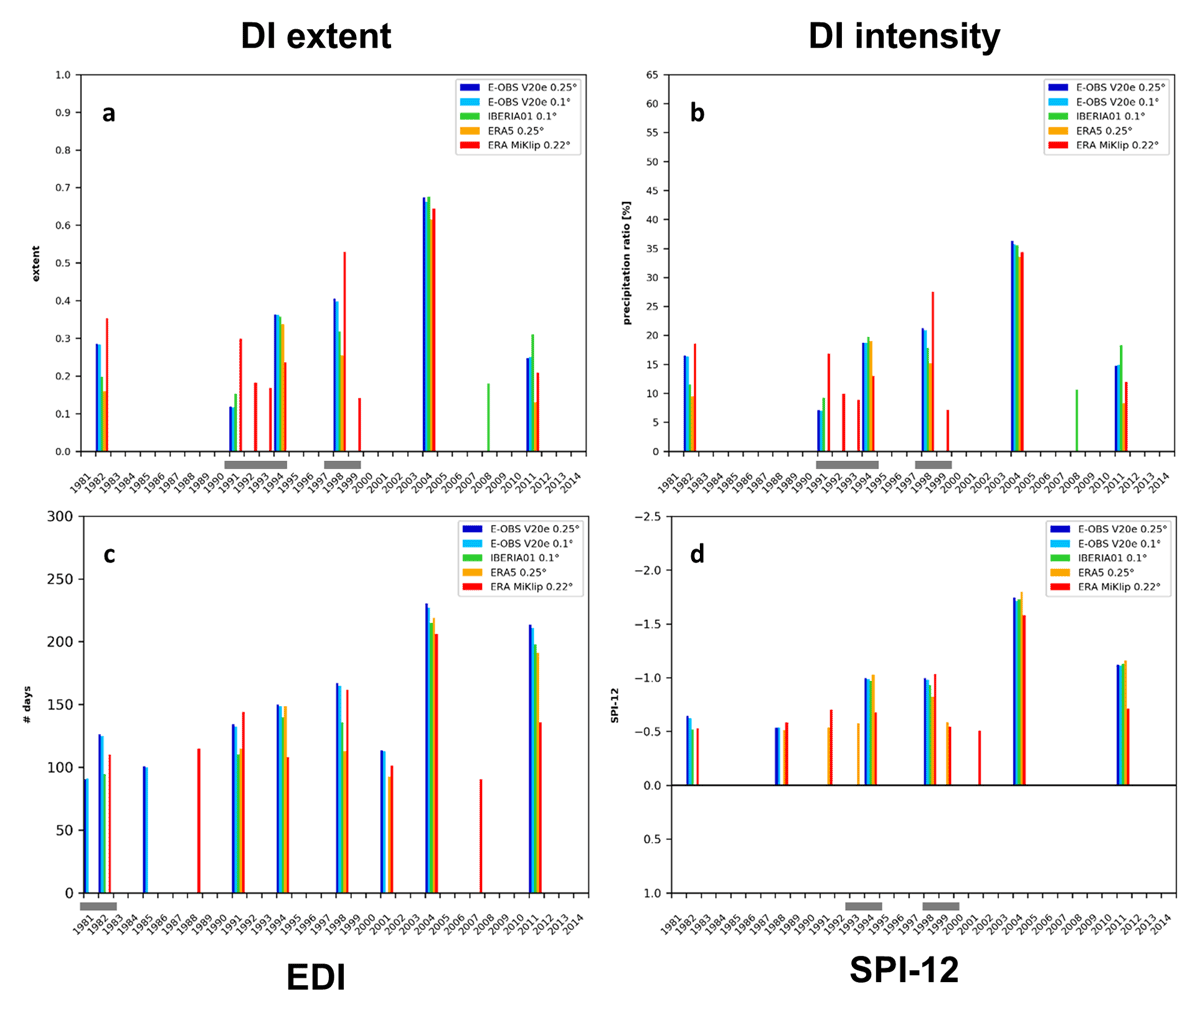
Figure 3
Time series of drought years for the period 1981/1982 – 2014/2015, defined by (a) drought index (DI) extent, (b) DI intensity, (c) EDI, and (d) SPI-12. Depicted are spatial means for IP. The grey horizontal bars indicate consecutive drought years. Please note the inverted y-axis for SPI-12.
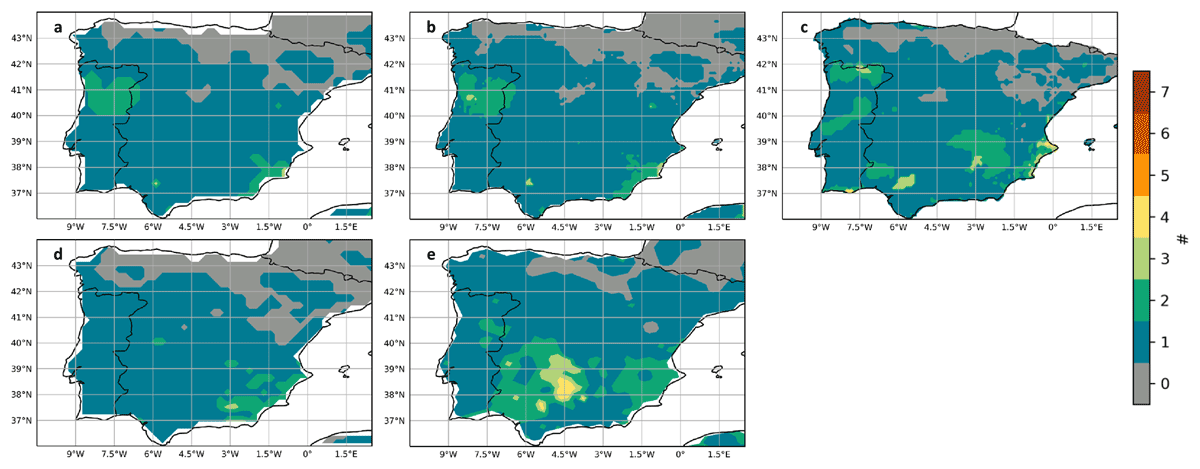
Figure 4
Recurrent dry year index (RDYI) for the hydrological years of the period 1981/1982 – 2014/2015: (a) E-OBS V20e 0.25°, (b) E-OBS V20e 0.1°, (c) IBERIA01, (d) ERA5, (e) ERA MiKlip.
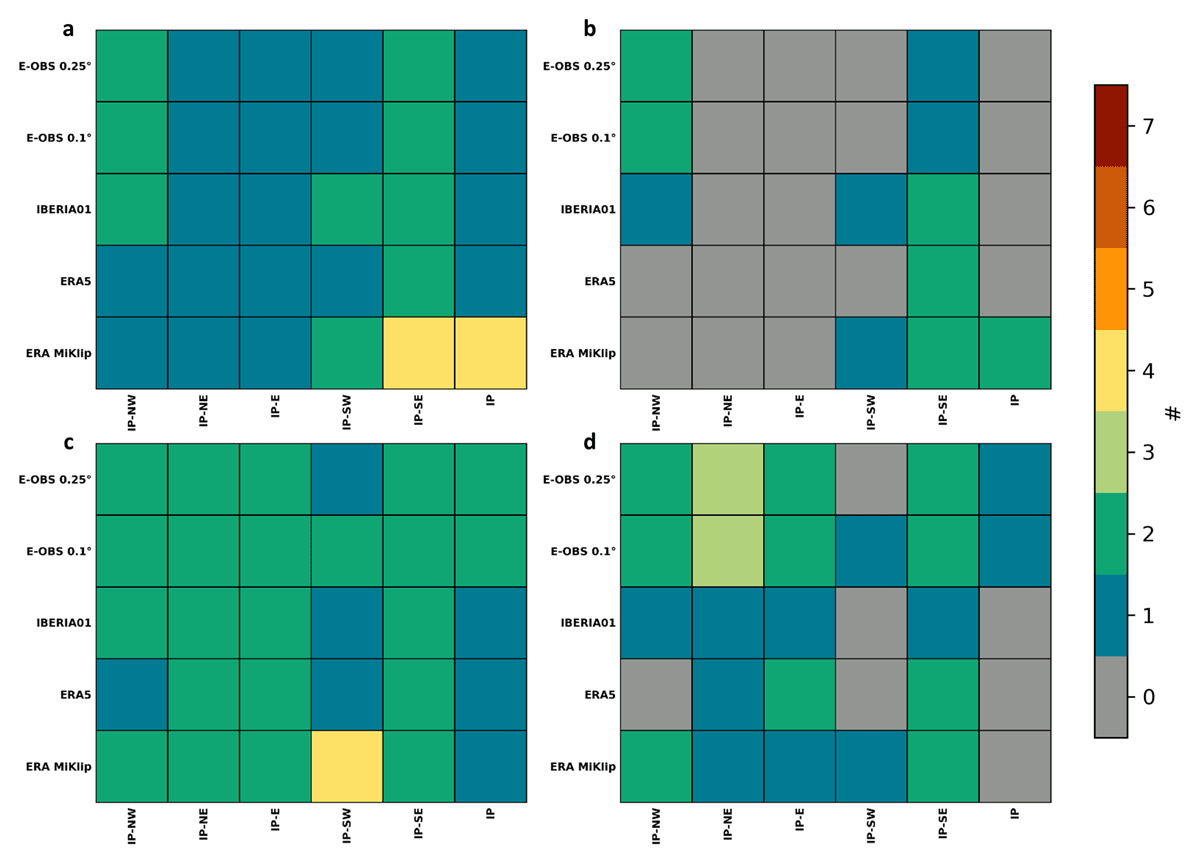
Figure 5
Consecutive drought year index (CDY; left) and number of drought periods (NDP; right) for all datasets and the six regions (IP-NW, IP-NE, IP-E, IP-SW, IP-SE, and IP). First row: based on DI; second row: based on EDI. For definition of sub-regions please refer to Figure 1.
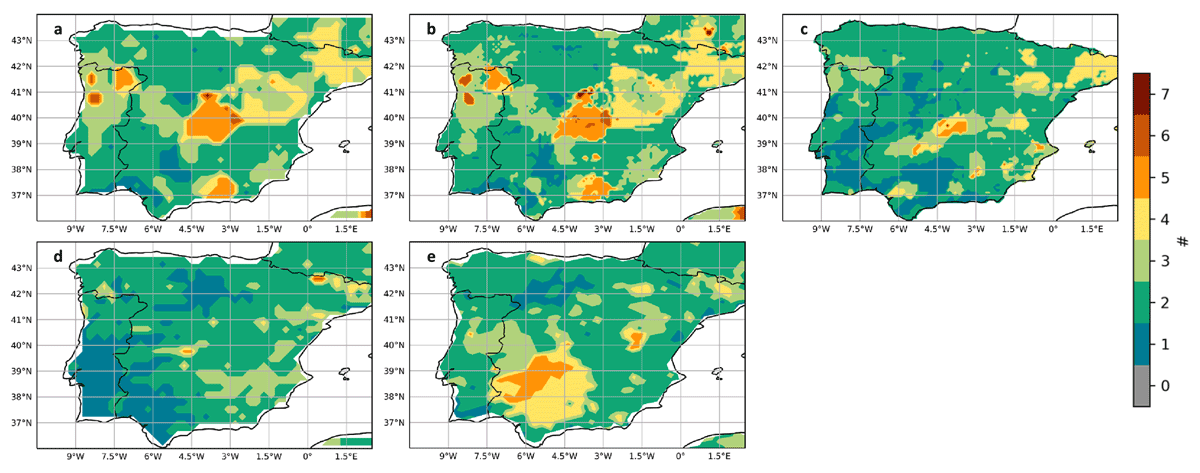
Figure 6
Consecutive drought year index based on EDI (CDY-EDI) for the hydrological years of the period 1981/1982 – 2014/2015: (a) E-OBS V20e 0.25°, (b) E-OBS V20e 0.1°, (c) IBERIA01, (d) ERA5, (e) ERA MiKlip. A drought year is identified, if EDI < –1.0 on at least 90 days per year (see also Figure 3).
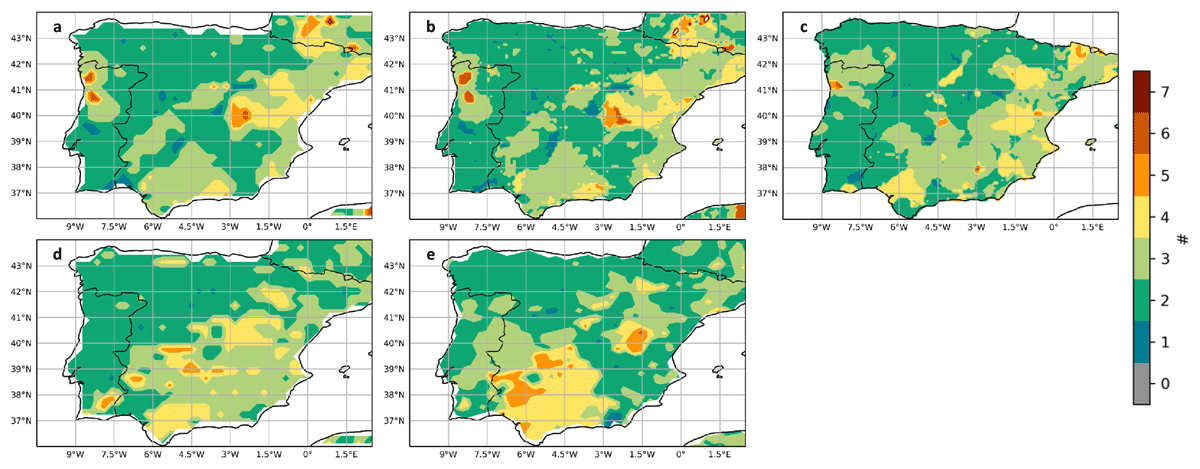
Figure 7
Consecutive drought year index based on SPI (CDY-SPI) for the hydrological years of the period 1981/1982 – 2014/2015: (a) E-OBS V20e 0.25°, (b) E-OBS V20e 0.1°, (c) IBERIA01, (d) ERA5, (e) ERA MiKlip. A drought year is identified, if SPI-12 < –0.5 (see also Figure 3).
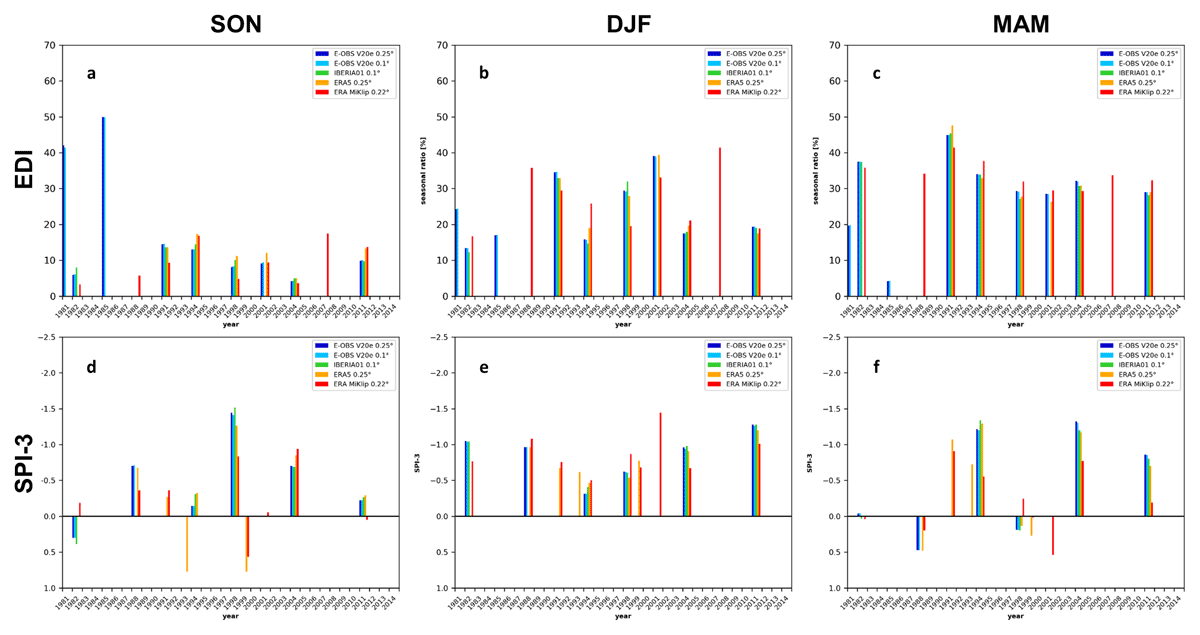
Figure 8
Seasonal ratio (in %) of annual number of dry days (EDI < –1.0) for the drought years identified with EDI (top row). Time series of SPI-3 for drought years identified with SPI-12 (bottom row). Depicted are spatial means for IP for the period 1981/1982 – 2014/2015. First column: SON; Second column: DJF; Third column: MAM.
| CDY | Consecutive Drought Year Index, based on Drought Index |
| CDY-EDI | Consecutive Drought Year Index, based on Effective Drought Index |
| DI | Drought Index |
| DJF | winter months (December, January, February) |
| EDI | Effective Drought Index |
| IP | Iberian Peninsula |
| IP-E | Eastern Iberian Peninsula |
| IP-NE | Northeastern Iberian Peninsula |
| IP-NW | Northwestern Iberian Peninsula |
| IP-SE | Southeastern Iberian Peninsula |
| IP-SW | Southwestern Iberian Peninsula |
| MAM | Spring months (March, April, May) |
| NDP | Number of Drought Periods, based on Drought Index |
| NDP-EDI | Number of Drought Periods, based on Effective Drought Index |
| NDYP | Number of Dry Year Periods |
| RDYI | Recurrent Dry Year Index |
| SON | Autumn months (September, October, November) |
| SPI | Standardized Precipitation Index |