
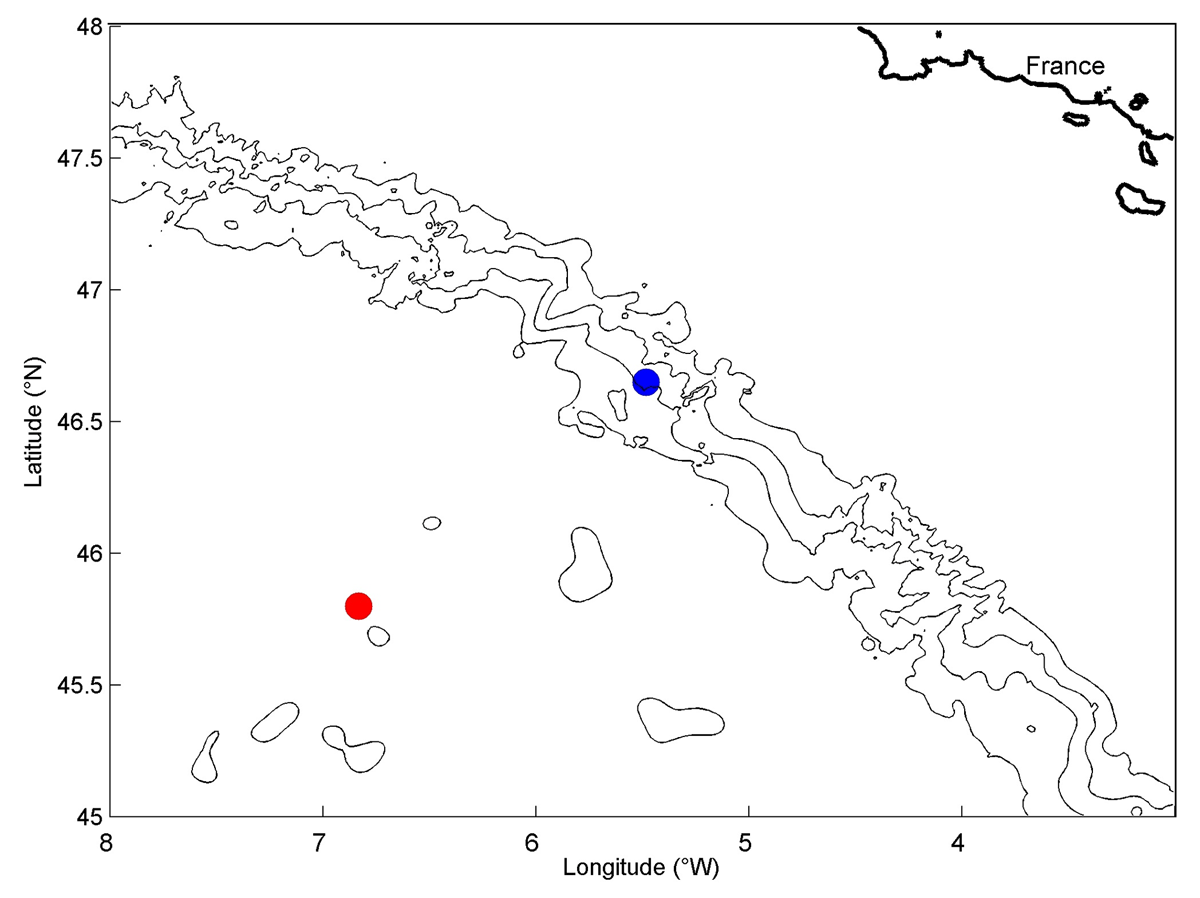
Figure 1
Current meter mooring sites in the Bay of Biscay with black contours of topography every 1000 m water depth. The coloured dots correspond with the spectra in Figure 2.
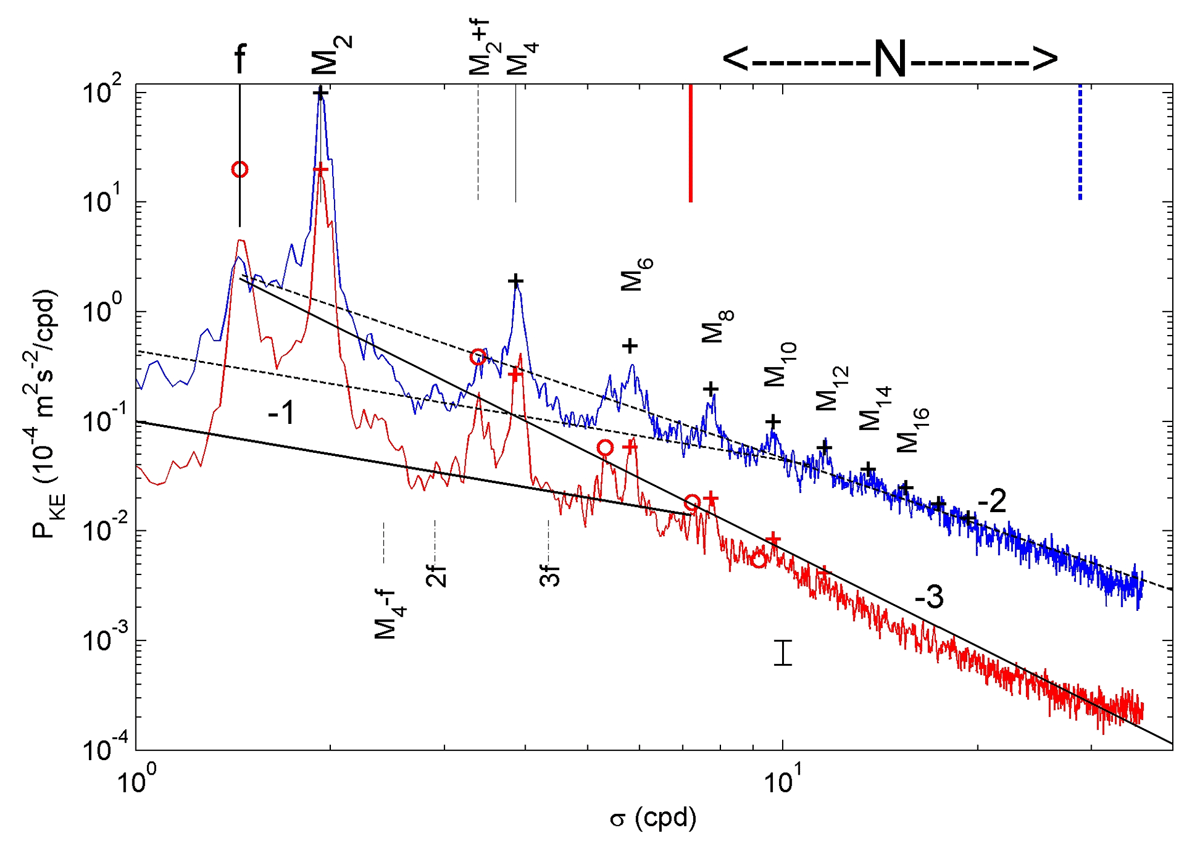
Figure 2
Kinetic energy spectra from 11 months of current meter observations at 1000 m above the seafloor in H = 4810 m water depth (red) and H = 2450 m (blue). Spectra were moderately smoothed (v ≈ 30 df) and not offset vertically. The difference in energy levels between the spectra corresponded to the difference in N(z), which variation is indicated between the vertical bars in the top-right corner. This corresponds with the vertical distance between the sloping lines at fall-off rates σ–1 (solid and dashed corresponding to red and blue spectra, respectively). Constant slopes in log-log plot are indicated “–1,–2,–3” representing σ–1, σ–2, σ–3, respectively. Spectra of model (2) are superposed for observed barotropic and baroclinic fundamental tidal amplitudes and fitting parameter γ. Three model examples are given, two for tidal-interactions (+) and one for inertial-tidal-interactions including frequency-corrections to coefficients (o). They fit well the observed energy levels for nearly the same γ (see text). In all cases, reference amplitude is the barotropic M2 current amplitude, indicated at f and M2 (leftmost o, +). Baroclinic M2-variance are a quarter of peak M2-values.
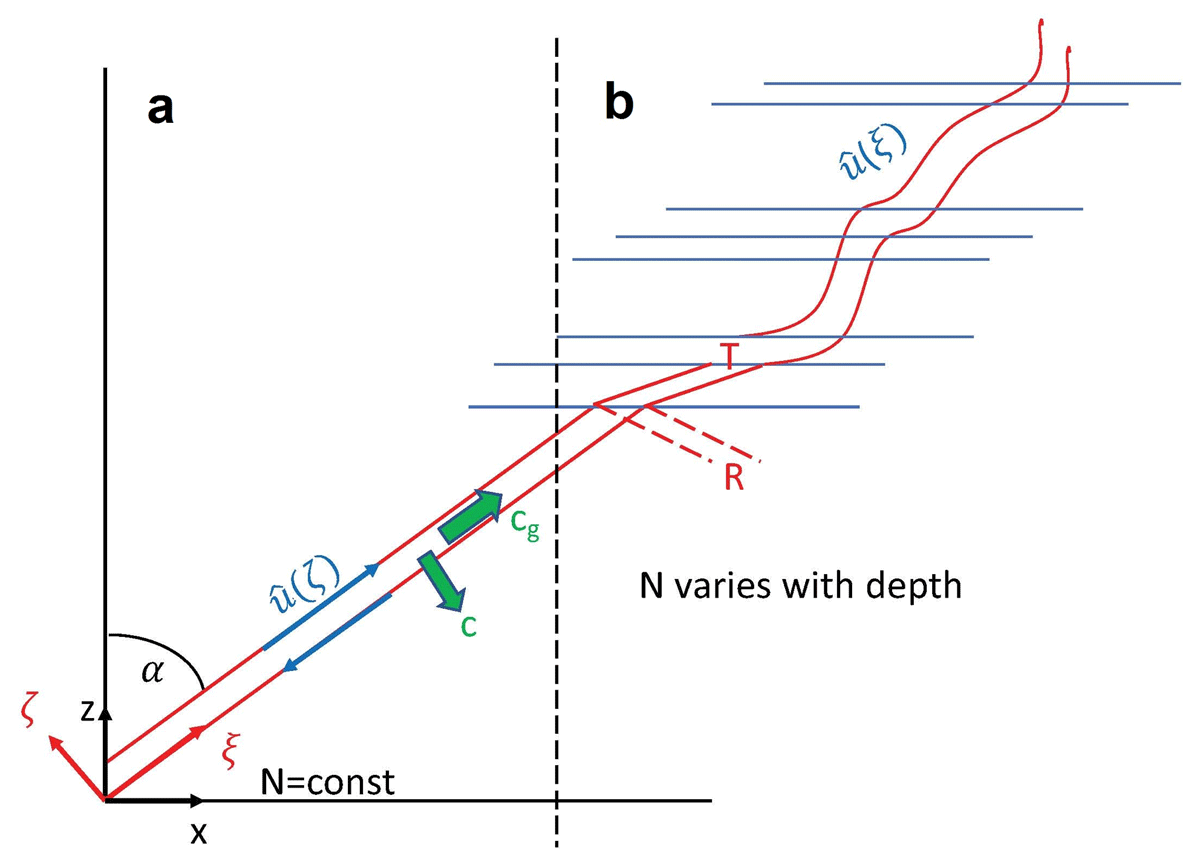
Figure 3
Sketch of internal tidal velocity and its direction of variation. (a) In a uniformly stratified ocean velocity only varies in the direction of phase speed c, not in the direction of energy propagation cg. (b) In a non-uniformly stratified ocean in which incoming energy splits in transmitted (T) and reflected parts (R) velocity may vary dominantly in the direction of energy propagation when the scale of variation in ξ is smaller than the wavelength of the incident internal wave. The blue lines indicate isopcynals whose smaller distance between them implies stronger stratification across an interface.