
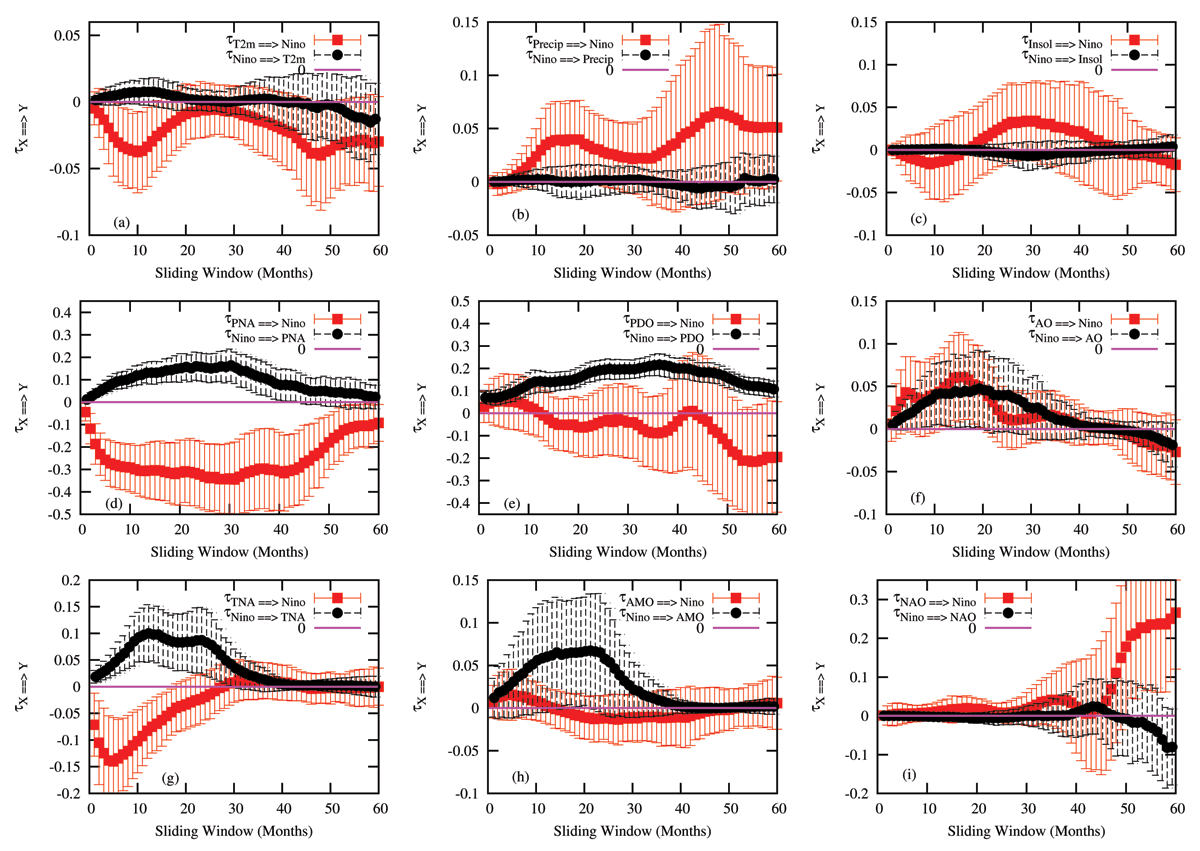
Figure 1
The rate of information transfer as a function of the averaging sliding window. All interactions with El-Niño 3.4.
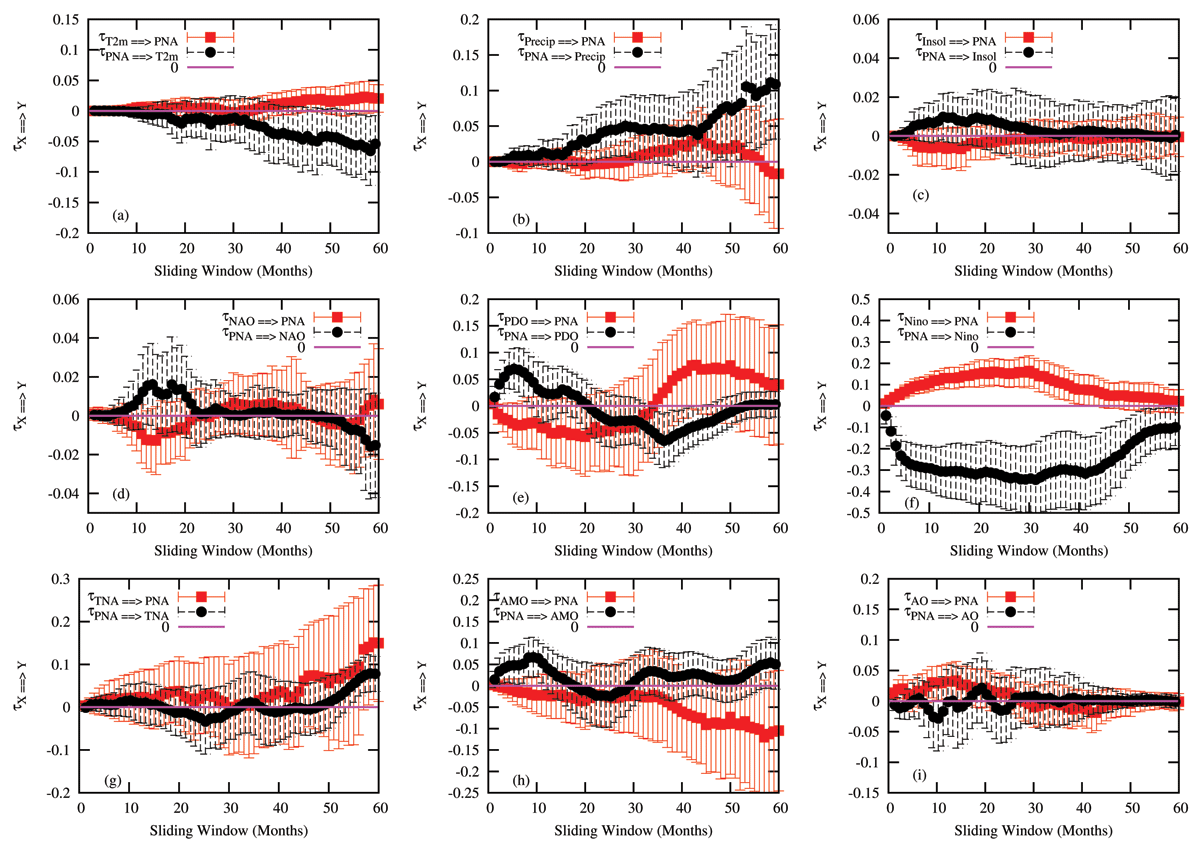
Figure 2
The rate of information transfer as a function of the averaging sliding window. All interactions with PNA.
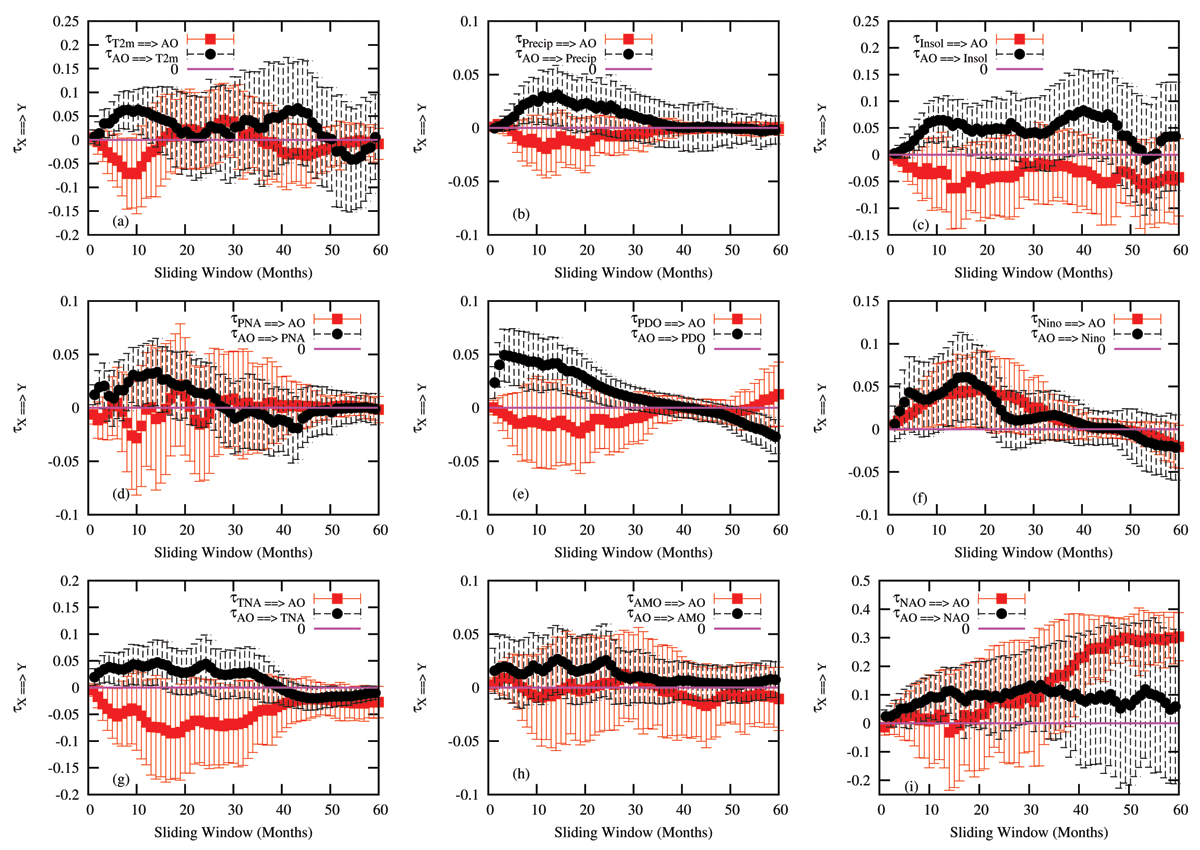
Figure 3
The rate of information transfer as a function of the averaging sliding window. All interactions with AO.
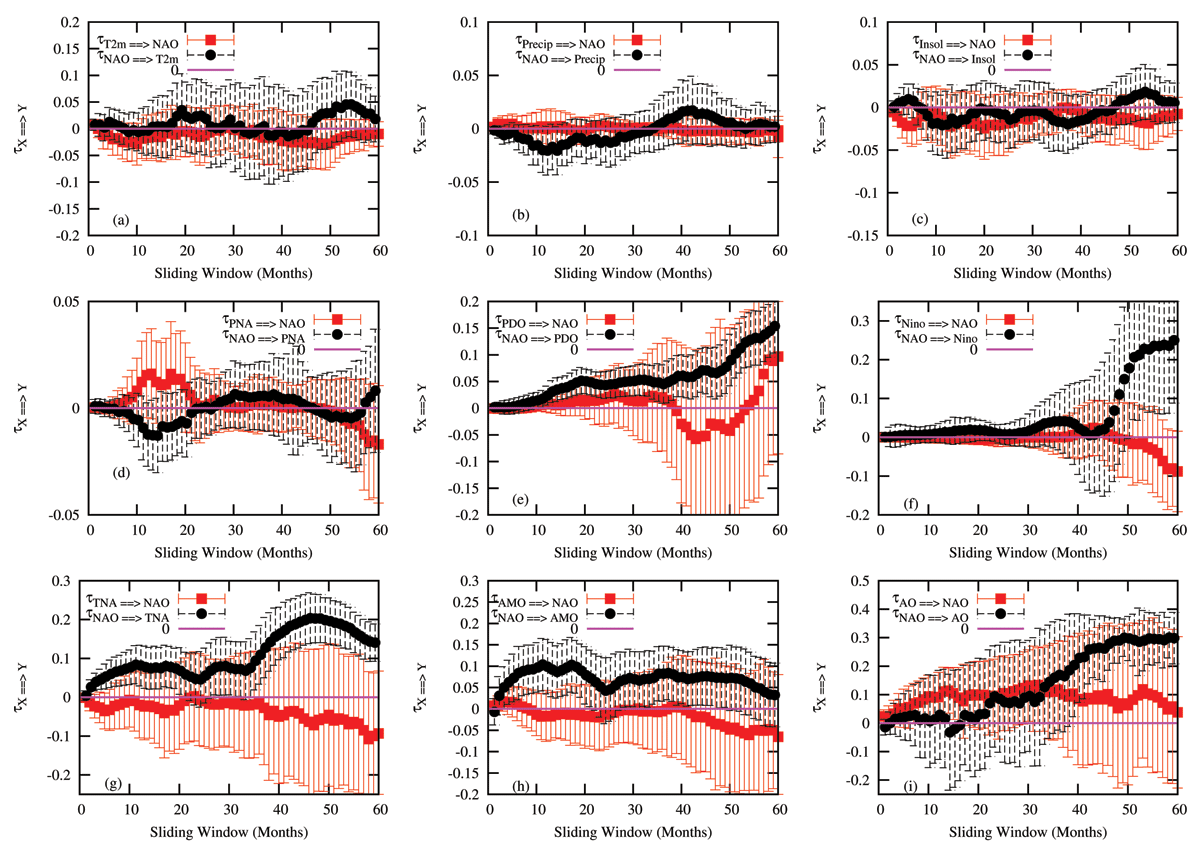
Figure 4
The rate of information transfer as a function of the averaging sliding window. All interactions with NAO.
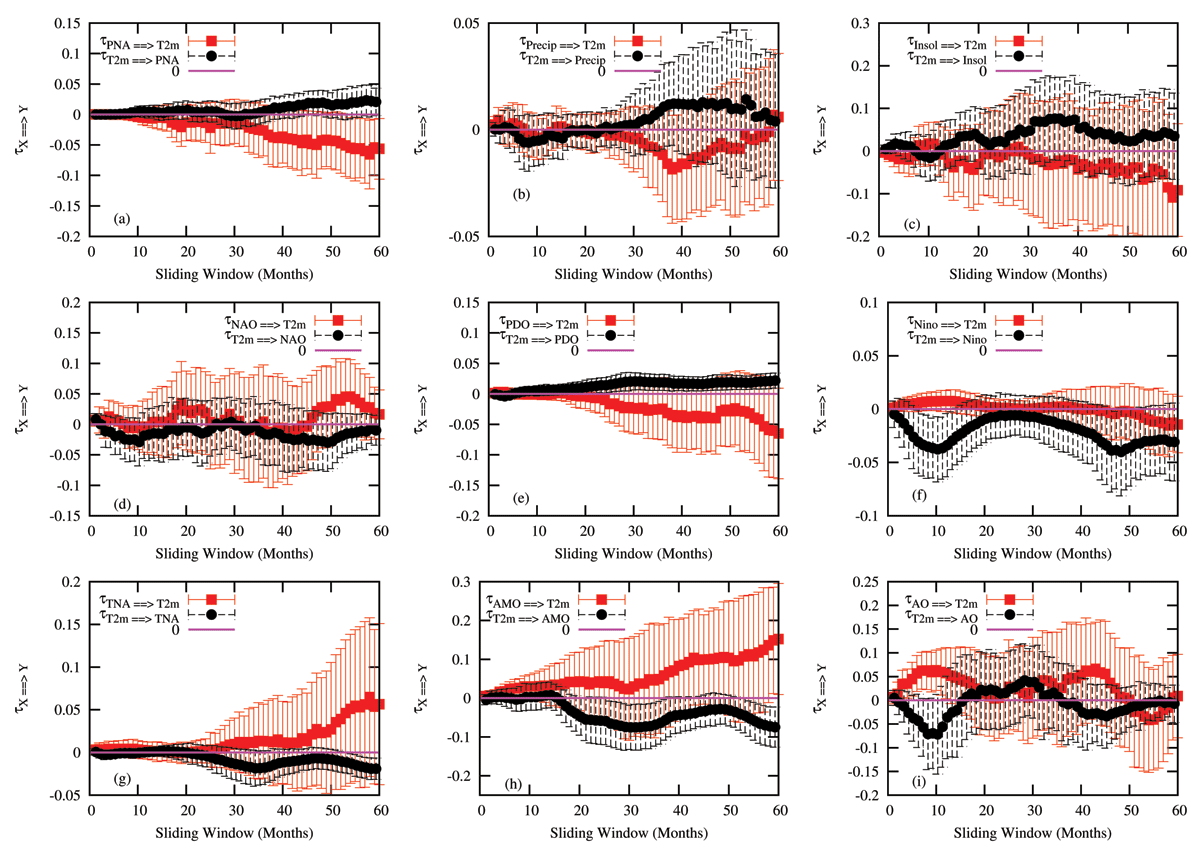
Figure 5
The rate of information transfer as a function of the averaging sliding window. All interactions with T2m.
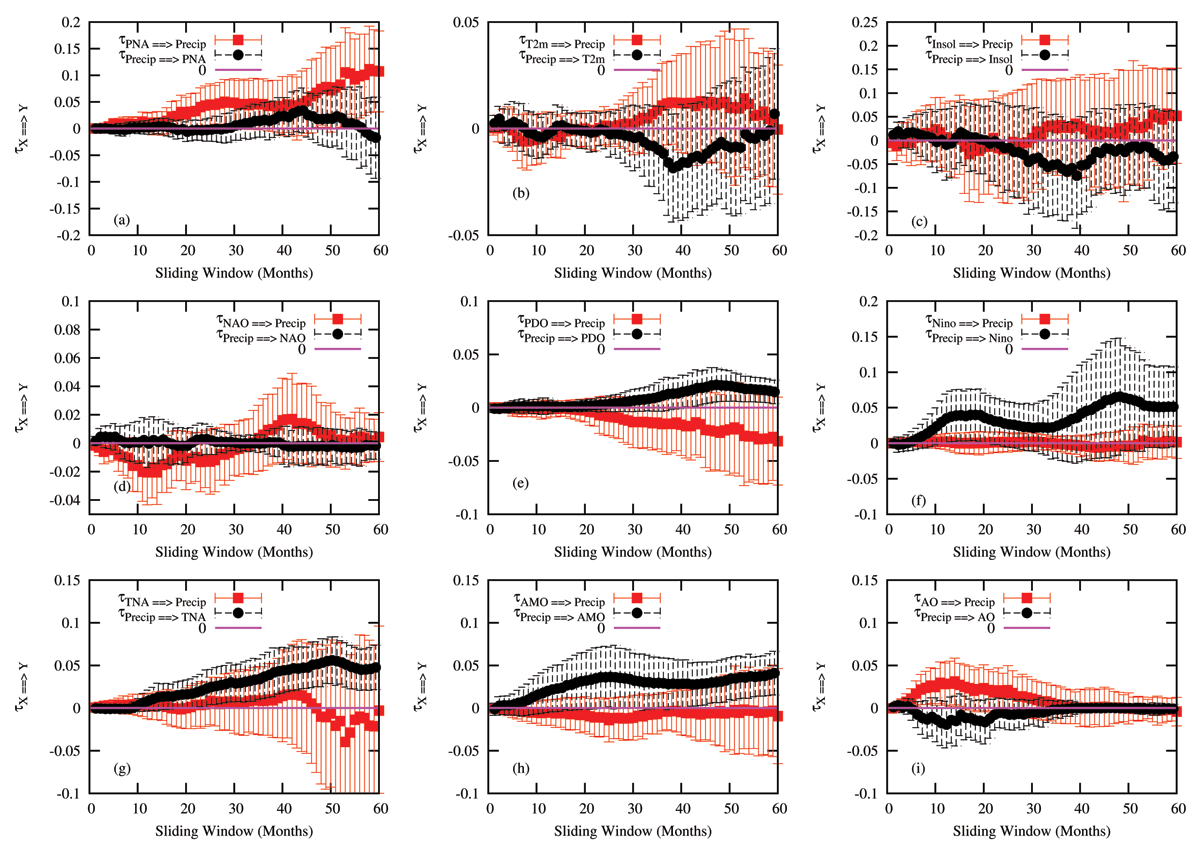
Figure 6
The rate of information transfer as a function of the averaging sliding window. All interactions with Precipitation.
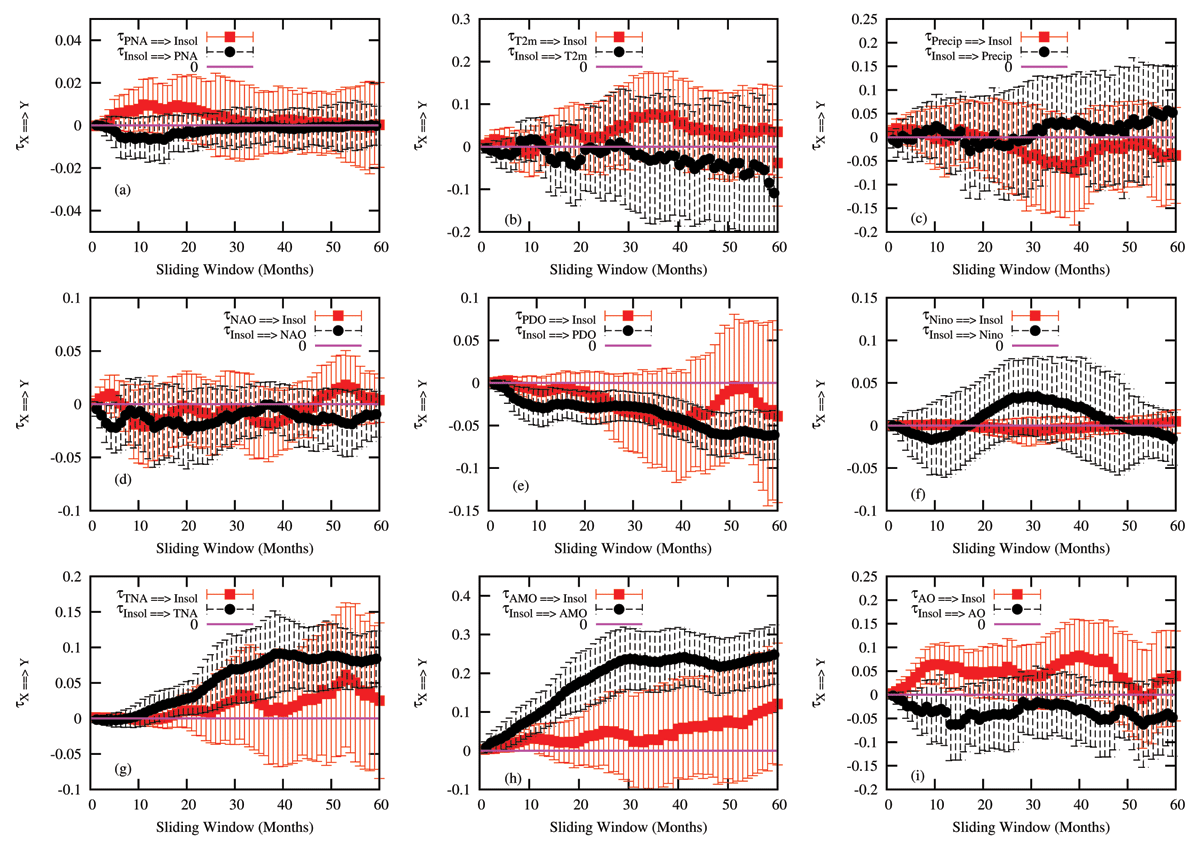
Figure 7
The rate of information transfer as a function of the averaging sliding window. All interactions with Insolation.
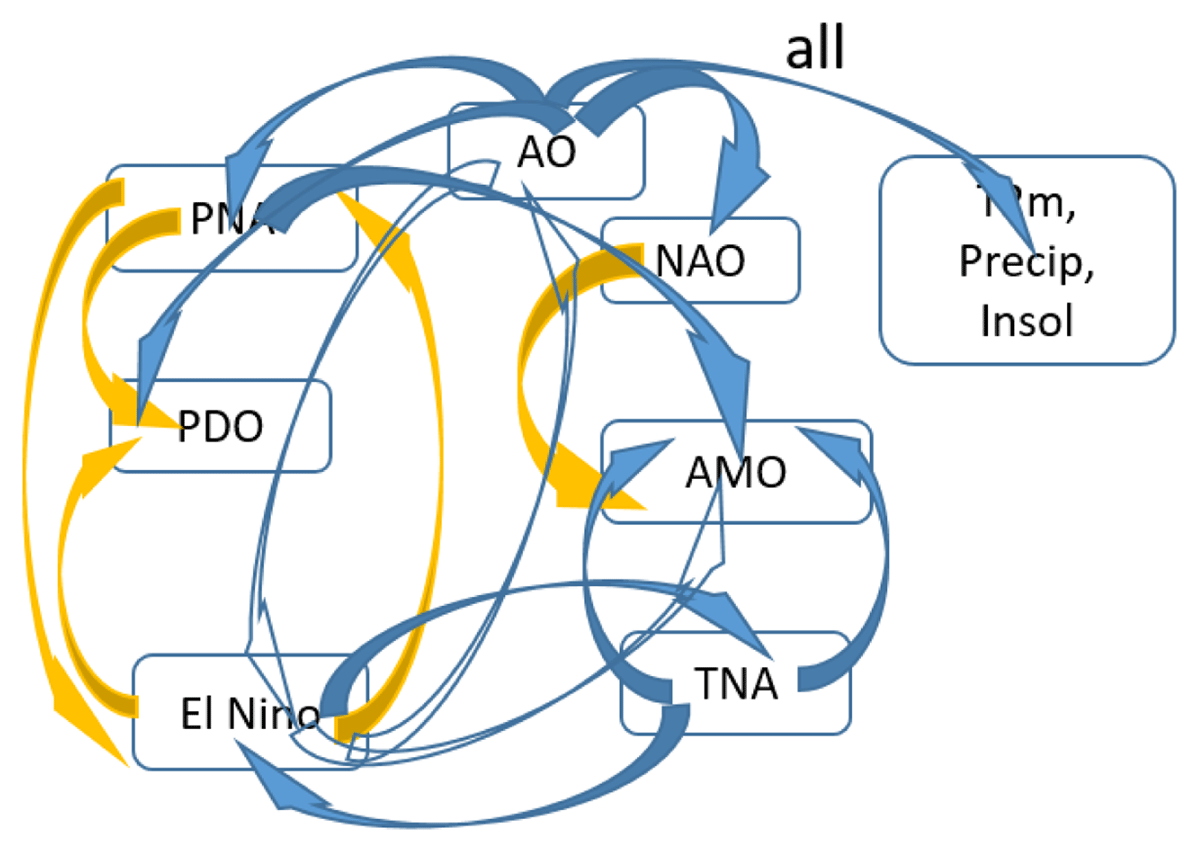
Figure 8
Dependencies between the different observables at short (blue arrows) and all time scales (yellow arrows). The open blue arrows indicate weak dependencies as compared to the other ones. The label “all” indicates that all local variables are influenced by AO.
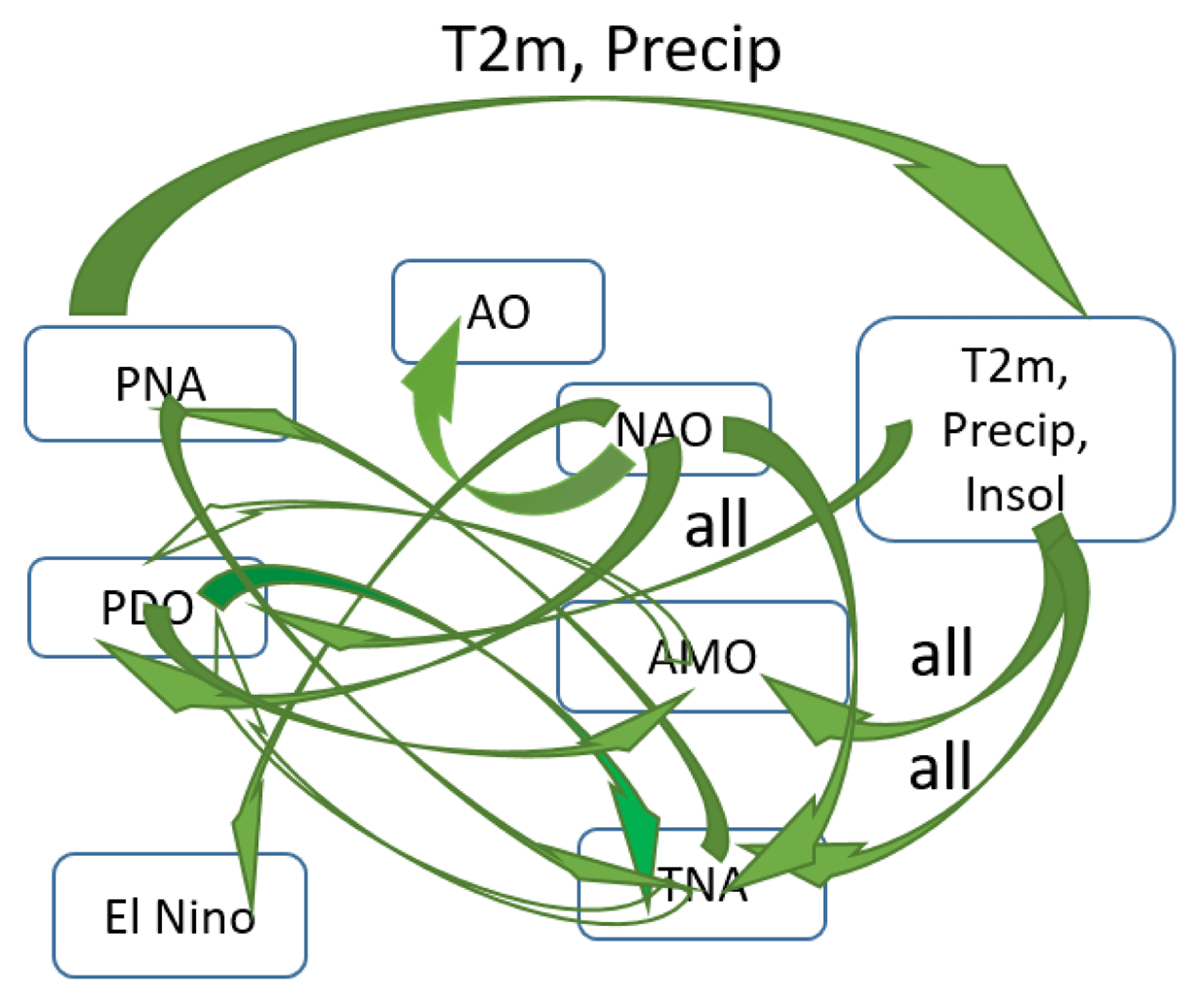
Figure 9
Dependencies between the different observables at long time scales (green arrows). The open green arrows indicate weak dependencies as compared to the other ones. The label “all” indicates that all local observables are influencing the target observable. T2m and Precip refer to temperature at 2 meters and precipitation, respectively.
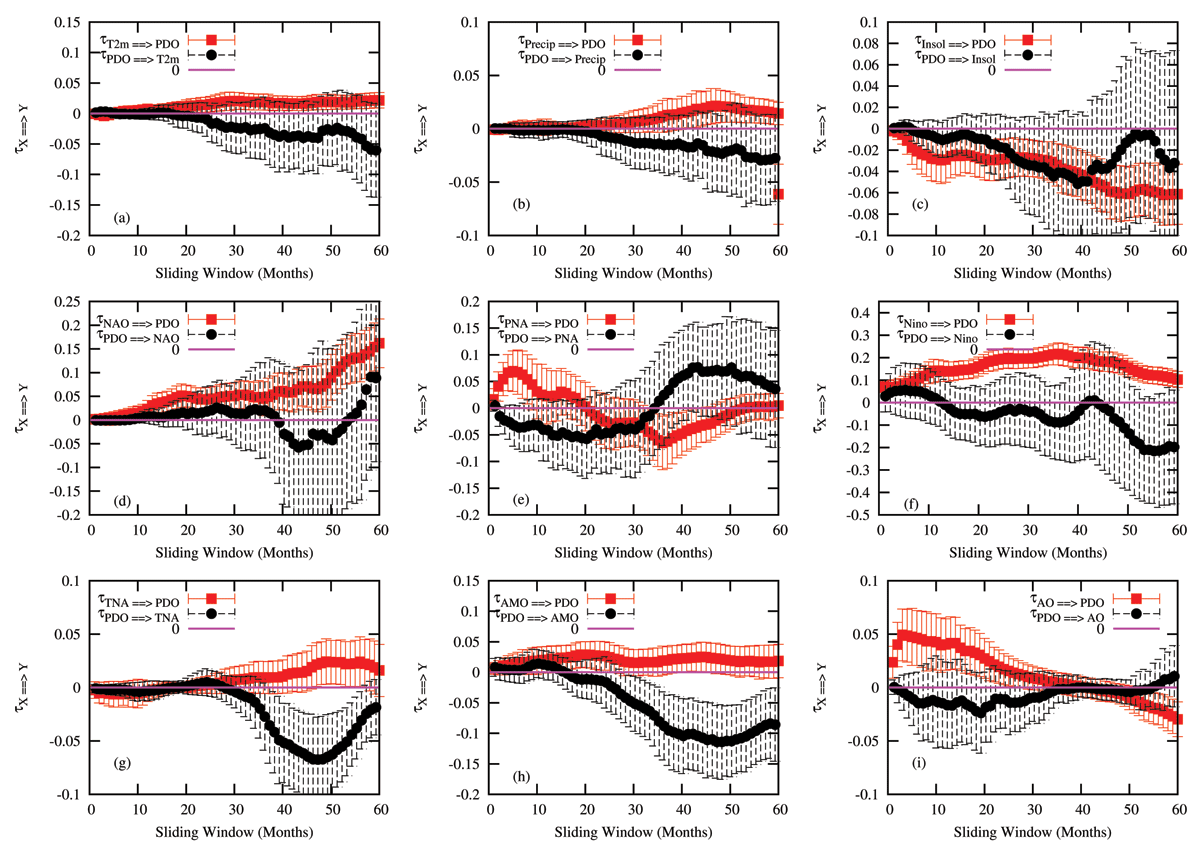
Figure A1
The rate of information transfer as a function of the averaging sliding window. All interactions with PDO.
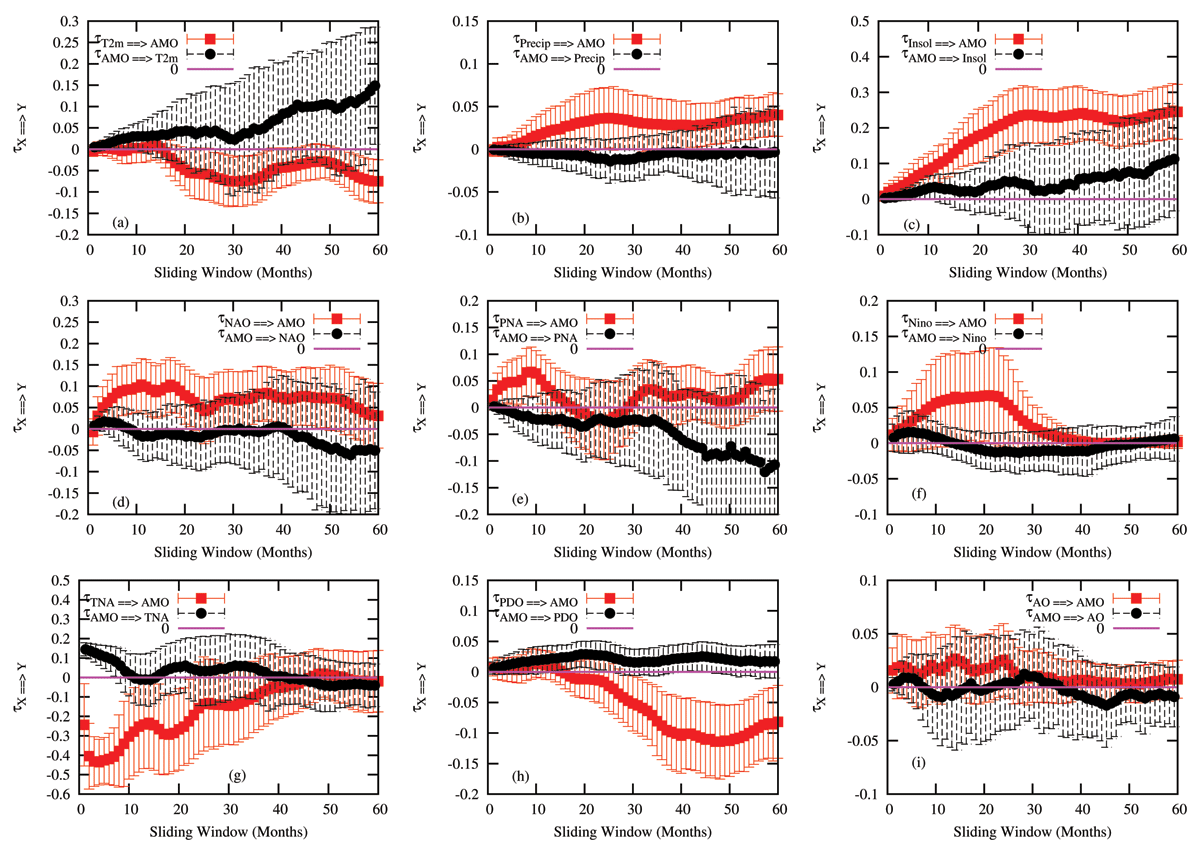
Figure A2
The rate of information transfer as a function of the averaging sliding window. All interactions with AMO.
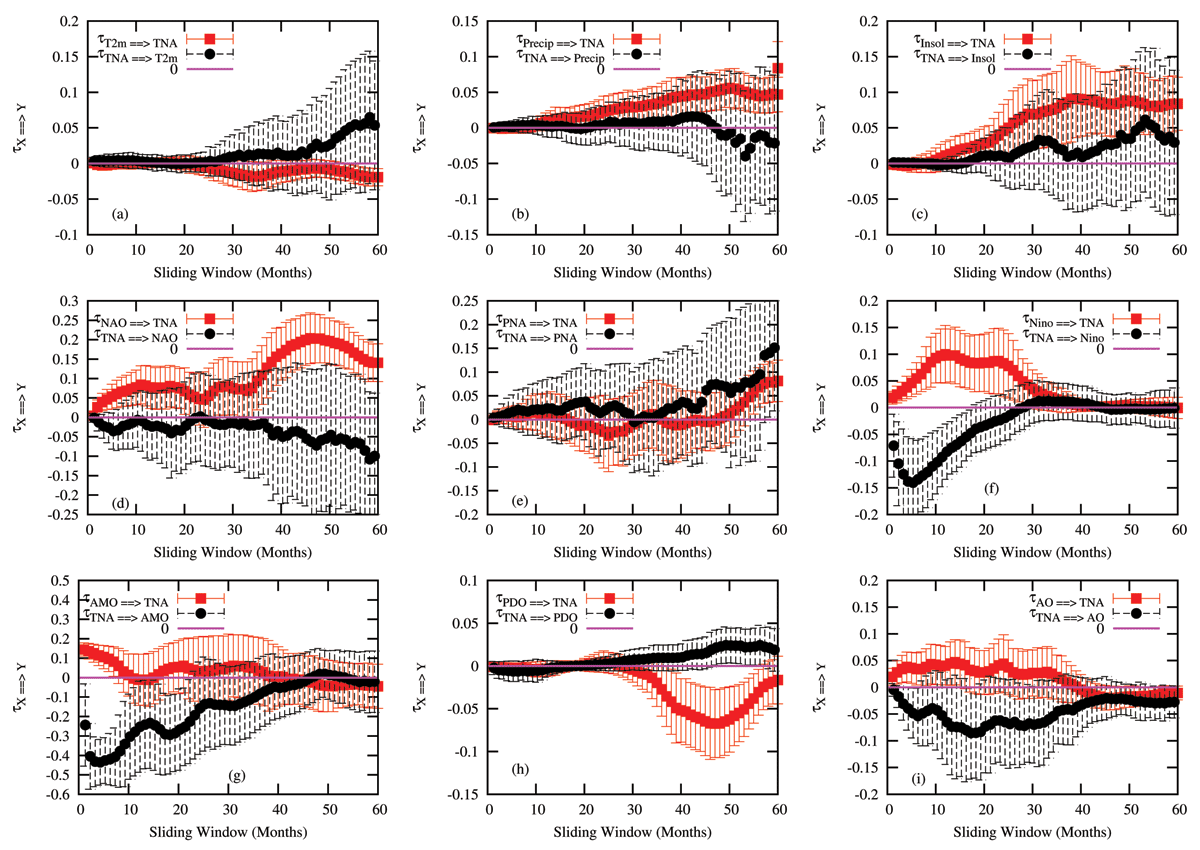
Figure A3
The rate of information transfer as a function of the averaging sliding window. All interactions with TNA.
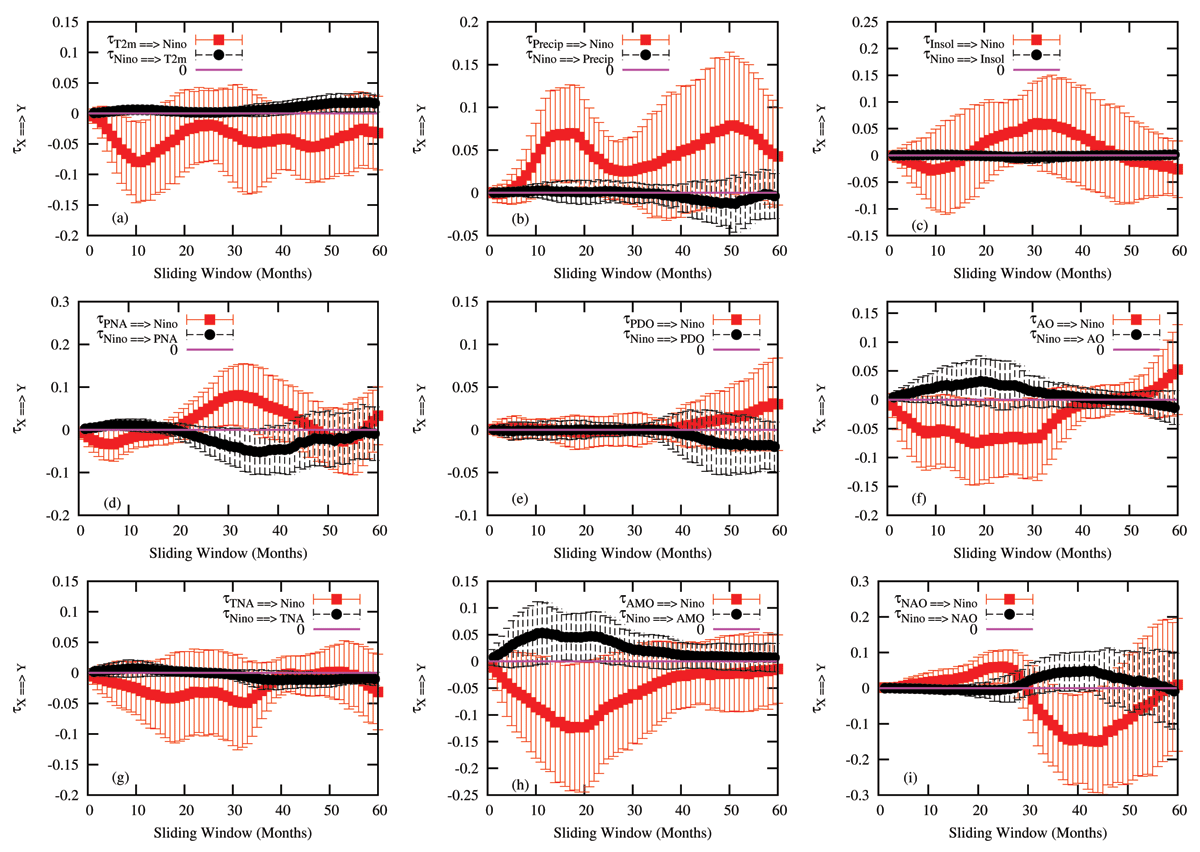
Figure B1
The rate of information transfer as a function of the averaging sliding window. All interactions with El-Niño. Four time series are shifted in time: NAO, PNA, TNA and PDO series by amounts of 200 and 500, 300 and 700 months, respectively.