
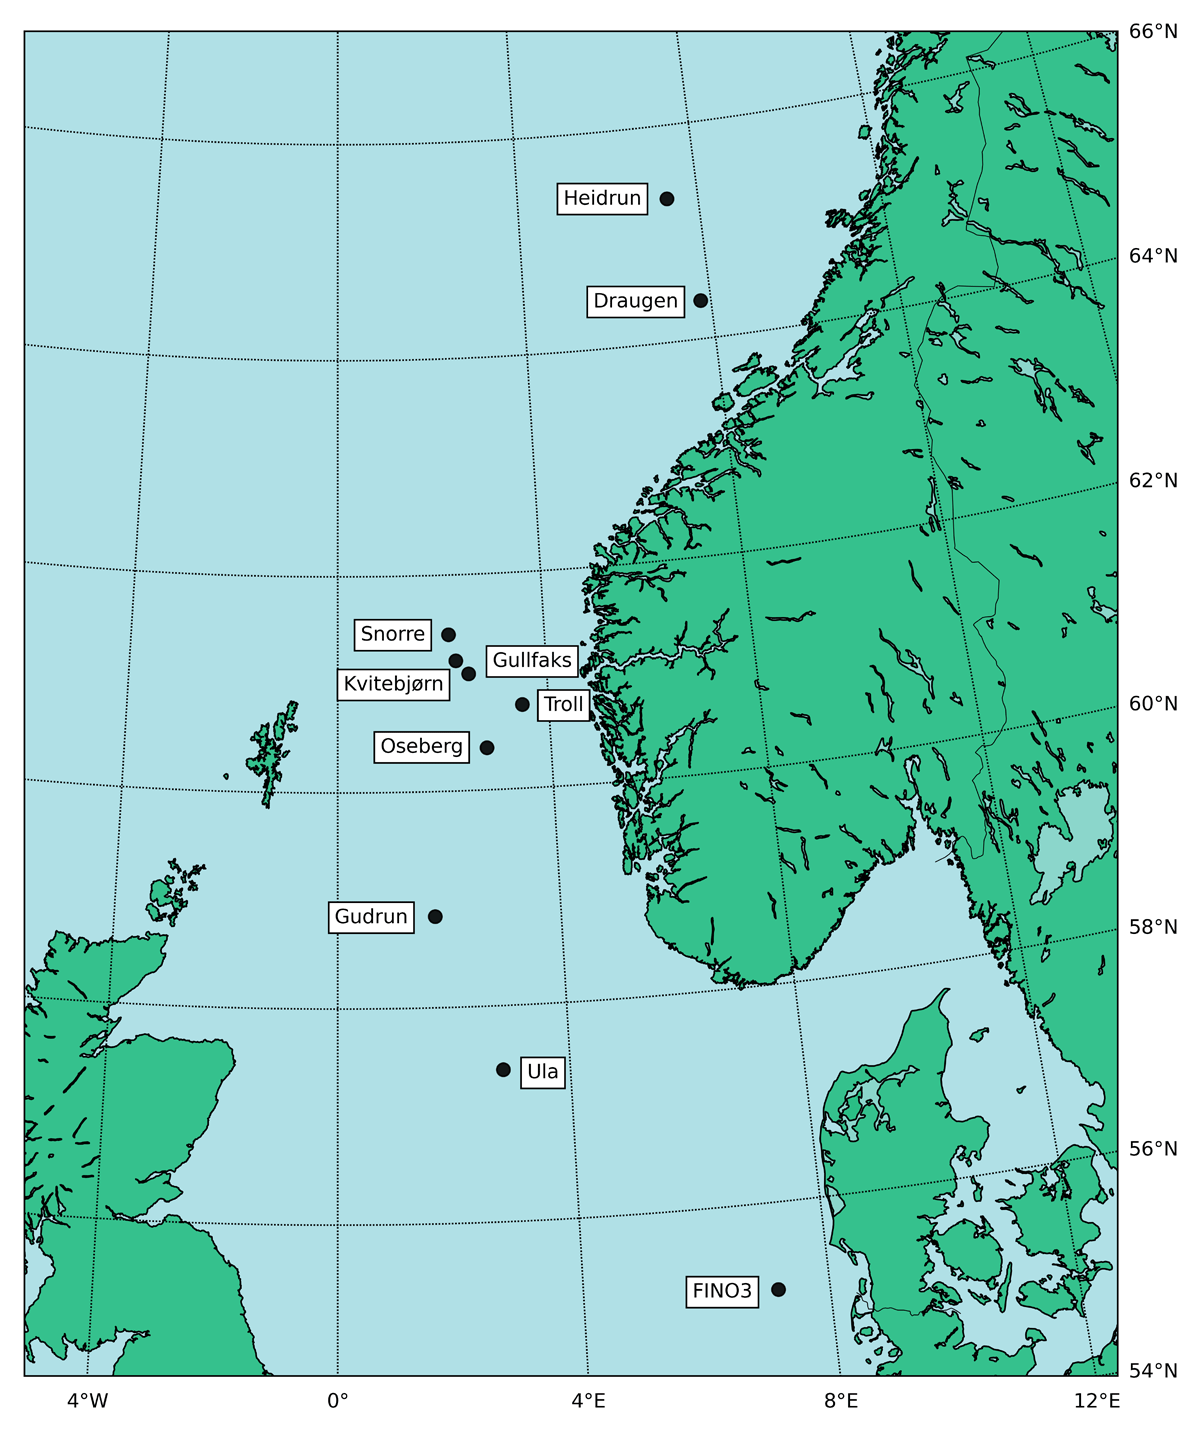
Figure 1
A map showing the location of the nine oil platforms used in this study in addition to the FINO3 wind mast outside Southern Denmark.
Table 1
Location, sensor height and data availability for the nine oil platforms used in this study.
| PLATFORM | LOCATION | SENSOR HEIGHT [M] | AVAILABILITY [%] |
|---|---|---|---|
| Heidrun | N 65.32 E 7.32 | 131 | 99 |
| Draugen | N 64.35 E 7.78 | 78 | 95 |
| Snorre | N 61.45 E 2.14 | 115 | 98 |
| Gullfaks | N 61.20 E 2.27 | 141 | 98 |
| Kvitebjørn | N 61.08 E 2.51 | 115 | 95 |
| Troll | N 60.77 E 3.50 | 84 | 99 |
| Oseberg | N 60.39 E 2.80 | 126 | 98 |
| Gudrun | N 58.85 E 1.74 | 84 | 94 |
| Ula | N 57.41 E 2.85 | 111 | 97 |
Table 2
Classification of the stability according to the Obukhov length intervals.
| STABILITY | OBUKHOV LENGTH |
|---|---|
| Very unstable (VU) | –100 m ≤ L < 0 m |
| Unstable (U) | –200 m ≤ L < –100 m |
| Near neutral – unstable (NU) | –500 m ≤ L < –200 m |
| Neutral (N) | |L| > 500 m |
| Near neutral – stable (NS) | 200 m < L ≤ 500 m |
| Stable (S) | 50 m < L ≤ 200 m |
| Very stable (VS) | 0 m < L ≤ 50 m |
Table 3
Number of observations (N) in addition to mean values of the Obukhov length (L), friction velocity (u*), roughness length (z0) and height of the boundary layer (zi) for the seven stability classes at FINO3 and oil platforms.
| FINO3 EOBS (L, u*, z0 AND zi IS ESTIMATED FROM OBSERVATIONS) | |||||
|---|---|---|---|---|---|
| STABILITY | N | L | u* | z0 | zi |
| Very unstable | 3345 [24%] | –38 | 0.25 | 0.00013 | * |
| Unstable | 2518 [18%] | –140 | 0.35 | 0.00026 | * |
| Near neutral unstable | 2536 [18%] | –290 | 0.41 | 0.00037 | * |
| Neutral | 3366 [24%] | – | 0.42 | 0.00039 | 522 |
| Near neutral stable | 1037 [7%] | 308 | 0.28 | 0.00017 | 328 |
| Stable | 830 [6%] | 109 | 0.19 | 0.00008 | 220 |
| Very stable | 213 [2%] | 9 | 0.12 | 0.00003 | 130 |
| FINO3 ERA5 (L, u*, z0 AND zi FROM ERA5) | |||||
| STABILITY | N | L | u* | z0 | zi |
| Very unstable | 2939 [21%] | –29 | 0.22 | 0.00008 | 755 |
| Unstable | 2055 [15%] | –140 | 0.34 | 0.00019 | 925 |
| Near neutral unstable | 2279 [16%] | –295 | 0.42 | 0.00034 | 998 |
| Neutral | 3422 [25%] | – | 0.46 | 0.00051 | 964 |
| Near neutral stable | 1216 [9%] | 303 | 0.34 | 0.00025 | 677 |
| Stable | 1487 [11%] | 101 | 0.23 | 0.00010 | 384 |
| Very stable | 447 [3%] | 23 | 0.13 | 0.00004 | 180 |
| OIL PLATFORMS (L, u*, z0 AND zi FROM ERA5) | |||||
| STABILITY | N | L | u* | z0 | zi |
| Very unstable | 10699 [34%] | –14 | 0.21 | 0.00008 | 780 |
| Unstable | 4230 [14%] | –139 | 0.35 | 0.00020 | 886 |
| Near neutral unstable | 4611 [15%] | –294 | 0.43 | 0.00035 | 947 |
| Neutral | 7154 [23%] | – | 0.51 | 0.00059 | 950 |
| Near neutral stable | 1978 [6%] | 311 | 0.33 | 0.00023 | 584 |
| Stable | 1877 [6%] | 101 | 0.22 | 0.00010 | 369 |
| Very stable | 503 [2%] | 23 | 0.14 | 0.00005 | 182 |
[i] *The mean value of zi found for neutral conditions (522 m) are also used for all unstable conditions in calculation of the Gryning wind profile (see Section 3.5.4).
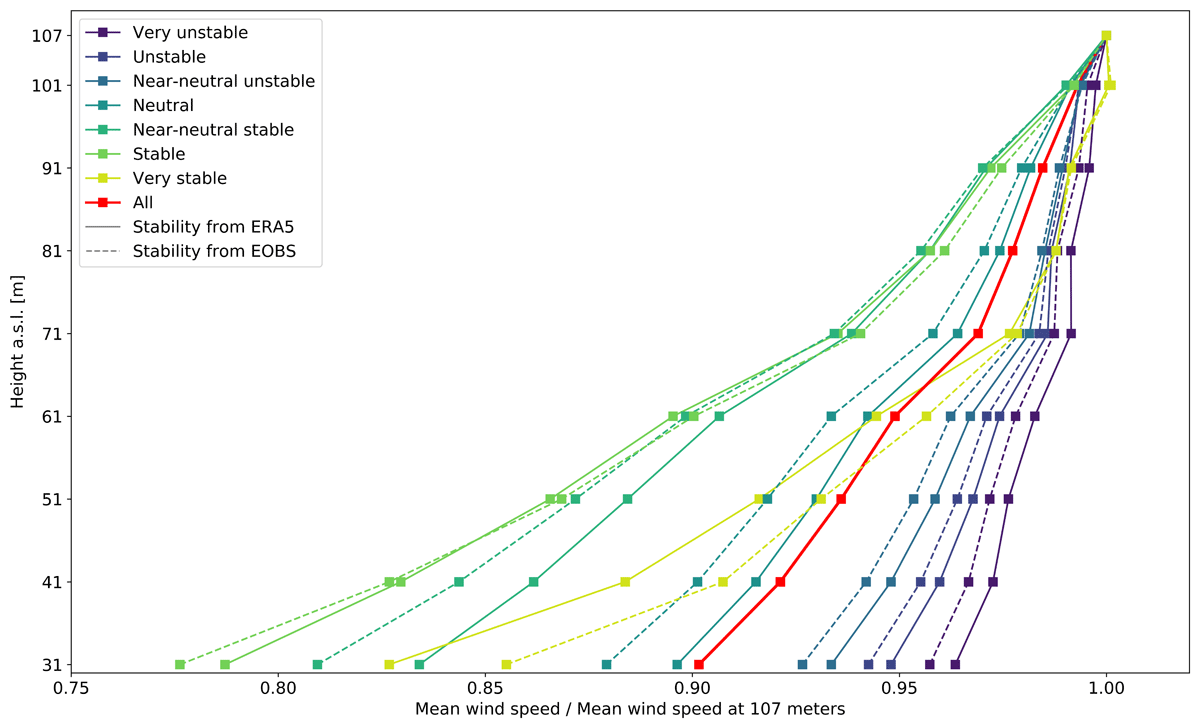
Figure 2
Mean observed wind profiles at FINO3 for the seven stability categories given in Table 2. The stability is classified by the Obukhov length from ERA5 (solid lines) and observations (dashed lines). The mean wind profile for all data is the solid red line.
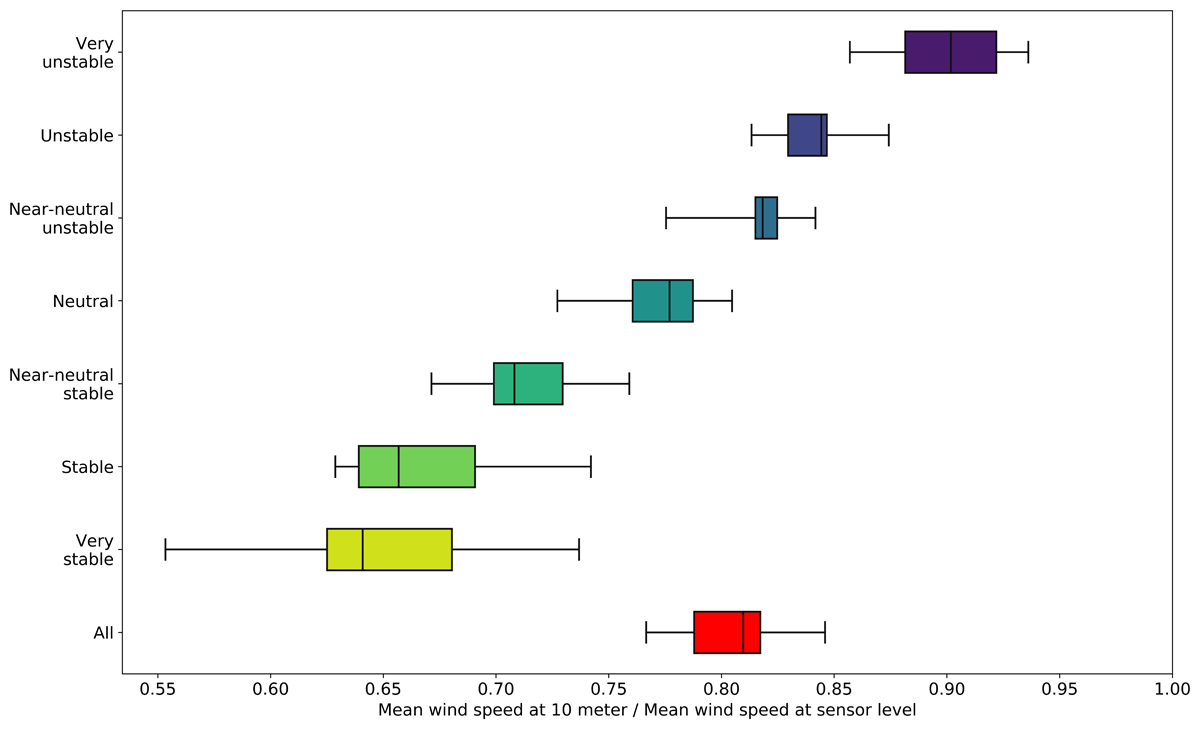
Figure 3
Mean wind reduction at the nine oil platforms for the seven different stability categories (Table 2) and for all data. The box represents the 25, 50 and 75 percentile of the mean wind reduction and whiskers represent min and max.
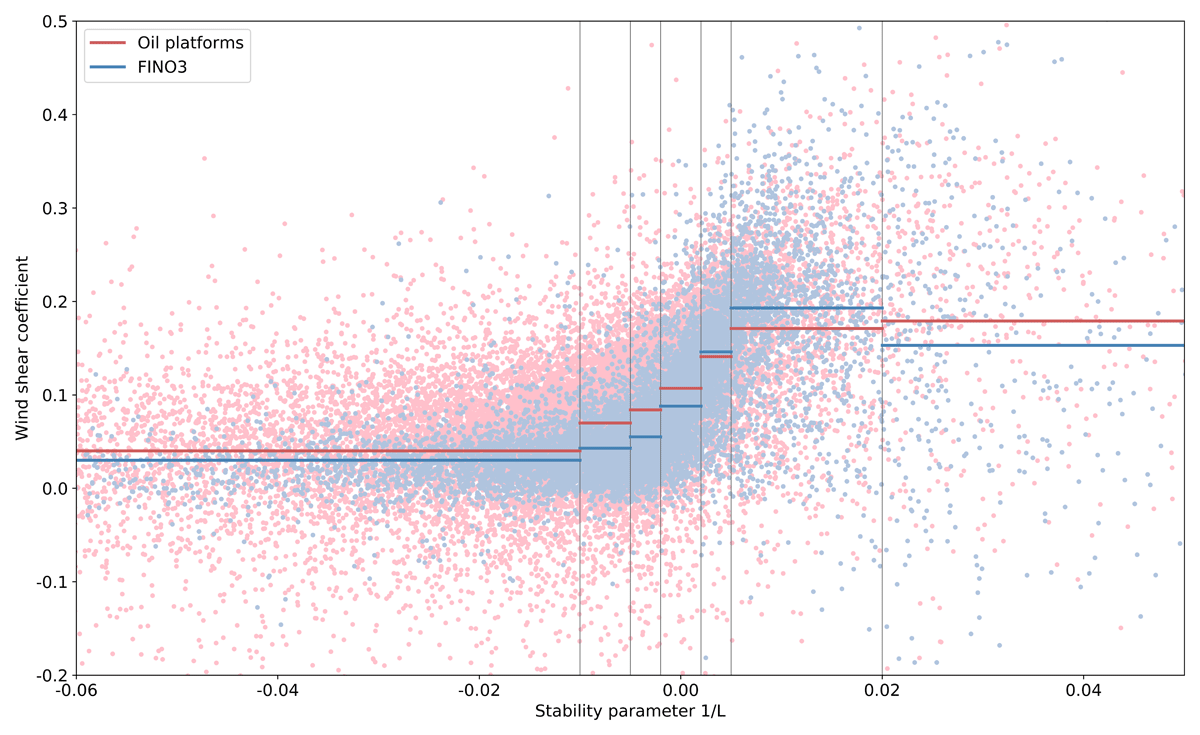
Figure 4
Scatter plot of wind shear coefficient vs the Obukhov length from ERA5 for oil platforms (light red dots) and FINO3 (light blue dots). The solid red and blue lines are the mean wind shear coefficient for each stability category calculated from mean wind speed at sensor level and 10 m for oil platforms and at 107 and 31 m for FINO3 respectively. The dark grey vertical lines mark the border between the different stability categories.
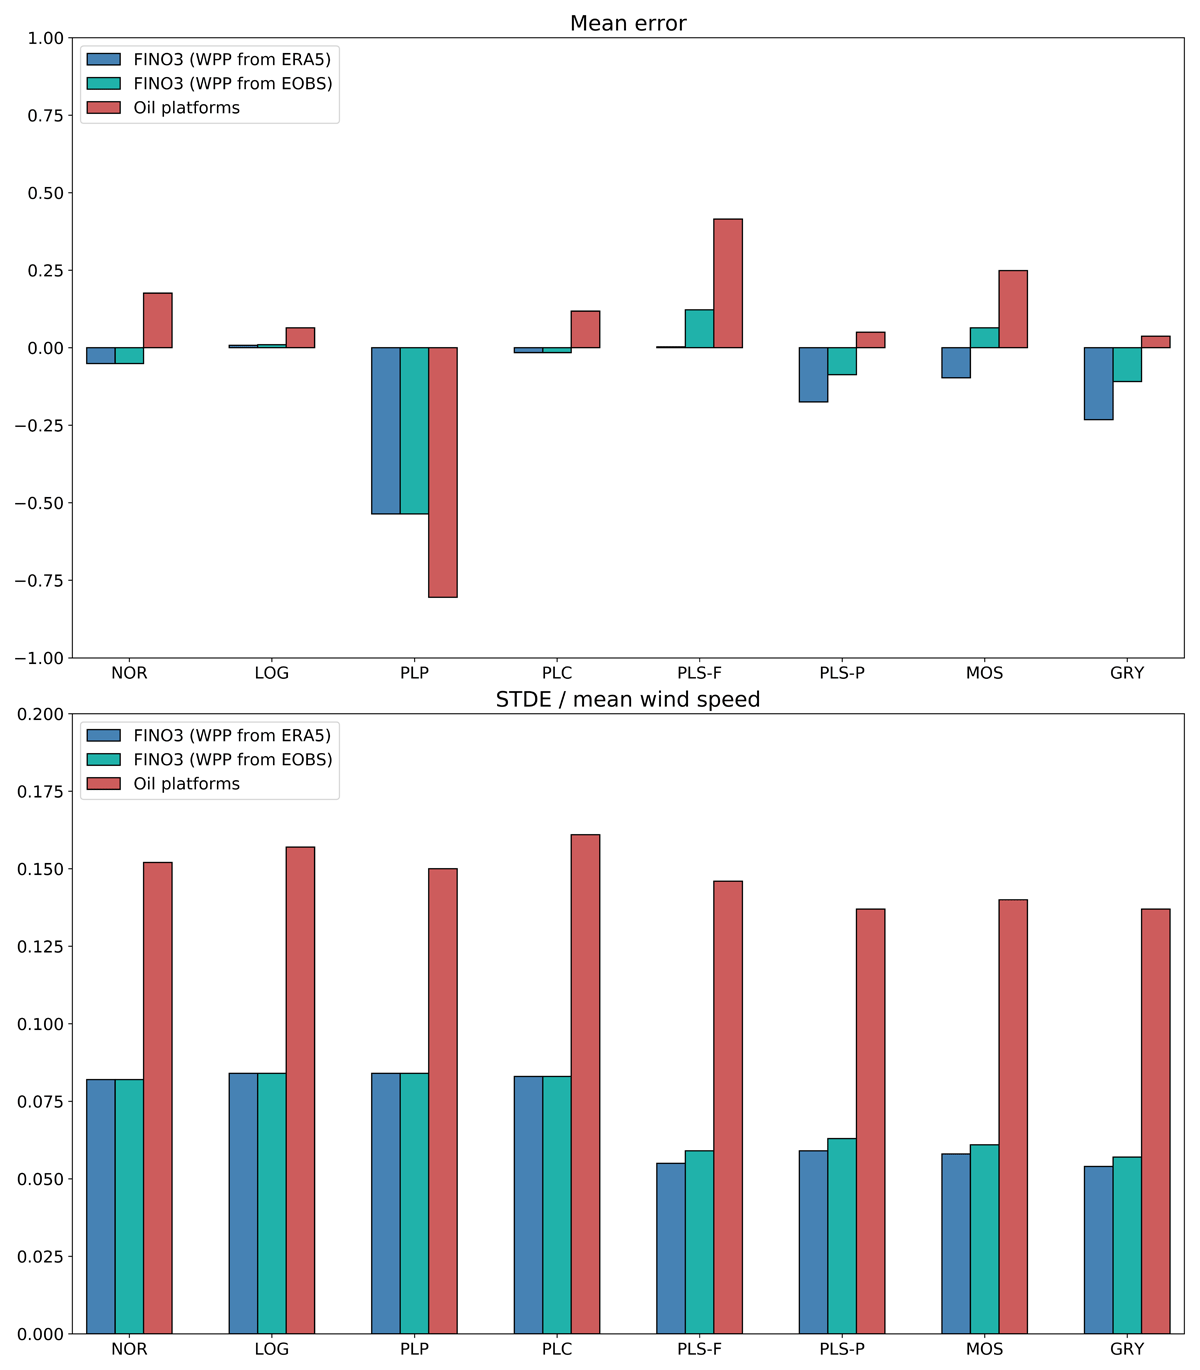
Figure 5
Mean error (ME) (upper panel) and standard deviation of the error (STDE) normalized by the mean wind speed (lower panel) for the five wind profile methods (with four different versions of the power law profile: PLP, PLC, PLS-F and PLS-P). At FINO3 wind profiles are calculated by using Wind Profile Parameters (WPP) based on both ERA5 and observations.
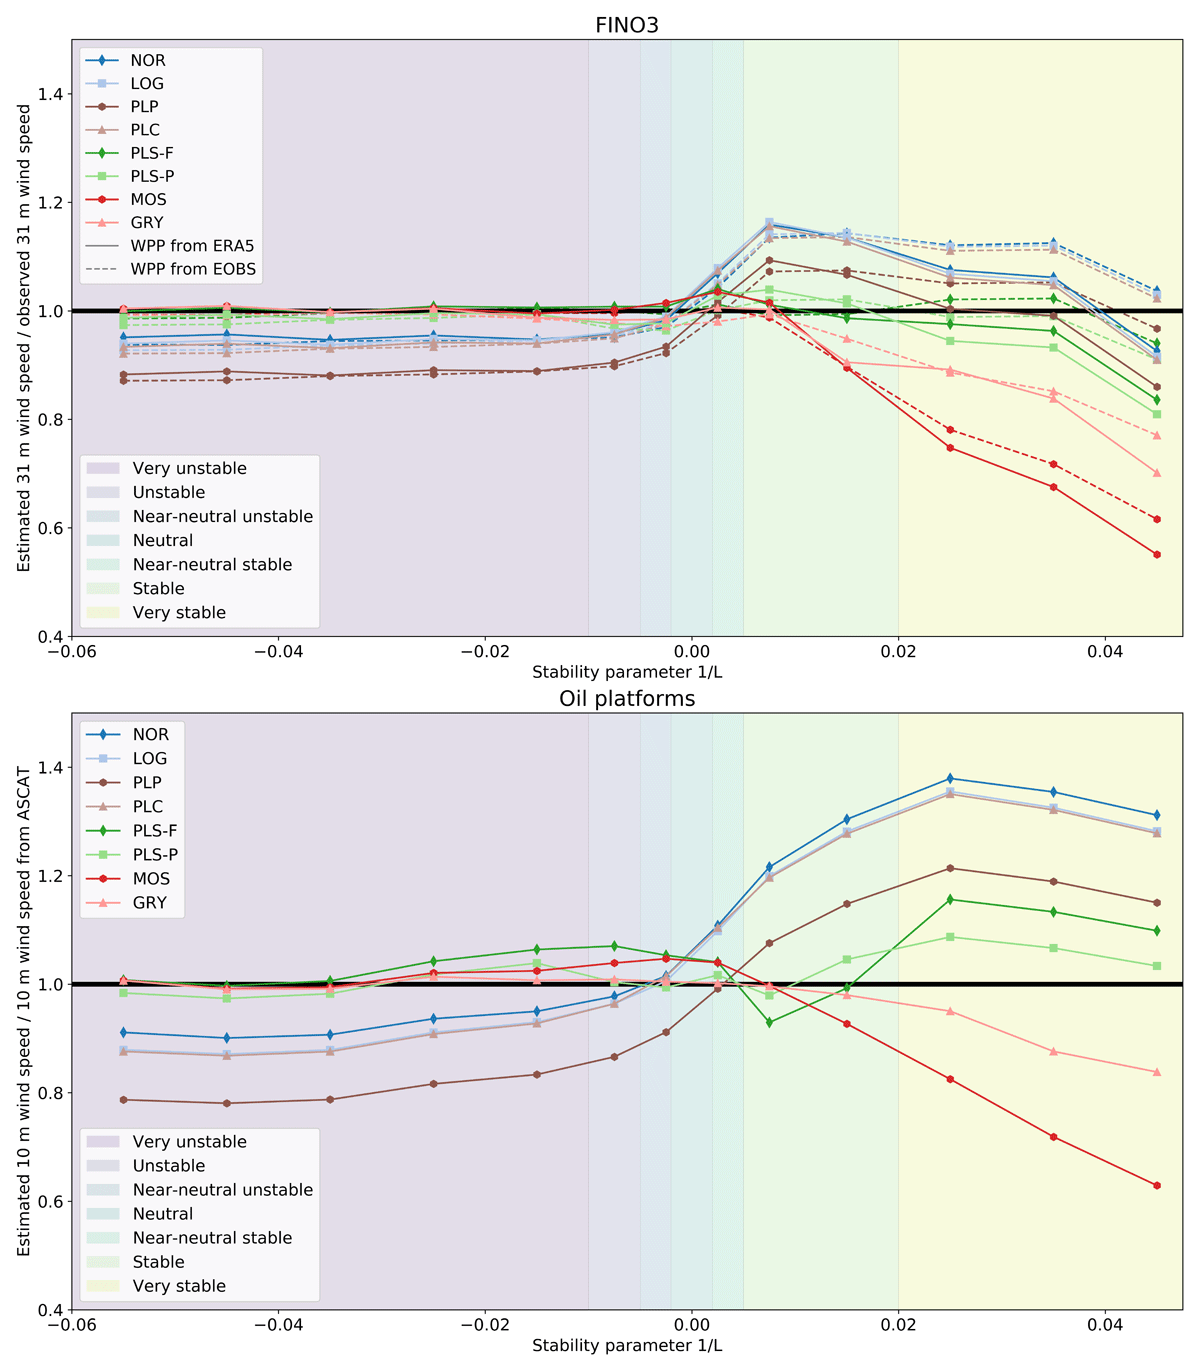
Figure 6
Mean estimated wind speed divided by observed wind speed, as a function of stability at: FINO3 (top) and oil platforms (bottom). FINO3 data are shown when using both Wind Profile Parameters from ERA5 (solid lines) and estimated from observations (dashed lines).