
Table 1
Values of EBM parameters and their multi-model mean and standard deviation given for the 16-model ensemble (all parameter values, with the exception of the climate feedback factor, are taken from Geoffroy et al., 2013).
| MODEL | PARAMETER | |||||
|---|---|---|---|---|---|---|
| C(W yr m–2K–1) | CD(W yr m–2K–1) | γ(W m–2K–1) | λ(W m–2K–1) | f | ||
| 1 | BCC-CSM1-1 | 7.6 | 53 | 0.67 | 1.21 | 0.64 |
| 2 | BNU-ESM | 7.4 | 90 | 0.53 | 0.93 | 0.72 |
| 3 | CanESM2 | 7.3 | 71 | 0.59 | 1.03 | 0.69 |
| 4 | CCSM4 | 6.1 | 69 | 0.93 | 1.24 | 0.63 |
| 5 | CNRM-CM5 | 8.4 | 99 | 0.50 | 1.11 | 0.67 |
| 6 | CSIRO-Mk3.6.0 | 6.0 | 69 | 0.88 | 0.61 | 0.82 |
| 7 | FGOALS-s2 | 7.0 | 127 | 0.76 | 0.88 | 0.74 |
| 8 | GFDL-ESM2M | 8.1 | 105 | 0.90 | 1.34 | 0.60 |
| 9 | GISS-E2-R | 4.7 | 126 | 1.16 | 1.70 | 0.49 |
| 10 | HadGEM2-ES | 6.5 | 82 | 0.55 | 0.65 | 0.81 |
| 11 | INM-CM4 | 8.6 | 317 | 0.65 | 1.51 | 0.55 |
| 12 | IPSL-CM5A-LR | 7.7 | 95 | 0.59 | 0.79 | 0.76 |
| 13 | MIROC5 | 8.3 | 145 | 0.76 | 1.58 | 0.53 |
| 14 | MPI-ESM-LR | 7.3 | 71 | 0.72 | 1.14 | 0.66 |
| 15 | MRI-CGCM3 | 8.5 | 64 | 0.66 | 1.26 | 0.62 |
| 16 | NorESM1-M | 8.0 | 105 | 0.88 | 1.11 | 0.67 |
| Mean | 7.3 | 106 | 0.73 | 1.13 | 0.66 | |
| STD | 1.1 | 62 | 0.18 | 0.31 | 0.09 | |
Table 2
Base values of model parameters and their ranges of change.
| PARAMETER (p) | MEAN VALUE (pavg) | RANGE(pmin≤ p≤ pmax) | |
|---|---|---|---|
| C, | W yr m–2K–1 | 7.34 | 4.7 ≤ C ≤ 8.6 |
| CD, | W yr m–2K–1 | 105.5 | 53 ≤ CD ≤ 145 |
| λ, | W m–2K–1 | 1.13 | 0.61 ≤ λ ≤ 1.70 |
| γ, | W m–2K–1 | 0.73 | 0.50 ≤ γ ≤ 1.16 |
| σs, | W m–2 | 0.26 | 0.16 ≤ σs ≤ 0.40 |
| f | 0.66 | 0.49 ≤ f ≤ 0.82 | |
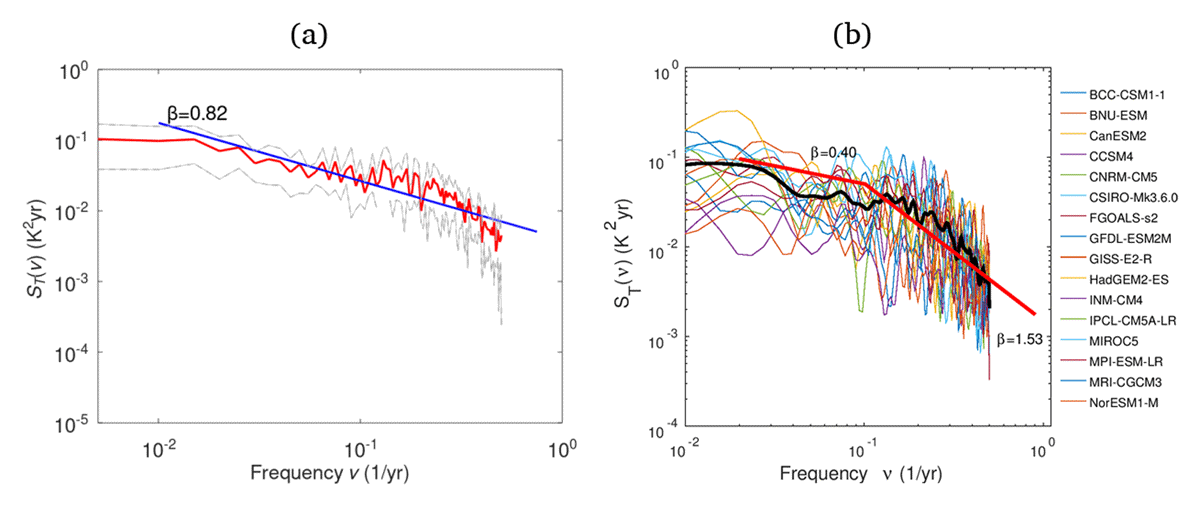
Figure 1
Power spectra of the global mean surface temperature (GMST) fluctuations derived from historical (200 years) runs of 16 CMIP5 models: (a) the ensemble average power spectrum (red) and the characteristic 1/ν0.82 slope (blue); (b) the thin colored lines correspond to the individual ensemble members, while the thick black curve shows the ensemble average power spectrum, and the red lines show the characteristic 1/ν0.40 slope for frequencies less than 10–1 1/yr and the characteristic 1/ν1.53 for frequencies more than 10–1 1/yr.
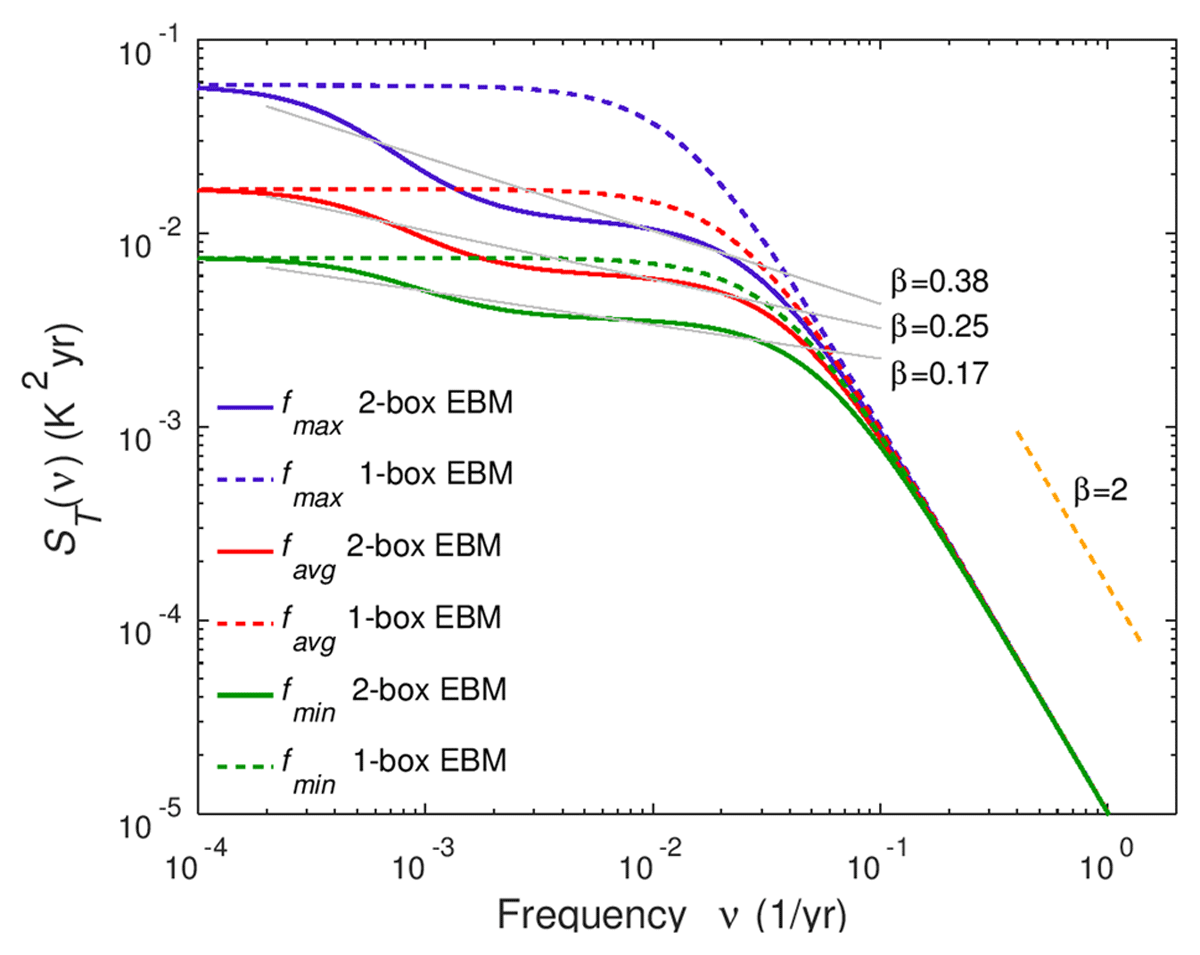
Figure 2
Power spectra of the global mean surface temperature fluctuations derived from the one- and two-box EBMs for different values of feedback factor f listed in Table 2. The orange dashed line shows the characteristic 1/ν2 slope.
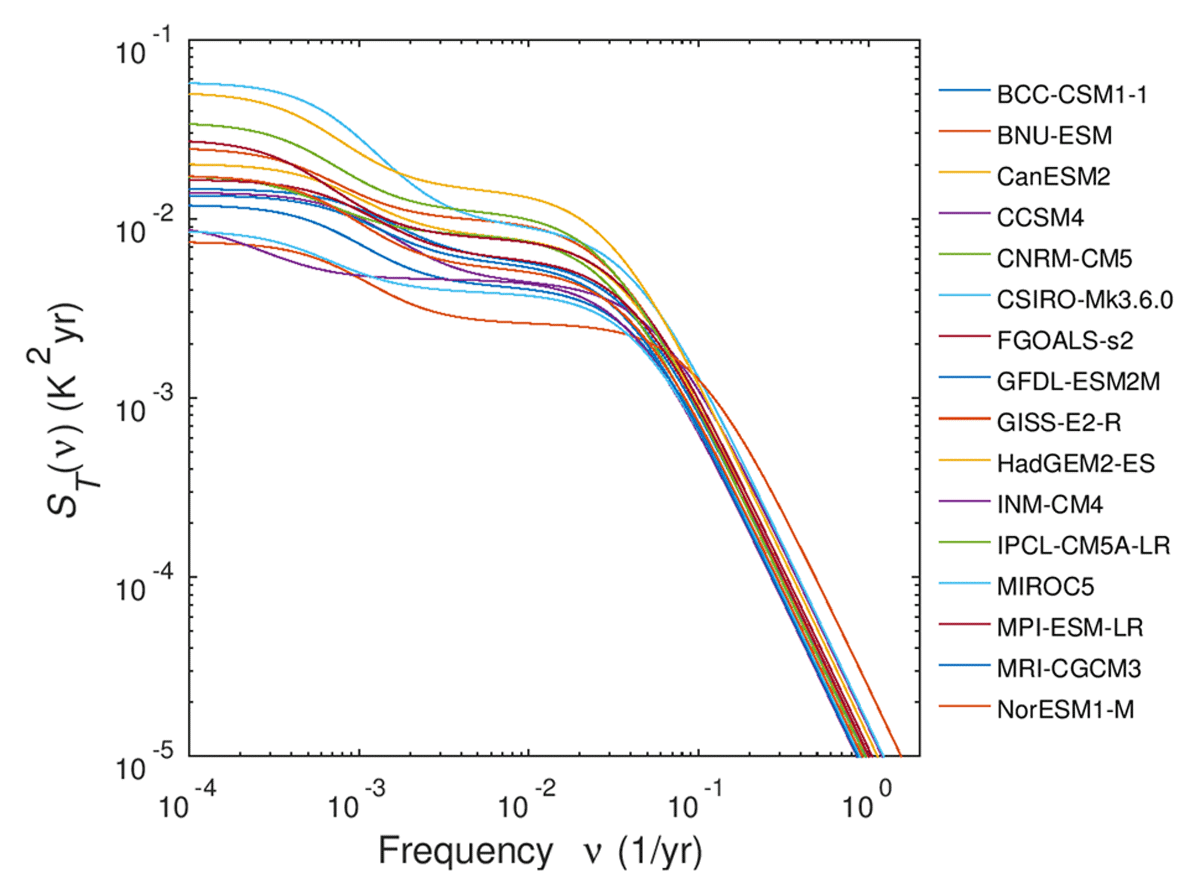
Figure 3
Power spectra of the global mean surface temperature fluctuations derived from the two-box EBM with 16 parameter sets listed in Table 1. The thin colored lines correspond to the individual ensemble members.
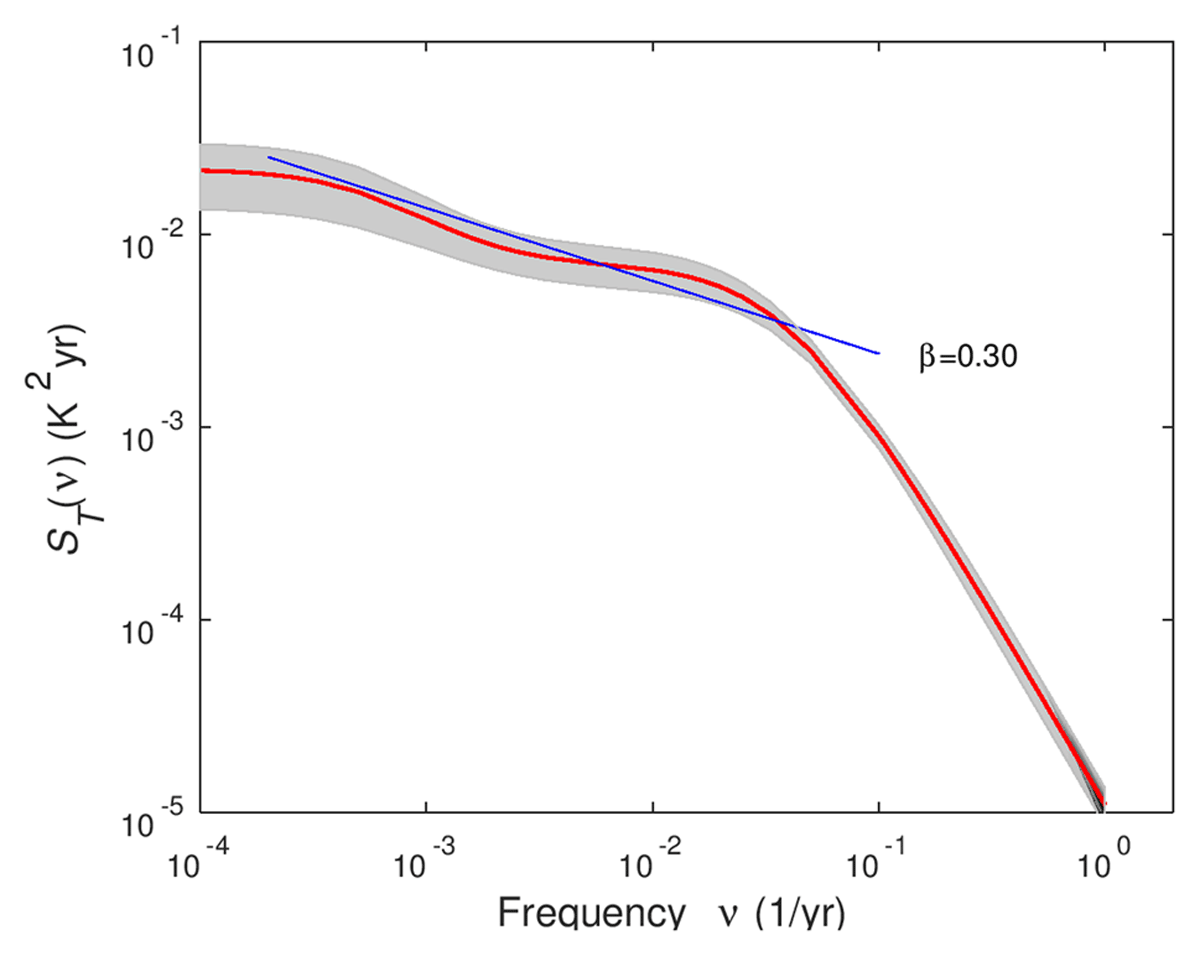
Figure 4
The ensemble average power spectrum of the global mean surface temperature fluctuations (red curve) derived from the two-box EBM with 16 sets of the parameters listed in Table 1. Grey shading shows the 95%confidence interval calculated from model spread. The blue line shows the characteristic 1/ν0.30 slope.
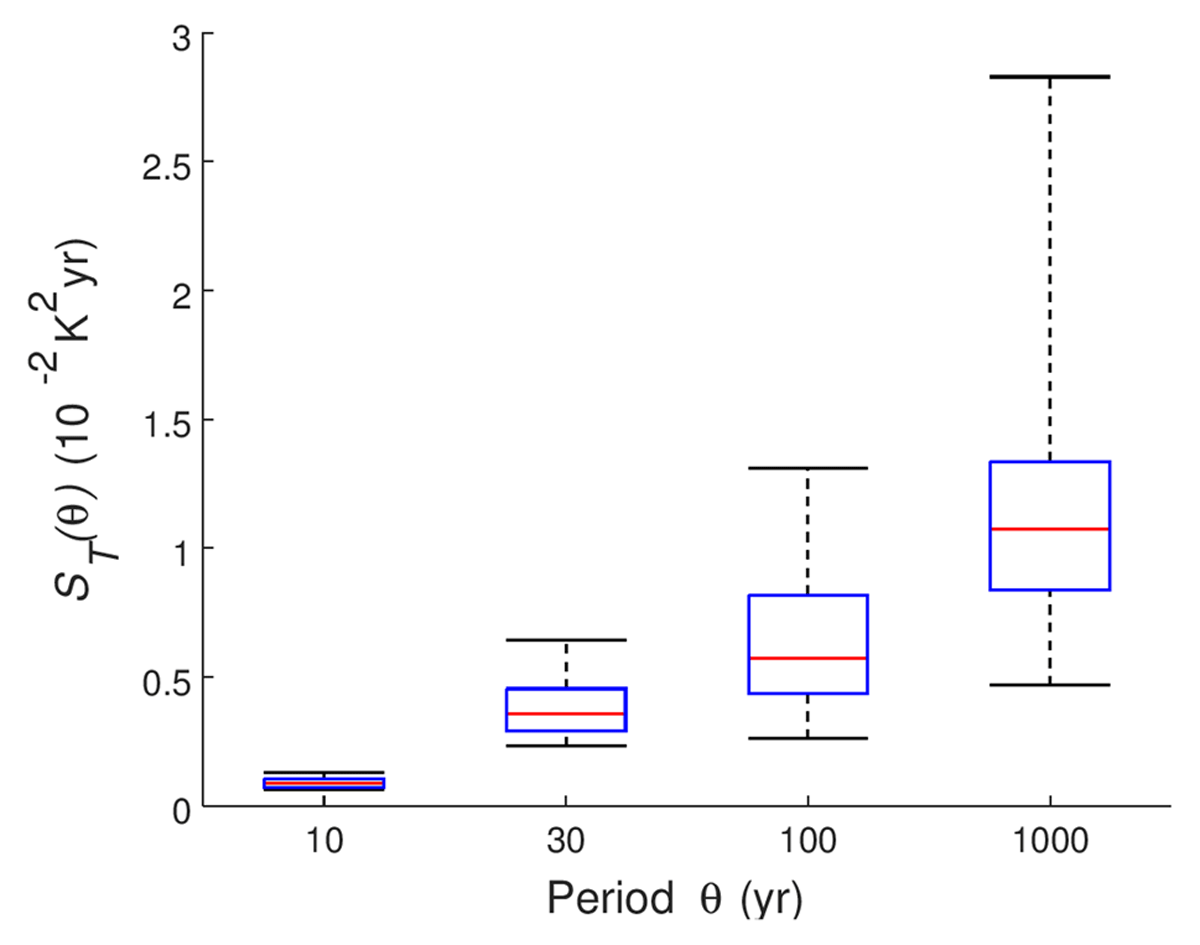
Figure 5
The box-and-whisker plots showing the temporal changes in power spectra across an ensemble of 16 EBMs.
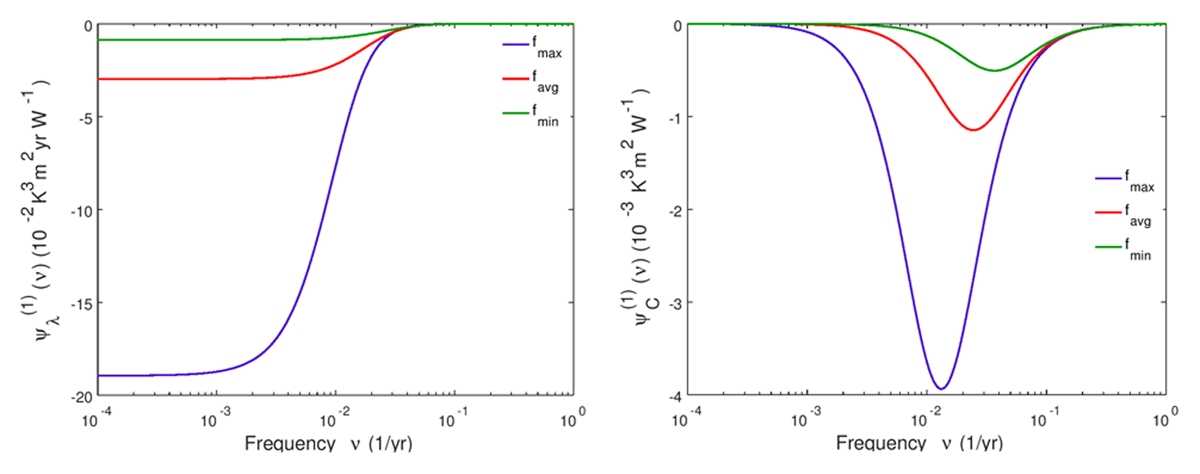
Figure 6
Absolute sensitivity functions and for the one-box EBM power spectral density with respect to parameters λ and C calculated for the highest (fmax), lowest (fmin) and average (favd) values of feedback factor f listed in Table 2.
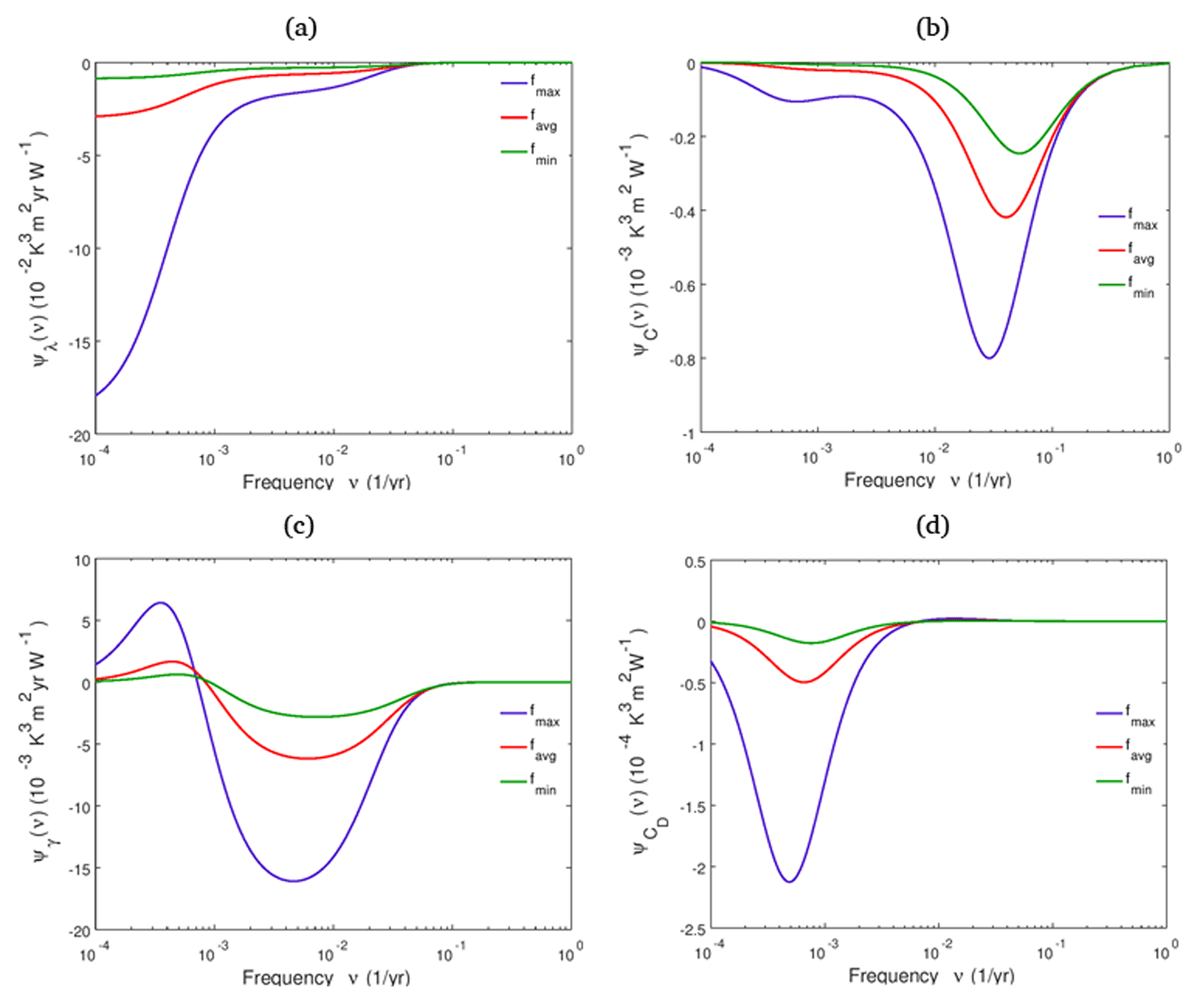
Figure 7
Absolute sensitivity functions ψλ, ψC, ψγ and ψCD for the two-box EBM power spectral density with respect to parameters λ, C, γ and CD, respectively, calculated for the highest (fmax), lowest (fmin) and average (favd) values of feedback factor f listed in Table 2.
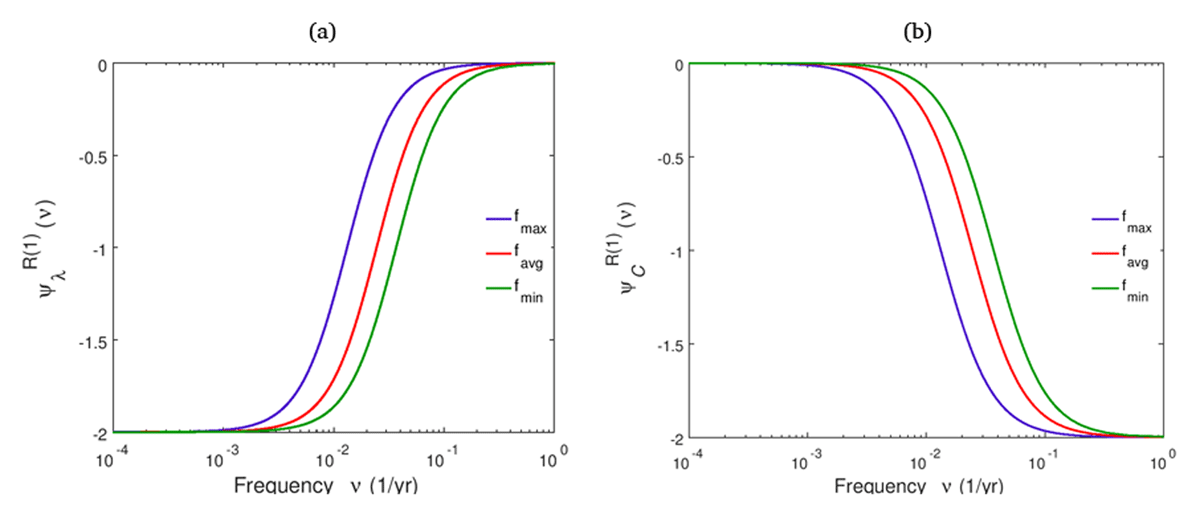
Figure 8
Relative sensitivity functions and for the one-box EBM power spectral density with respect to parameters λ and C calculated for the highest (fmax), lowest (fmin) and average (favd) values of feedback factor f listed in Table 2.
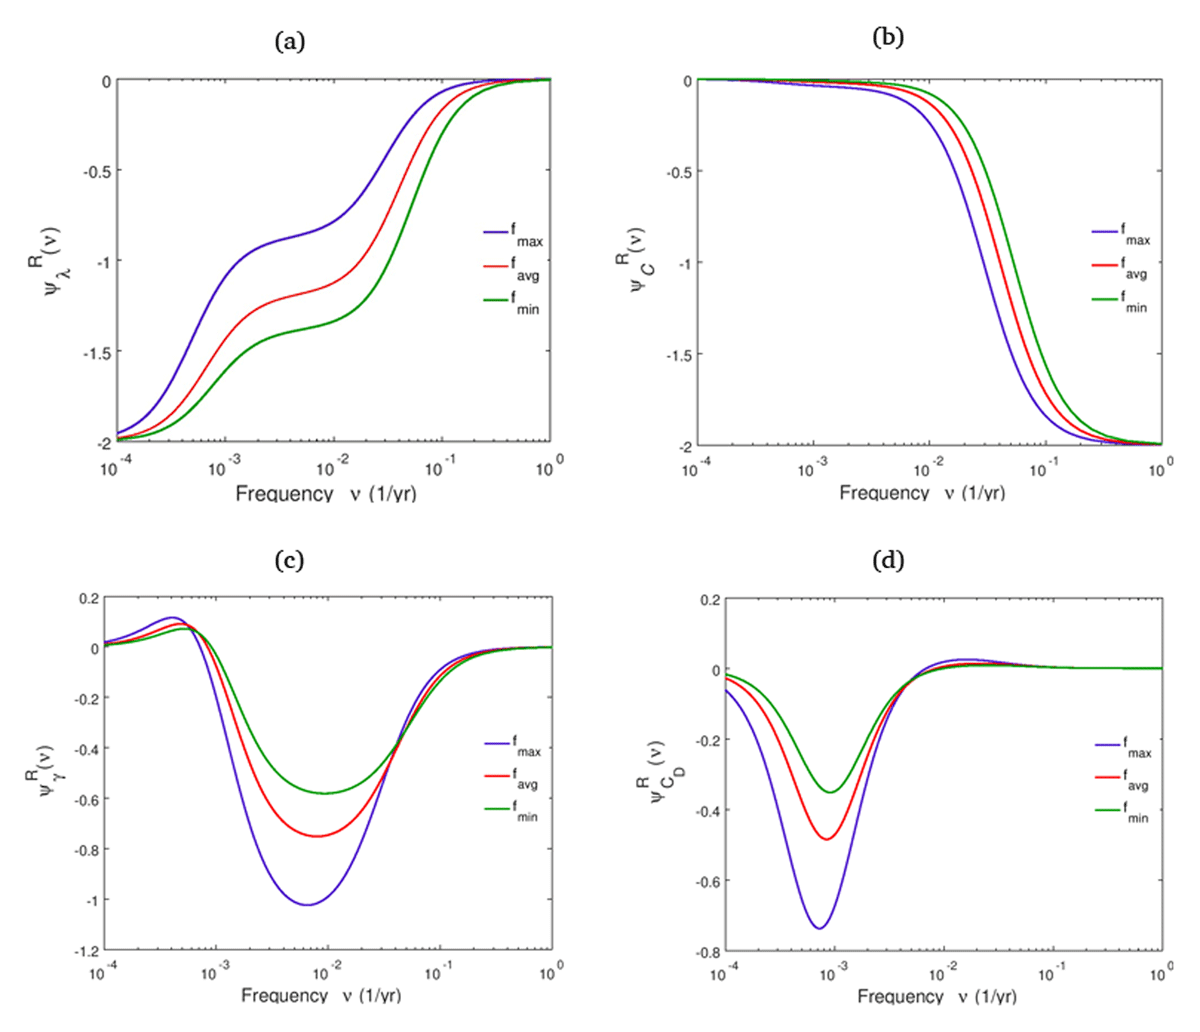
Figure 9
Relative sensitivity functions , , and for the two-box EBM power spectral density with respect to parameters λ, C, γ and CD calculated for the highest (fmax), lowest (fmin) and average (favd) values of feedback factor f listed in see Table 2.
Table 3
The modulus of absolute and relative sensitivity functions with respect to the two-box EMB parameters, and the corresponding absolute δ(ST) (K2yr) and relative [δ(ST)/ST] (%) uncertainties in power spectrum caused by one-sigma uncertainty in model parameters.
| PARAMETER | λ (W m–2K–1) | C(W yr m–2K–1) | CD(W yr m–2K–1) | γ (W m–2K–1) |
|---|---|---|---|---|
| One-sigma parameter uncertainties from GCMs | ±0.31 | ±1.10 | ±62.60 | ±0.18 |
| Period of GMST fluctuations T = 2 yr | ||||
| |ψα| | 2.79 × 10⁻⁵ | 1.09 × 10⁻⁵ | 5.28 × 10⁻¹¹ | 2.95 × 10⁻⁷ |
| 0.008 | 1.99 | 1.38 × 10⁻⁴ | 0.005 | |
| δ(ST) (K2yr) | ±8.66 × 10⁻⁸ | ±1.20 × 10⁻⁵ | ±3.30 × 10⁻⁹ | ±5.30 × 10⁻⁸ |
| [δ(ST)/ST] × 100% | ±0.2 | ±29.8 | ±0.008 | ±0.1 |
| Period of GMST fluctuations T = 10 yr | ||||
| |ψα| | 1.13 × 10⁻⁴ | 2.03 × 10⁻⁴ | 2.44 × 10⁻⁸ | 1.37 × 10⁻⁴ |
| 0.17 | 1.72 | 0.003 | 0.12 | |
| δ(ST) (K2yr) | ±4.03 × 10⁻⁵ | ±2.23 × 10⁻⁴ | ±1.53 × 10⁻⁶ | ±2.47 × 10⁻⁵ |
| [δ(ST)/ST] × 100% | ±4.7 | ±25.7 | ±0.2 | ±2.8 |
| Period of GMST fluctuations T = 30 yr | ||||
| |ψα| | 2.30 × 10⁻³ | 4.05 × 10⁻⁴ | 4.06 × 10⁻⁷ | 2.42 × 10⁻³ |
| 0.71 | 0.81 | 0.01 | 0.48 | |
| δ(ST) (K2yr) | ±7.14 × 10⁻⁴ | ±4.46 × 10⁻⁴ | ±2.54 × 10⁻⁵ | ±4.36 × 10⁻⁴ |
| [δ(ST)/ST] × 100% | ±19.6 | ±12.2 | ±0.7 | ±11.9 |
| Period of GMST fluctuations T = 102 yr | ||||
| |ψα| | 5.76 × 10⁻³ | 1.06 × 10⁻⁴ | 2.92 × 10⁻⁷ | 5.92 × 10⁻³ |
| 1.12 | 0.13 | 0.005 | 0.75 | |
| δ(ST) (K2yr) | ±1.793 × 10⁻³ | ±1.17 × 10⁻⁴ | ±1.83 × 10⁻⁵ | ±1.06 × 10⁻³ |
| [δ(ST)/ST] × 100% | ±30.9 | ±2.0 | ±0.3 | ±18.4 |
| Period of GMST fluctuations T = 103 yr | ||||
| |ψα| | 1.19 × 10⁻² | 2.09 × 10⁻⁵ | 4.19 × 10⁻⁵ | 9.83 × 10⁻⁴ |
| 1.44 | 0.02 | 0.47 | 0.08 | |
| δ(ST) (K2yr) | ±3.69 × 10⁻³ | 2.30 × 10⁻⁵ | ±2.59 × 10⁻³ | 1.77 × 10⁻⁴ |
| [δ(ST)/ST] × 100% | ±39.4 | ±0.2 | ±28.0 | ±1.9 |
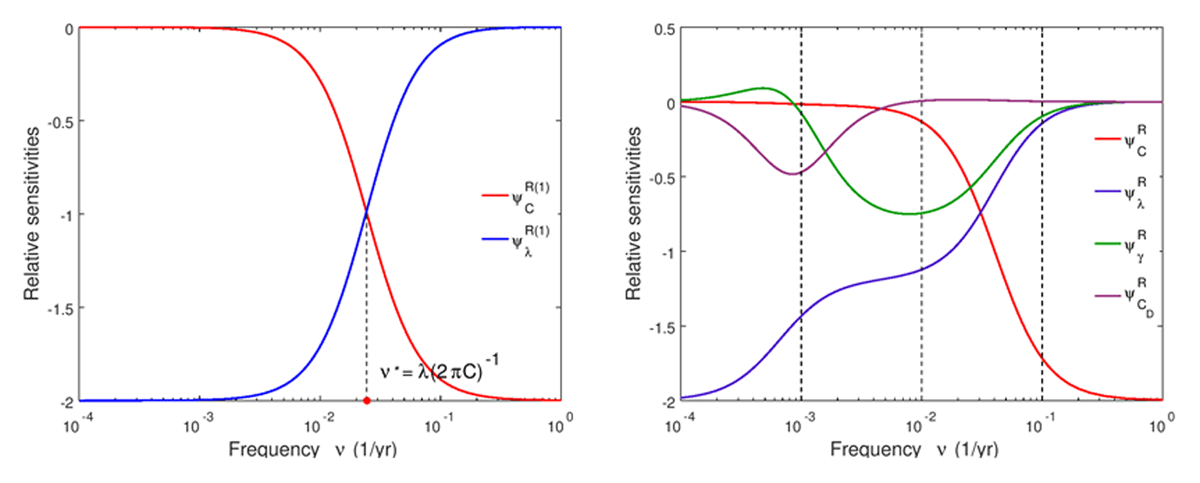
Figure 10
Relative sensitivity functions of the power spectral density of the global mean surface temperature fluctuations with respect to (a) one- and (b) two-box EBMs parameters calculated for the average value of feedback factor favd.