
1. Introduction
Tropical cyclones (TCs) are the most extreme weather events on our planet, causing severe harm to coastal communities and major economic damage (Mendelsohn et al., 2012). TCs play an essential role in the global climate system by mixing additional heat in their wake, which propagates with ocean’s meridional heat transport (Emanuel, 2001). A feedback loop exists as the TC converts thermal energy from sensible and latent heat into mechanical energy (Emanuel et al., 2004), and the resulting strong winds mix warm surface water with deeper water masses in its wake. In situ and satellite observations have been reported for numerous cases using ARGO floats, drifters, moorings and gliders (e.g., D’Asaro et al., 2007; Girishkumar et al., 2014; Park et al., 2011; Wang et al., 2022; Zhang et al., 2021). The cooling of sea-surface temperature (SST) in the wake of a TC is primarily caused by turbulent mixing, and the divergence of surface water masses with upwelling of cooler water masses; cooling of up to 6°C has been reported (Zhang et al., 2021). The deeper water masses spread the additional heat poleward with the global circulation. The additional heat originated from TC-induced mixing has been estimated to be 0.6 PW (Sriver et al., 2008) and is a large fraction of the total amount of 3 PW transported out of the tropics (Ferrari and Ferreira, 2011).
Trends in the occurrence of TCs with global warming are debated due to the complexity of the climatological processes involved, such as the shift of the Intertropical Convergence Zone (Basconcillo and Moon, 2021), weakening of the Hadley and Walker circulations (Chand et al., 2022), El Nino/La Nina events (Klotzbach et al., 2022), ocean surface warming (Yamaguchi et al., 2020), and the ability of a warmer atmosphere to hold more water vapor (Held and Soden, 2006). Thus, applying different coupled global climate models leads to conflicting results, e.g., depending on their spatial resolution (Vecchi et al., 2019). The International Panel on Climate Change suggests an intensification of tropical cyclones in the future with moderate certainty (Lee et al., 2023). This is consistent with a global trend toward ocean surface cooling due to increasing TC intensities (Da et al., 2021), with the consequence that more energy is mixed into deeper water masses and flows out of tropical areas as outlined above. Outflow from tropical regions could be enhanced as tropical cyclone propagation has shifted from west to north in the northern hemisphere, due to atmospheric anomalies south of 20°N in the South China Sea and western North Pacific (Sun et al., 2019) or due to changes in cyclone seasonality (Feng et al., 2021).
In this context, the impact of the Fujiwhara effect (Prieto et al., 2003)—describing the binary interaction between two TCs in close proximity—on the physical environment of the upper ocean is not well understood. Several criteria must be met for a binary interaction. It includes a distance between both TCs of less than 1600 km, wind intensities of at least 65 km h–1, and a co-existence of both TCs for 24 hours (Jang and Chun, 2015). Binary interaction of two TCs has been classified into five modes of interaction (Prieto et al., 2003): (a) complete merger, (b) partial merger, (c) complete straining out, (d) partial straining out and (e) elastic interaction, and during interaction sudden changes in both tracks can occur. Despite the rare occurrence, with an annual average of 1.58 (Jang and Chun, 2015), the intensification upon complete merge and the sudden change of direction of TCs represent the most extreme atmospheric interactions with the ocean.
We examine temperature-depth profiles, ocean heat content and vertical seawater velocities as a response of the upper ocean to the binary interaction between the TCs Odette and Seroja. TC Seroja temporarily arrested TC Odette in its track, and then absorbed TC Odette completely with the consequence of re-intensification of TC Seroja and a sudden change of approximately 90° in its track. This sequence of binary interactions is very rare and is associated with one of the most extreme interactions between the ocean and atmosphere. It is the first report on ocean response upon the merging of two TCs.
2. Materials and Methods
We obtained observations of TC Seroja (AU202021_22U) and TC Odette (AU202021_23U) from the International Best Track Archive for Climate Stewardship (IBTrACS, Knapp et al., 2010). It includes data on best track (Figure 1), atmospheric pressure, sustained wind speeds and radius. Wind speed data and their radial extents of 63 km h–1 and maximum wind speed were obtained from the agencies of the World Meteorological Organization (WMO), located in the United States, because of the complete availability of data for the occurrence of TC Seroja and Odette. We would like to note that reported data on wind speeds can vary among WMO agencies owing to procedural processing. The wind data in Figure 1 and those mentioned in the text were obtained from the WMO (USA) and archived in IBTrACS. This dataset also includes the radii of the maximum and 63 km h–1 wind speeds, which are discussed in the context of the geographical ascends of ARGO floats. It should be noted that data on vertical velocities from the reanalysis product Operational Mercator Global Ocean Analysis and Forecast System were used in this study (see below). The computation of the vertical velocities are based on the wind speeds provided by the European Centre for Medium-Range Weather Forecasts (ECWMF). Determining wind speeds in the presence of TCs is difficult because of different interferences (e.g., due to rain). Therefore, the wind data from the WMO(USA) and ECWMF were compared and are briefly described in the supplementary information (Figure S1). These data were compared with wind data from the Advanced Microwave Scanning Radiometer 2 (AMSR2) provided by the Remote Sensing Group (www.remss.com). The AMSR2 data are based on an algorithm tuned for TCs, but have limited temporal resolution; therefore, they were only used for further comparison. Overall, discrepancy between the wind speeds of the different sources can exceed 10 km h–1, but no consistent underestimation by one source can be confirmed. Knaff et al. (2021) reviewed TC surface wind estimation techniques, and found that the available techniques provide maximum wind speeds within an uncertainity of 18 km h–1.
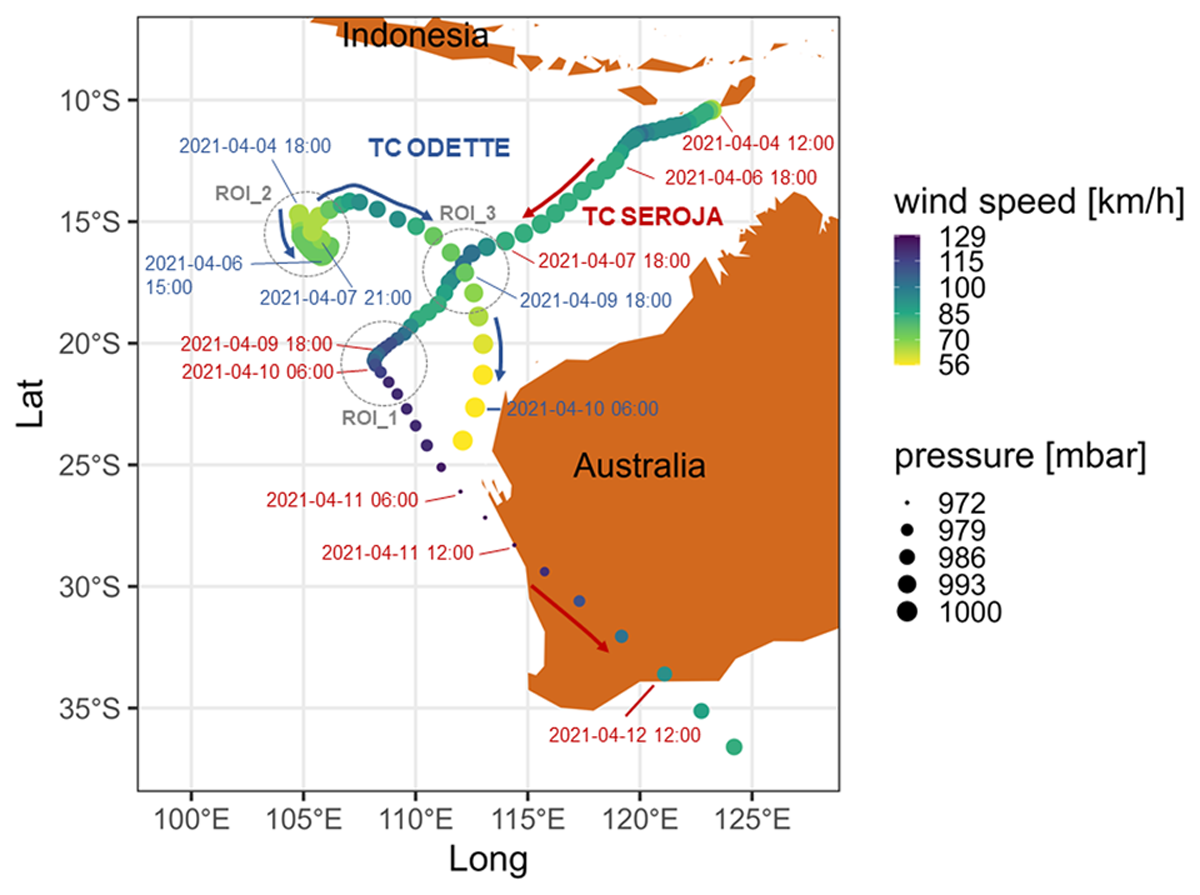
Figure 1
Best tracks of TC Seroja (red labels) and TC Odette (blue labels) with wind speed (color) and atmospheric pressure (size of dots). Label represents date (yyyy-mm-dd) and time (hh:mm) in UTC. Three regions of Interests (ROI) are indicated with circles in dashed gray lines. Arrows indicate direction of TCs propagation.
We used thermal infrared images (TIR) from the geostationary satellite Himawari 8 to analyze the binary interaction between TC Seroja and TC Odette. TIR images are accessible from the JAXA Himawari Monitor (Japan Aerospace Exploration Agency; https://www.eorc.jaxa.jp/ptree/index.html).
We analyzed the following remote sensing and ARGO float data within the region 8°S to 36°S and 99°E to 127°E. The time window of data analyses started at 28 March 2021 and continued through 12 May 2021. We used daily SST data from the Australian Bureau of Meteorology based on the Regional Australian Multi-Sensor SST Analysis (RAMSSA, https://podaac.jpl.nasa.gov/dataset/ABOM-L4HRfnd-AUS-RAMSSA_09km) with a spatial and temporal resolution of 9 km × 9 km and daily, respectively. This SST data product is described by Beggs et al. (2011). Briefly, the SST data product is based on optimal interpolation and blends satellite SST observations from passive infrared and microwave radiometers. Observations were compared with in-situ data to compute standard deviation errors as quality flags. Biases on nocturnal cooling and diurnal warming were eliminated. We calculated the average daily SST values 28 March, 3 to 14 April, 17 April, 22 April, 2 May and 12 May for the years 2010 to 2020 as a reference. SST anomalies were calculated as the difference between the daily SST of 2021 minus the average SST between 2010 and 2020. These SST anomalies represent the cooling induced by the TCs in comparison to typical SST features in the region. Cooling relative to SST values prior TC passage is obtained from ARGO float and drifter data (see below). We analyzed SST in three circular regions, each 365 km in diameter, for better comparison. The regions of interest (ROI) with the following centered positions were selected by the following characteristics: ROI_1 (20.50°S, 108.41°E) is characterized by a sudden change in the track of TC Seroja after merging with TC Odette. ROI_2 (15.35°S, 105.15°E) is the region where TC Odette stalled for 60 hours due to interaction with the approaching TC Seroja. ROI_3 (16.55°S, 111.55°E) is characterized by the intersection of the tracks of both cyclones.
We obtained temperature and salinity data recorded in the upper 2000 meters by several ARGO floats in proximity of the TCs tracks. Argo floats are autonomous instruments that float in the deep sea and surface every 5 to 10 days to record depth profiles of water temperature and salinity, and transmit the surface data via satellite to a data center (Argo, 2020). We obtained the data from the EuroArgo research platform (www.euro-argo.eu). We analyzed the temperature and salinity profiles of the following float IDs as they ascended and transmitted data within the 34 kts wind radii and at times prior, during and after the TCs passages: 2902783, 2902789, 2902793, 2902794, 2902795, 5902489, 5905211, 5905214, 5905403, 5905414, 5906620, 5906621. We used the R-package argoFloats to retrieve, analyze and display the data (Kelley et al., 2021). We applied the R-package oce—a toolbox for oceanographic data—to determine mixed layer depths (MLD) and ocean heat content (Kelley, 2018).
We examined drifter 1501527 from the Surface Velocity Program (SVP), which was located near the track of TC Seroja. The National Oceanic and Atmospheric Administration conducted quality control on the data and interpolated it to 1-hour intervals (Elipot et al., 2016). SST measurements were accurate to 0.05°C and similarly interpolated to 1-hour intervals. The SVP drifters consist of a telemetry unit enclosed in a spherical surface float and a “holey-sock” drogue, approximately 6 meters in length, positioned at a depth of 15 meters to minimize the direct impact of wind on the surface float.
We used six hourly forecast data for temperature and upward velocities from the Operational Mercator global ocean analysis and forecast system at 1/12 degree (European Union-Copernicus Marine Service, 2016). The upward velocity estimates derived from the numerical models in this study are subject to several sources of uncertainty. Factors such as wind and surface forcing, vertical mixing parameterizations, and limitations of altimetric products, particularly during extreme conditions associated with TCs, can affect the accuracy of these estimates. Although these numerical simulations provide valuable insights into ocean dynamics, the values should be interpreted with care due to inaccuracies. Despite these uncertainties, the observed trends and drastic shifts from downward to upward velocities support the findings from in situ observations of temperature and salinity profiles, underscoring the relevance of the modeled ocean response.
3. Results
3.1 Description of binary interactions
The track, wind speed, and atmospheric pressure of TC Seroja and TC Odette are shown in Figure 1. Details on vortical interactions between both TCs are provided by De et al. (2023). TC Seroja appeared at the southern tip of Timor Island on 4 April (12:00 UTC) and was reported as an extratropical storm off the southern coast of Western Australia on 12 April (00:00 UTC). During this period, the highest intensity was reported on 11 April (06:00 UTC), with wind speeds of 130 km/h (category 1 on the Saffir-Simpson scale according to IBTrACS database; Gahtan et al., 2024) and an atmospheric pressure of 972 mbar. As TC Seroja moved south-westward, the distance to TC Odette decreased from initially 2020 km to less than 1450 km by 6 April (18:00 UTC) and further to 855 km by 7 April (18:00 UTC) (Figure S2). The tracks indicate that TC Seroja stalled the motion of TC Odette on 6 April (03:00 UTC) at a distance of 1620 km, and all other criteria for a binary interaction were met (Jang and Chun, 2015). As a consequence, TC Odette stalled in a circular pattern (Figure 1) over an area of about 1250 km2. After 7 April (21:00 UTC), TC Odette moved north for a few hours, then turned northeast and continued turning southeast, crossing the path of TC Seroja on 9 April (18:00 UTC). With the close separation of 505 km (9 April, 18:00 UTC) TC Odette merged completely into TC Seroja (Figure S1f). TC Odette remained a tropical storm according to the IBTrACS database (Gahtan et al., 2024). With the complete merge, TC Seroja made a sudden change in its track on 10 April (06:00 UTC) (Figure 1) and strengthened into a category 1 TC by 11 April (06:00 UTC). TC Seroja made landfall (11 April, 12:00 UTC) and became an extratropical storm after passing through the southwestern region of Western Australia.
3.2 Horizontal distribution of sea-surface temperature (SST)
Based on the above-described binary interactions, three ROIs have been defined. A significant decrease in SST has been observed in ROI_1 (merging and sudden track change) and ROI_2 (stalling of TC Odette), but not at ROI_3 at which both TC tracks intersected (Figure 2). Detailed time series on SST anomalies and their distribution is shown in Figure 3. An average cooling of 1.48°C and 0.82°C was observed in ROI_1 and ROI_2, respectively. However, the cooling occurred only partially within the regions, and maximum cooling on 14 April ranged between 2.5°C and 3.0°C (Figure 2). The cooling appeared rapidly on the 9 April (ROI_2) and 10 April (ROI_1) indicated by a flattening of SST distributions and deviations from observations made on 28 March (Figure 3). In ROI_3 a small shift in the SST distribution toward cooler temperatures has been detected (Figure 3), but not resolved in the remotely sensed SST (Figure 2). Cooling in the regions occurred at a rate of –0.23°C (ROI_1) and –0.12°C (ROI_2) per day, i.e., twice as fast during the complete merging of both TCs (ROI_1) compared to the stalling of the smaller TC Odette (ROI_2).
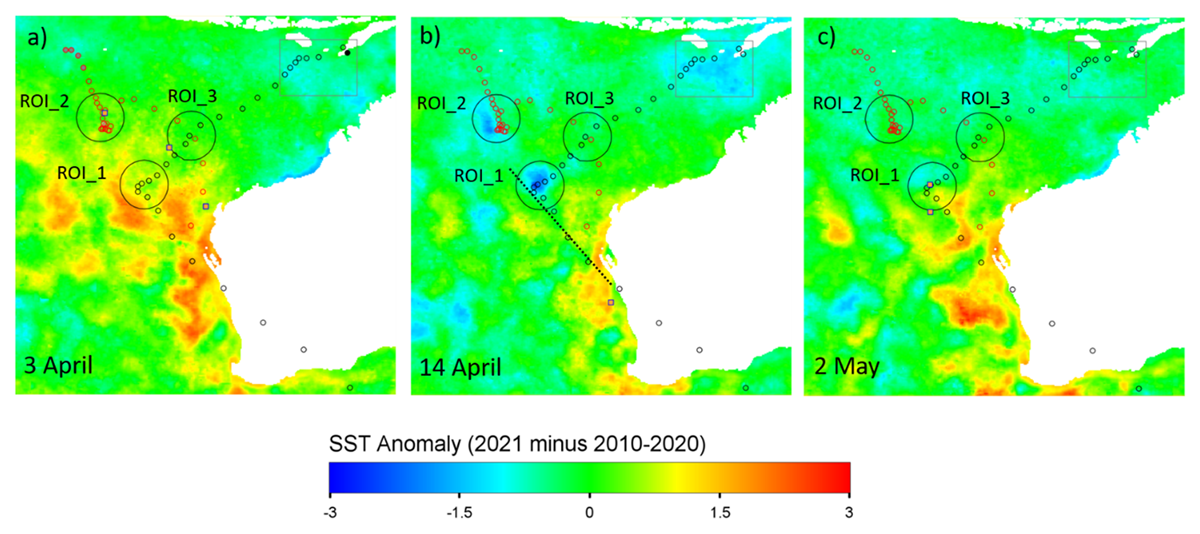
Figure 2
Sea-surface temperature (SST) anomalies in three regions of interest (ROI) for a) 3 April, b) 14 April and c) 2 May 2021. Tracks of TC Seroja (black) and Odette (red) are shown (open circle) with current position (filled circles). Dotted line in b) shows the northeast extension of the track after absorption of TC Odette into TC Seroja and sudden change in direction. The rectangle in the upper left corner shows the area of origin of TC Seroja with clear SST cooling described by Avrionesti et al. (2021).
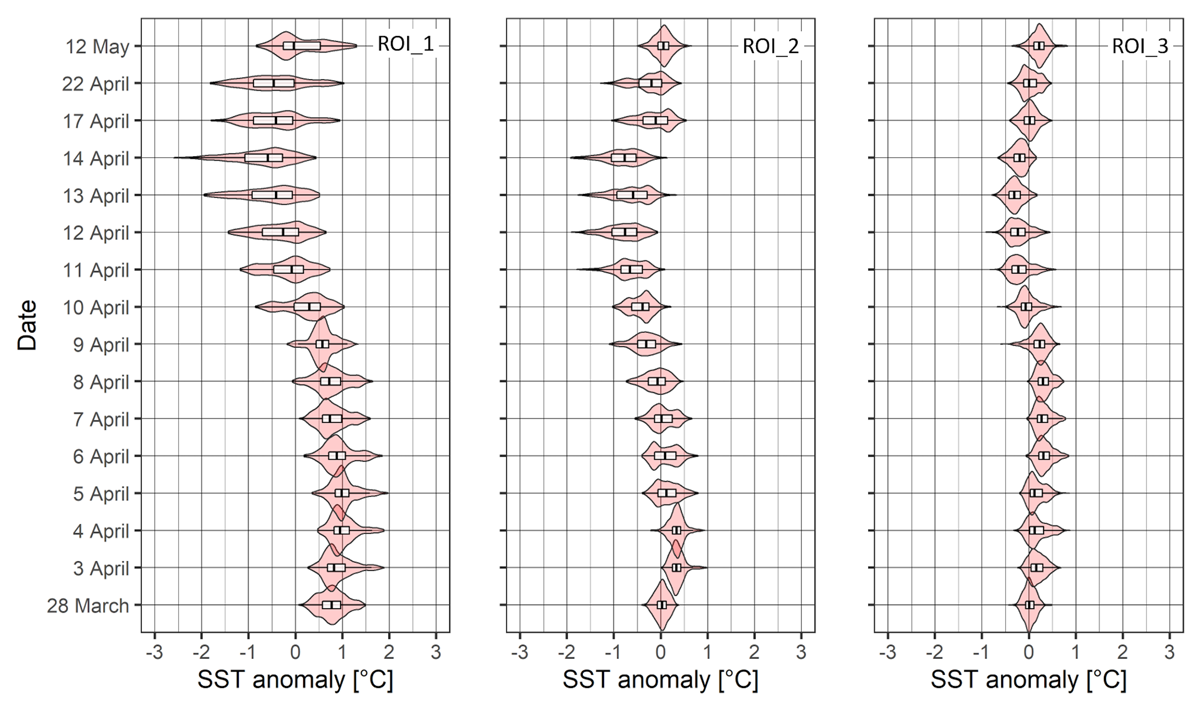
Figure 3
Distribution and box-whisker plots of the SST distribution in the regions of interests.
Between 17 April and 12 May, the SST in ROI_1 remained 0.66°C cooler than before the TC passage (Movie S1), but in ROI_2 it relaxed close to its initial stage (Movie S2). However, the animated SST (Movie S1) shows that other hydrodynamic processes probably led to further cooler water masses in ROI_1 after 17 April, which are unlikely associated with the overpass of TC Seroja.
3.3 Vertical temperature and salinity profiles
To complement the horizontal distribution of SST anomalies, vertical depth profiles of temperature and salinity from the selected ARGO floats are assessed. In ROI_1, ARGO float 5902489 and 5905414 provided temperature profiles on the right and left sides of the TC Seroja track, respectively (Figure 4). Argo 5902489 detected a surface cooling of 2.4°C when the float ascended 36 km on the right of the track on 12 April, i.e., three days after the merger of TC Seroja and TC Odette. The location of the ascend (red square in Figure 4) was within the range of maximum wind speed of approximately 110 km h–1. With the surface cooling, the temperature gradient across the MLD became less pronounced, and the MLD (based on 0.2°C criterion; Boyer Montégut et al., 2004) raised from 42.5 m (2 April) to 29 m (12 April), indicating upwelling processes. The upwelling is evident to a depth of 200 m (Figure S4). Probably due to the weakening of the upwelling after 12 April, the local surface warmed up from 25.2°C (12 April) to 26.8°C (2 May) at a general rate of 0.08°C per day, i.e., three times slower than the rate derived by the remotely sensed SST over ROI_1. On 2 May, SST was 0.8°C cooler than it was prior to the passage of TC Seroja.
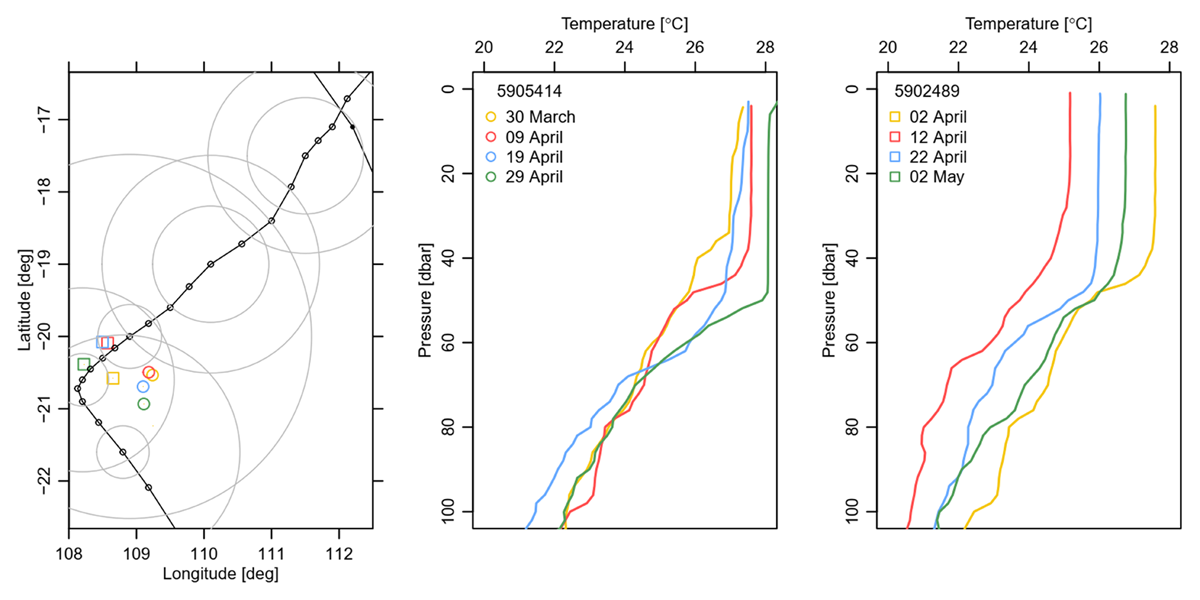
Figure 4
Temperature depth profiles of float 5905414 and 5902489 in the ROI_1. Smaller circles in the map represent radii of maximum wind speed. Larger circles represent radii of a wind speed of 63 km h–1.
In contrast, no surface cooling was observed by ARGO 5905414 (Figure 4) when it ascended to the surface at 06:11 UTC on 9 April, i.e., seven hours before TC Seroja began to absorb TC Odette. With the merger, TC Seroja intensified into a category 1 TC, but the temperature profile recorded by float 5905414 a few hours earlier shows neither a cooling nor a change in stratification. This means that either a very rapid change has occurred or that the lateral transport of water masses on the two sides of the track is fundamentally different.
Within the observational time, no ARGO floats ascended in the region where TC Odette was stalled by the binary interaction with TC Seroja (Figure 1). Three floats ascended 2–3 days after TC Odette continued its path, and a slight cooling of the surface by less than 0.8°C was observed (Figure S4). Whether the cooling was natural variability or TC-induced could not be clarified, but a strong cooling of about 2°C was observed by remote sensing only on the western side of the TC Odette’s track and ARGO float positions (Figure 2). In the region at which both TCs intersect within 33 hours (ROI_3), several ARGO floats emerged at the surface to provide temperature profiles of the water column (Figure S6), but the majority outside the 63 km h–1 wind regime, and the remaining outside the maximum wind regime. Probably due to their location within a lower wind regime or an opposite effect of cyclones on lateral transport of water masses, no clear TC-induced cooling or change in MLD is evident.
3.4 Upward ocean velocity
To investigate the intense cooling described in the earlier section, modeled upward velocities are shown in Figure 5. Modeled upward velocities are shown for the positions of ARGO floats 5905414 (9 April 2021) and 5902489 (12 April 2021), and for the position of TC Seroja on 10 April 2021, with its sudden change of direction. The vertical velocity is changed by the passage of TC Seroja down to several hundred meters in depth. At all three positions, a significant change in upward velocity within a few hours is observed. For example, a change from downward (4.3 m d–1) to upward velocity (17.3 m d–1) was observed on the left side of the track during the passage of TC Seroja at the position of ARGO 5905414 (Figure 5a), which return to a downward velocity of 8.6 m d–1 after 30 hours of the passage.
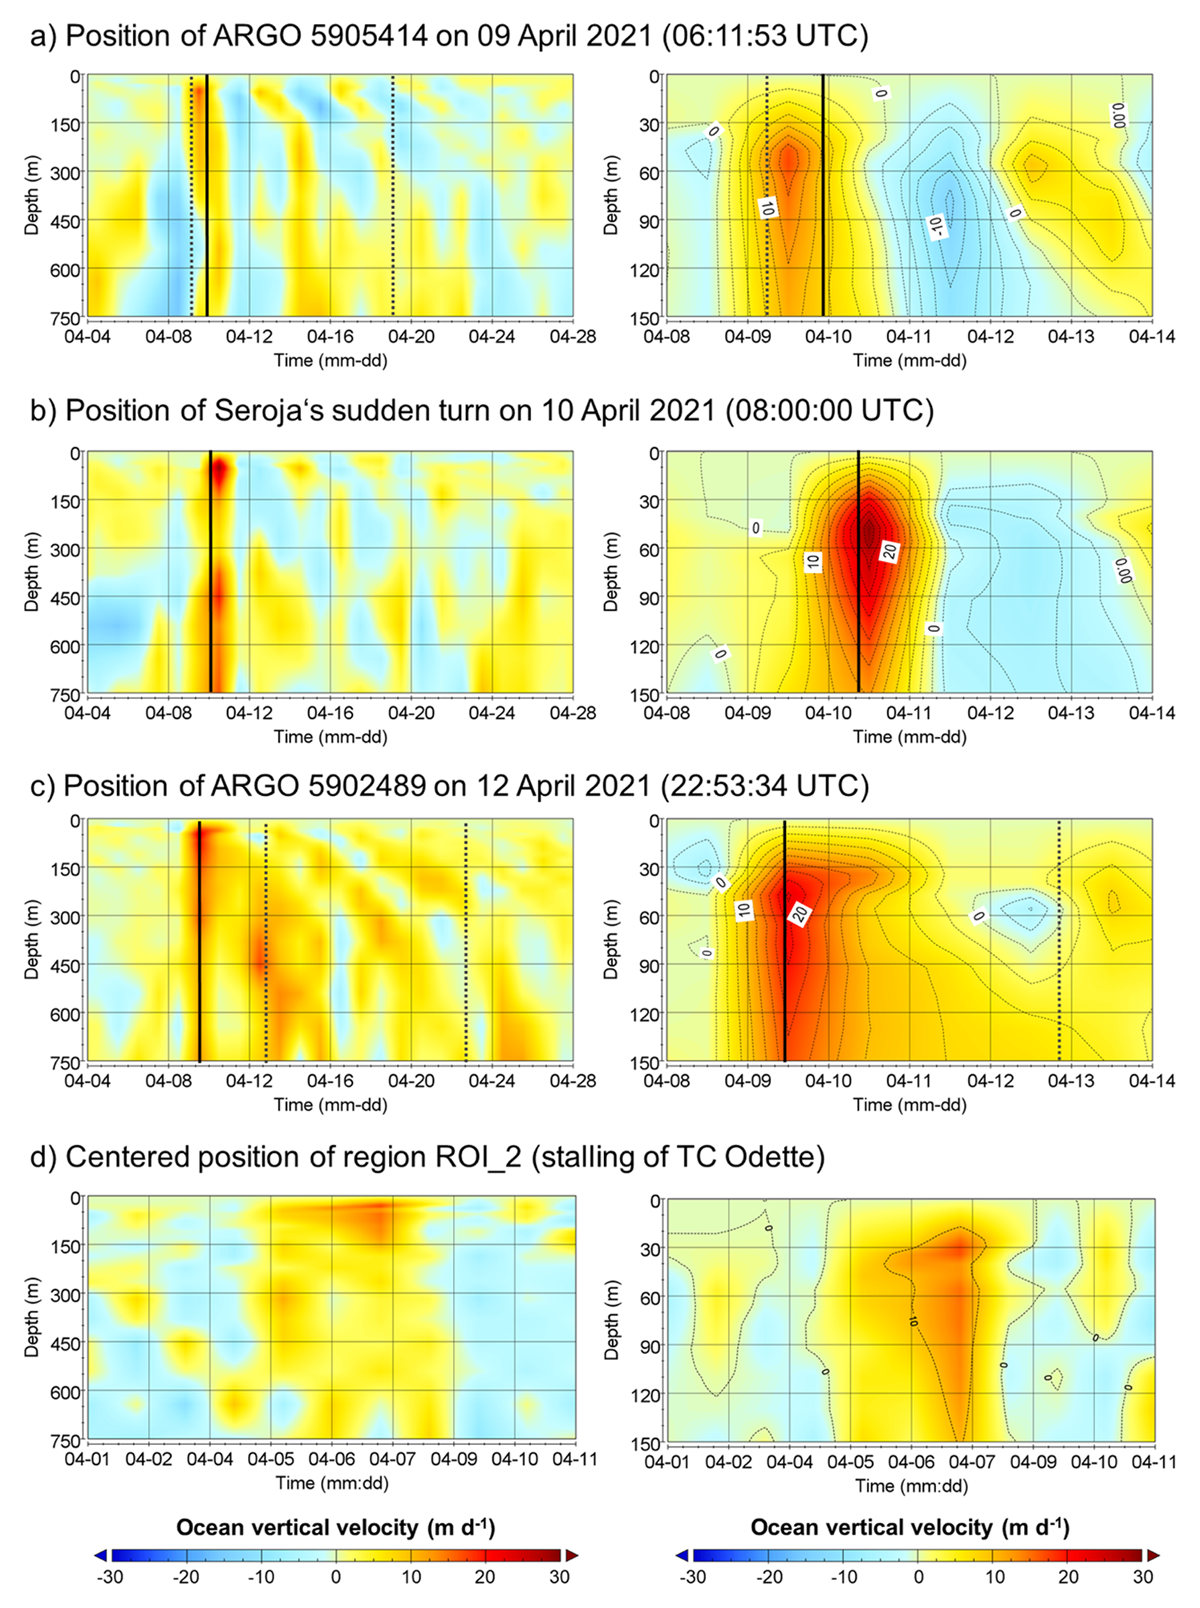
Figure 5
Upward velocity (European Union-Copernicus Marine Service, 2016) at the positions a) –20.500 N, 109.167 E near the ascend of ARGO float 5905414 on the 09 April 2021, b) –20.833 N, 108.000 near position of TC Seroja on 10 April at 05:00 UTC with the sudden turn, c) –20.083 N, 108.583 E near the ascend of ARGO float 5902489 on the 12 April 2021 and d) –16.500 N, 105.830 E in center of region ROI_2. The right images show a spatial (top 150 meters) and temporal (8 April to 14 April 2021 for a–c) zoomed-in area of the left image. Positions are in close proximity to the ascends of the ARGO floats due to the resolution of the model. Dotted lines represent the ascend of the ARGO floats on the given dates and UTC times, and dashed lines represent the passage of TC Seroja.
The most drastic change in vertical velocity occurred in the region where TC Seroja suddenly changed direction after merging with TC Odette (Figure 5c and d). At depths between 30 m and 70 m, an upward velocity induced by TC Seroja of 30 m d–1 changed within 12 hours to a downward velocity of 4.3 m d–1. The hourly rate of change is nearly linear with 2.6 m d–1. A regular pattern of recurring changes in upward and downward velocities (both in the range of 0 to 8.6 m d–1) within 3 to 4 days after the passage of TC Seroja is evident at the positions of ARGO 5905414 (Figure 5a) and the sudden change in direction of TC Seroja (Figure 5c).
In contrast, no such pattern exists at the position of ARGO 5902489 rising on the right side of the track of TC Seroja on 12 April 2021 (Figure 5e, left). The upward velocity of 22.5 m d–1 (Figure 5d) exceeds the maximum velocity of 17.3 m d–1 on the left side of the track at the position of ARGO 5905414 (Figure 5b). Overall, the induced upward velocity on the right side of the track persisted for the subsequent two weeks, differing substantially from the other two positions examined (Figure 4a and c). Similarly, data indicates a clear increase in upward velocity at the centered position of ROI_2 (–16.5°N and 105.83°E) during stalled TC Odette in this region (Figure 5d). After the passage of TC Seroja, TC Odette continued to move and the upward velocity dropped rapidly back to the initial range of 0 to 5 m d–1.
3.5 Drifter data analysis
The tracking data show that on 10 April 2021 (00:00 UTC), the drifter was 114.8 km from TC Seroja and thus within the radius of the storm. During this time, there was a notable shift in drift direction from northwestern to northeastern direction (Figure 6a, b). This change coincided with a substantial increase in the drifter velocity, which rose from about 0.2 m s–1 to about 0.8 m s–1 while observed wind speeds reached values higher than 100 km h–1. After this increase, there was a rapid decrease to about 0.05 m s–1 (Figure 6c). The fluctuations in drifter velocity were observed from 9 April (18:00 UTC) to 11 April (00:00 UTC) and peaked around 10 April (11:00 UTC), when TC Seroja and the drifter made a sudden change in direction as the two TCs merged (Figure 6c).
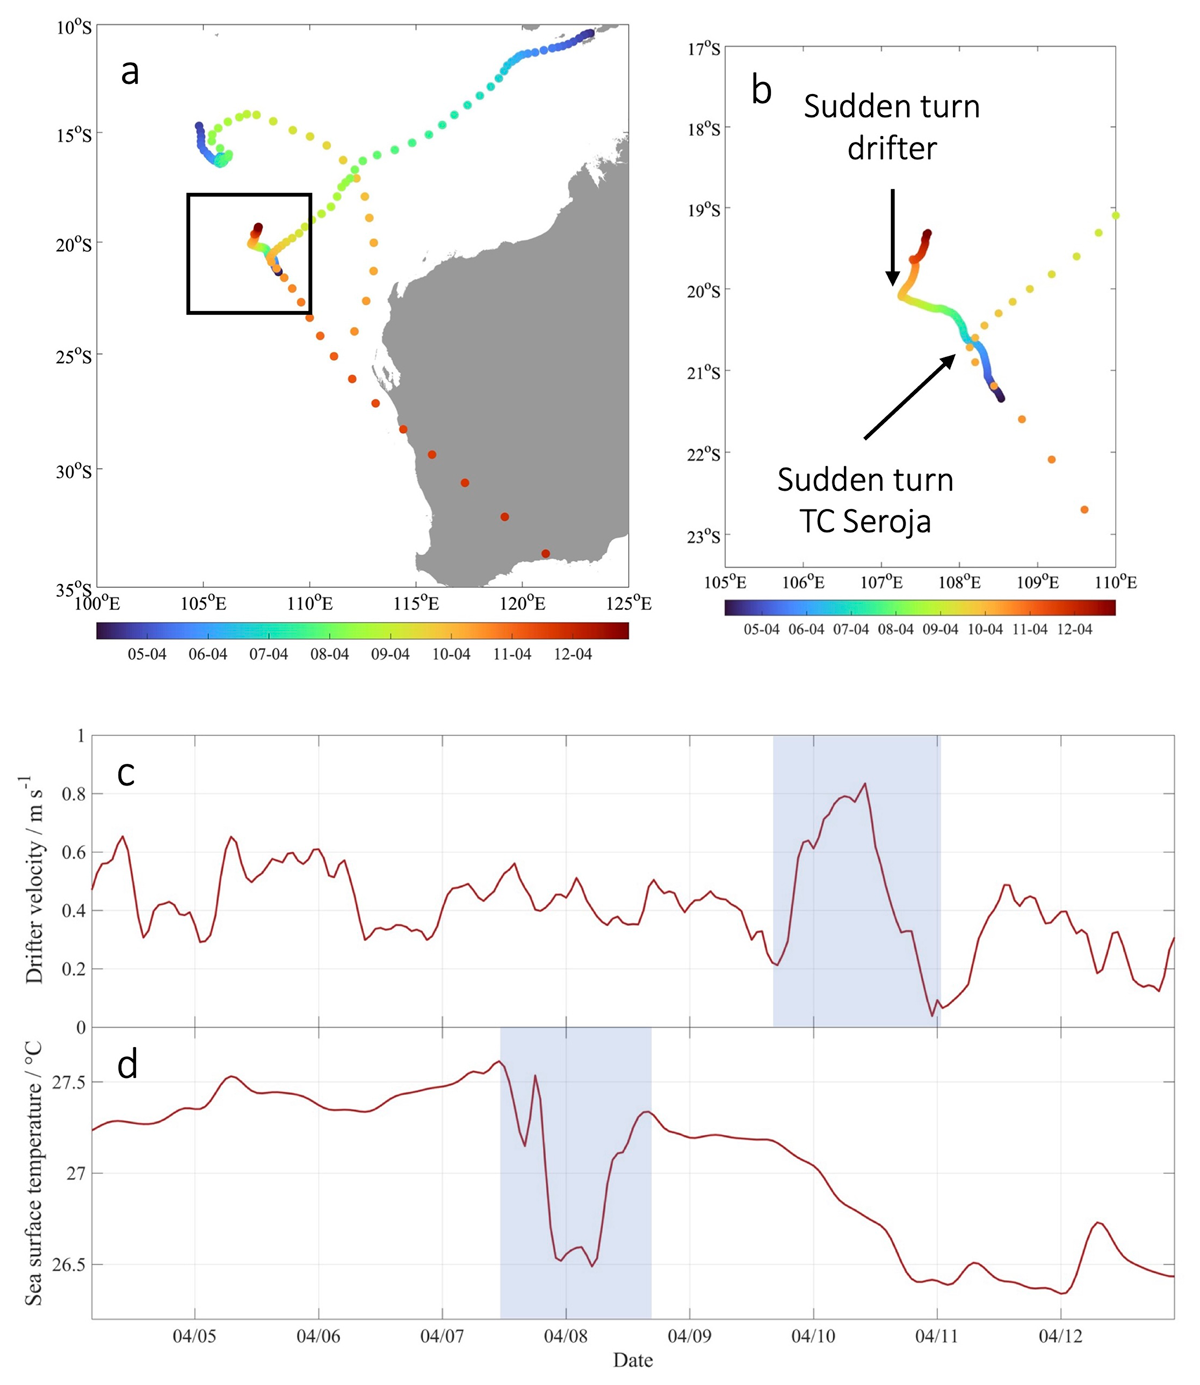
Figure 6
Drifter data of SVP drifter 1501527 near the track of TC Seroja. a) Tracks of TC Seroja and TC Odette and the trajectory of SVP drifter 1501527. b) Zoomed area marked by the black box in a). The color scale shows the date of the tracks and trajectories. c) Time series of the drifter velocity derived from the position data of the drifter, blue shading indicates the sudden change in velocity. d) Time series of the SST observed by the drifter along its trajectory, blue shading indicates the observed cooling.
On 7 April, between 19:00 UTC and 23:00 UTC, the drifter experienced an abrupt cooling of approximately 1°C, likely due to its movement through a region with a strong horizontal SST gradient, where surface temperatures changed rapidly over a short distance (Figure 6d). During this cooling phase, the drifter traveled approximately 30 km in ROI_1, indicating that it crossed a thermal front or boundary in the ocean, possibly influenced by mixing from TC Seroja or upwelling processes. Following this initial cooling, the SST gradually increased, returning to pre-event levels by 8 April (16:00 UTC), suggesting that the drifter moved out of the cooler region or the vertical mixing subsided. However, after this brief restoration, the drifter continued to experience a continuous cooling of approximately 1°C as it moved northeastward, parallel to the track of TC Seroja (Figure 6d), indicating that it was still moving through a region with cooler waters and persistent horizontal temperature gradients. This sequence of events highlights the dynamic interactions between the cyclones, ocean currents, and the distribution of sea surface temperatures in the region.
4. Discussion
A common feature of TCs is the cooling of the ocean surface in their wake. This occurs because the TC’s rotation enhances the atmospheric inertial oscillation, leading to strong divergence in the upper ocean layer. Consequently, this process causes cooler water from below to rise to the surface. The cooling typically occurs on the right (left) side of the TC track in the northern (southern) hemisphere (Zhang et al., 2021). The extent of sea-surface cooling depends on the intensity and translational speed of the TC (Zhang et al., 2021), upper ocean stratification (Chiang et al., 2011), and pre-existing energetic conditions of the upper ocean driven by cool or warm currents (Uhlhorn and Shay, 2012). Responses of the upper ocean upon binary interaction of TCs have been reported for successive occurring TCs (Baranowski et al., 2014; Li et al., 2020; Ning et al., 2019; Wang et al., 2022; Zhang et al., 2019), but the interaction between TC Seroja and TC Odette was more complex, involving a stalling and subsequent complete merging of both TC, i.e., a two-fold binary interaction within 72 hours. The cooling by TC Odette and TC Seroja of up to 3.0°C (Figure 2 and 3) is within a typical range of 1°C to 6°C for cyclones that do not encounter binary interactions (Zhang et al., 2021).
4.1 Cooling by complete merging
Lloyd and Vecchi (2011) reported that SST cooling increases with storm intensity to a peak value of 1.8°C up to category 2, while cooling from category 3 to 5 cyclones does not increase further. For comparison, D’Asaro et al. (2007) reported that the category 4 hurricane Frances caused a surface cooling by 2.2°C. TC Seroja and TC Odette were categorized as tropical storms before merging (see wind speed and atmospheric pressure in Figure 1). Only on 11 April 2021 (06:00 UTC) TC Seroja reached its maximum wind speed of 130 km h–1, i.e., category 1 on the Saffir-Simpson scale. This means that the cooling of up to 3.0°C caused by TC Odette and TC Seroja were exceptionally high in relation to their storm intensities. In the southern hemisphere, cooling occurs on the left side of the TC track (Zhang et al., 2021). According to the position of ARGO 5902489 and the drifter, the cooling appeared to have occurred on the right side of the track (Figure 2b), but the upwelling (Figure 5b) and cooling process was initiated with the merging and the sudden change of direction. This means that the cooling indeed occurred on the left side directly after the intensification and sudden change of direction of TC Seroja (see dashed line in Figure 2b).
The intensification of the TC Seroja was not caused by the presence of warm surface water as a source of latent heat, but by the merging alone. The heat content of the ocean—based on the 26°C isotherm—along the track of TC Seroja was 21.3 kJ cm–2 on 2 April 2021 at the position of ARGO 5902489 (yellow box in Figure 2) and was thus well below a heat content of 60 to 90 kJ cm–2, which has been suggested as typical values required for the intensification of storms (Park et al., 2012). As both cyclones had the same direction of rotation and were relatively close together (separated by 505 km; Figure S1), the merging of TC Odette with TC Seroja accelerated the cyclonic rotation, i.e., intensification of TC Seroja despite the low heat content of the water column. A similar process with an acceleration of rotational speed has been described for the merging of the cyclones Alex and Zeb, separating by a distance of 850 km (Kuo et al., 2000).
4.2 Cooling by a quasi-stationary TC Odette
Lu and Huang (2010) presented an idealized analytical solution for the steady upwelling of a “perfect” stationary TC in a completely homogenous ocean. They pointed out that an ideal stationary cyclone theoretically generates a large vortex that spans the entire water column, comparable to the cyclonic wind force in the atmosphere. As the authors outline both conditions—a perfect stationary cyclone and a completely homogeneous ocean—are not fulfilled in reality, but their study supports explaining real observations, i.e., of quasi-stationary cyclones as in our study. TC Odette moved within region ROI_2 with a translational speed of about 3.5 km h–1 from April 6 (06:00 UTC) to April 8 (02:00 UTC), but repeatedly with its eye over a circular area of 4417 km2 (diameter 75 km). A translational speed of 3.5 km h–1 is low compared to global values between 15–20 km h–1 (Yamaguchi et al., 2020). That means the 60-hour hold-up of TC Odette by the approaching TC Seroja was sufficiently long to trigger a strong divergence and upwelling over the relatively small area as inertial period is approximately 45 hours at TC Odette’s location. For this case, there were no favorable ascends of ARGO floats (Figure S4) in terms of time and location. However, the modeled upward velocity (Figure 5d) and temperature data (Figure S6) support the strong cooling observed by the remote sensing data despite the low storm intensity during the stalling. In their study, Lu and Huang (2010) explored the potential behavior of a hypothetical stationary TC. The situation with TC Odette can be considered nearly stationary due to its interaction with TC Seroja. According to Lu and Huang (2010), when a TC remains in one location, it can induce stronger upward movement of cooler water from deeper Ekman layers. This process, triggered by wind stress, can result in a more significant reduction of sea surface temperatures. This means that the quasi-stationary position over the region could possibly have caused a continuous upwelling of cold water from a rather deep layer within the Ekman spiral, leading to a strong cooling of 3°C despite low storm intensity. Temperature profiles (Figure S4, data between 1 April and 3 April) indicate a weak stratification, which is in favor of maintaining storm intensity (Lloyd and Vecchi, 2011) and explains the continuing path of TC Odette and subsequent merging with TC Seroja.
4.3 Non-induced cooling in the region of cyclones intersect
We did not observe any cooling in the ROI_3 region, in which the paths of both TCs crossed. It could be associated with the interaction between the TCs and the upper ocean (any cooling shown in Figure S5 occurred at other times due to other hydrodynamic processes). In addition, satellite-derived SST and its distribution within ROI_3 changed the least compared to the ROI_1 and ROI_2 regions (Figure 3), which is likely due to natural variability rather than cyclone-induced cooling. The reason for the lack of cooling is the Ekman pumping in opposite directions and the divergence of the surface water between TC Seroja moving from north to south and TC Odette moving from west to east. Any cooling by TC Seroja on its left side of the track due to divergence was probably canceled out by the convergence in the wake of TC Odette on its right side.
4.4 Upward and downward ocean velocity
Upward velocities in high-energy oceanic systems are in a range of 10–100 m d–1 (Rodríguez et al., 2001) while globally representative values are in the range of 1–5 m d–1 (Liang et al., 2017). We observed the highest upward velocity with 30 m d–1 while both TCs merged at the position at which TC Seroja turned (Figure 5b) and observed a sharp increase in the velocity accompanied by a sudden change in direction of the SVB drifter 1501527 (Figure 6c and d). During this period, from 9 April (1200 UTC) to 10 April (1200 UTC), the vertical velocity changed from approximately 0 m d–1 to 30 m d–1 (Figure 5b, right panel) and the observations of the drifter indicate an ongoing cooling of the surface in ROI_1 (Figure 6d) associated with the upwelling of cold deep water masses in the wake of TC Seroja. At this location, a drastic change of upward vertical velocity was observed down to 750 meters below the surface. Gierach et al. (2009) reported vertical velocities during the passage of TC Katrina (23–30 August 2005) of up to 50 m d–1 (i.e., 6 * 10–4 m s–1 shown in Figure 11 in Gierach et al. (2009)) affecting at least the upper 500 meter of the water column. TC Katrina was a category 5 TC with wind speeds of 280 km h–1, i.e., more than twofold the maximum wind speed of TC Seroja. Black and Dickey (2008) reported vertical velocities of 8.6 m day–1 (i.e., 1 * 10–4 m s–1) during the passage of Hurricane Fabian (category 3 TC) in 2003 over the Bermuda Testbed Mooring. According to this, the generated upward velocities of TC Seroja are disproportionately large, which is discussed above in relation to cooling.
Since TC Odette and TC Seroja rotated in the same direction and were close to each other, with a distance of several hundred kilometers (Figure S1), the binary interaction led to complete merging (Prieto et al., 2003). Another important criterion for complete merging was that TC Seroja was significantly larger and stronger than TC Odette; the interaction between two equally strong TCs is less complex and typically involves an elastic interaction without merging (Prieto et al., 2003). Whether two TCs move closer or farther apart is a complex fluid dynamic process and, for example, the vertical wind profiles of both vortexes play an important role (DeMaria and Chan, 1984). However, the merger of the weaker TC Odette with the stronger TC Seroja led to an additive effect on the strength of TC Seroja, as evidenced by the fact that it reached its maximum speed of 130 km h–1 soon after the merger. Due to the different masses of TC Seroja and TC Odette, TC Seroja changed its rotation to a new mean center after the merger (Wei-Jen Chang, 1983), which probably led to the sudden change in direction. This additive effect and the change in the center of rotation occurred suddenly and led to significant cooling (Figure 2) and a drastic change in upward velocity (Figure 5).
Our observations based on model-simulated data show rapid transitions of maxima in down- and upwelling velocities (i.e., from –10 to 10 m d–1). This can be clearly seen in the position of ARGO’s 5905414 ascent (Figure 5a) and the sudden change in direction of TC Seroja (Figure 5b). This period of strong down- and up-welling velocities lasted 10 days. Interestingly, such an oscillation was described in a nonlinear model to study the response from the ocean to a storm (Greatbatch, 1983). He attributed such a feature to the advection along the storm’s track, whereas the maximum response to be expected is driven by the cross-track advection. For a storm in the southern hemisphere, such a maximum response should occur on the left side of the track, as shown by the clearest oscillation at the position of ARGO 5905414 and the float’s position to the left of the track of TC Seroja after the merger (Figure 3). Greatbatch (1983) pointed out that the feature of oscillating down- and up-welling depends on the storm’s translational speed, and was visible but less pronounced at higher speeds (10 m s–1 versus 2.5 m s–1). After the merger, the TC Seroja increased in translational speed from 1.5 m s–1 (10 April, 00:00 UTC) to 10 m s–1 (11 April, 00:00 UTC) with a mean speed of 5 m s–1 (Gahtan et al., 2024). Based on the numerical data, the pattern of upward and downward velocities became less distinct with the increase of TC Seroja’s translational speed.
4.5 Global relevance
Global warming has increased the frequency and intensity of TCs (Elsner et al., 2008; Mei et al., 2015). Consequently, formation of two or multiple TCs within a short time in a region is likely to increase under favorable conditions of a warmer ocean, and consequently the frequency of binary interaction. This would not only mean that trajectory prediction becomes even more difficult—as the sudden change of TC Seroja after merging with TC Odette has shown—but also drastic changes in the upper ocean dynamics with more energetic states caused by upwelling processes. Our study shows that the binary interaction between two weaker TCs causes relatively strong impacts on the ocean compared with single TCs of higher intensity. As TC Seroja and TC Odette were relatively weak storms, binary interactions between stronger TCs—under the assumption made likely to occur in the future (Elsner et al., 2008)—are likely to trigger one of the most extreme interactions between the ocean and atmosphere. The International Panel on Climate Change (IPCC 2023) assumes with moderate certainty that TCs will intensify in the future. In addition, the frequency of intense TCs increases due to global warming (Mendelsohn et al., 2012). Both the intensity, i.e., size of TC, and frequency will increase the probability of concurrent occurrence in closer proximity, and therefore, the probability of binary interaction. Not only the upwelling processes, but also the air-sea interaction will shift to more extreme cases, with greater energy exchange, rainfall and gas exchange. However, the prediction of the future frequency of TC occurrence includes some uncertainty as indicated by the moderate certainty suggested by the IPCC. How the binary interaction of TCs will affect the ocean and climate in the future requires both a better understanding of the future occurrence of TCs and an understanding of the complexity of the binary interaction with responses to the upper ocean. Observational strategies are important but difficult to implement due to the sudden appearance of binary interactions. However, remote sensing and the ARGO program play a central role as our study shows.
5. Conclusions
In this study, we have analyzed the thermodynamic response of the upper ocean to a rare event of two binary interactions between two TCs. This large-scale and massive weather phenomenon and the response to the upper hundreds of meters of the ocean could be investigated by combining satellite data with ARGO floats ascending along the TC’s tracks and numerical models.
As usual with TCs, the weak TCs Seroja and Odette (category 1 on the Saffir-Simpson scale) caused diverging currents along the tracks and upwelling of cold deep water. We observed cooling of the upper ocean only at times of binary interactions. However, we concluded that the cooling was at 3°C intense and of a magnitude only expected after passages of stronger TCs. The cooling persisted for at least 8 days. The binary interaction in the form of the stalling of the smaller TC Odette by TC Seroja and the subsequent merging set extraordinary physical transport processes in motion. In both cases, there was a transition from a typical downward velocity of the ocean (<10 m d–1) to a rapid upward velocity of the ocean (up to 30 m d–1). The most drastic changes occurred immediately after the merging of the two TCs. We conclude that the amplification of the cyclonic rotational force and sudden 90° turn of TC Seroja caused this rather abrupt reversal of the vertical ocean velocity, which was observed down to a depth of at least 750 m. Thereafter, this physical setting relaxed at an hourly rate of 2.6 m d–1, but during this post-phase an oscillation between downward and upward velocities was observed.
We conclude that the binary interactions, in particular the complete merging, cause extraordinary transport of deeper water masses to the ocean surface. The described cooling processes were caused by the merging of weak TCs. Therefore, it can be assumed that when stronger TCs (e.g., category 3 or higher) merge, the resulting physical mixing processes in the ocean would be of the highest possible order. This is, indeed, a realistic scenario as, according to the IPCC, the intensity and occurrence of hurricanes will increase with medium probability and thus also the probability of the simultaneous occurrence of strong hurricanes in the immediate vicinity.
Data Accessibility Statement
We used the following data and software freely available as indicated below.
The International Best Track Archive for Climate Stewardship data used for describing tracks and wind fields of both TCs in the study are available at http://ibtracs.unca.edu/index.php (accessed 17.12.2023; Knapp et al., 2010, Gahtan et al., 2024).
The TIR data used for investigating and visualizing binary interaction (Figure S1) in the study are available at JAXA Himawari Monitor (Japan Aerospace Exploration Agency via https://www.eorc.jaxa.jp/ptree/index.html (accessed 17.12.2023).
The Regional Australian Multi-Sensor SST Analysis (RAMSSA) data used for analysis of SST in the study are available at the Australian Bureau of Meteorology via https://podaac.jpl.nasa.gov/dataset/ABOM-L4HRfnd-AUS-RAMSSA_09km and 10.5067/GHRAM-4FA01 (ABOM, 2008).
The Argo data used for temperature and salinity depth profiles (Figure 3, S4, S5 and S6) in the study are available at Argo Global Data Assembly Centre via 10.17882/42182 (Argo, 2020).
The “Global Ocean 1/12° Physics Analysis and Forecast updated Daily” used for numerical outputs for figures 4, 5 and S7 in the study are available at Mercator Ocean International via 10.48670/MOI-00016 (European Union-Copernicus Marine Service, 2016).
Trajectory and SST data from drifter 1501527 of the Surface Velocity Program is used for complementary data during the merge of TCs. Data are available via https://gdp.ucsd.edu/ldl/data/ and described by (Elipot et al., 2016).
Versions 4.2.0 and 2023.06.1 +524 of the R language and RStudio respectively is used for analysis and display of data shown in Figure 1, 3, S2, S4, S5 and S6. R language and RStudio is available at https://www.R-project.org/ (R Core Team, 2021) and http://www.posit.co/ (Posit team, 2023) respectively.
Version 1.0.6 of the R library argoFloats is used for retrieval, analysis and display of temperature and salinity data from relevant Argo floats. Library is preserved at 10.3389/fmars.2021.635922 (Kelley et al., 2021) and available via https://cran.r-project.org/web/packages/argoFloats/index.html (GPL-3 license, accessed 17.12.2023).
Version 1.8–1 of the R library oce is used for computing the mixed layer depth and ocean heat content from Argo profiles. Library is preserved at 10.1007/978-1-4939–8844-0_3 (Kelley, 2018) and available via https://cran.r-project.org/web/packages/oce/index.html (GPL-3 license, accessed 17.12.2023).
Version 5.2.9 of the software Panoply is used for Figures 4, 5 and S7. Software is available via www.giss.nasa.gov/tools/panoply (accessed 17.12.2023).
Version 8.4.1 of the software SeaDAS is used for Figure 2 and S3, and the supplementary movies 1 and 2. Software is available via https://seadas.gsfc.nasa.gov/ (GNU General Public License Version 3, accessed 17.12.2023).
Version 1.7.1 of the Matlab package jlab (Lilly and Elipot, 2021) used for spectral analysis and Figure S8. Package is preserved at 10.5281/zenodo.4547006, available via http://jmlilly.net/code.html (accessed 17.12.2023).
Additional File
The additional file for this article can be found as follows:
Supplementary Information
The supplementary material includes a comparison of wind speeds reported by the WMO (USA agency) and the European Centre for Medium-Range Weather Forecasts (ECMWF), and the thermal infrared images for monitoring the binary interactions. In addition to the description in the text, the supplementary material includes temperature depth profiles extended to a depth of 400 m to show the extent of vertical mixing after the merging of both TC. The supplementary material also shows the temperature depth profiles for ROI 2 and 3, as well as the temperature data at the centered position of ROI_2 from a numerical model. In addition, the two movies show the horizontal temperature distribution in ROI 1 and 2 from April 3 to May 8, 2021. DOI: https://doi.org/10.16993/tellusa.4083.s1
Acknowledgements
We thank our colleagues Mariana Ribas Ribas and Thomas Badewien for discussions on mixed layer depth and upwelling processes.
Competing Interests
The authors have no competing interests to declare.
Author contributions
Conceptualization: O.W.; Methodology: O.W. and J.M.; Analysis and Interpretation: O.W. and J.M.; Writing—original draft preparation: O.W.; Writing—final manuscript: O.W. and J.M.