
Figure 1
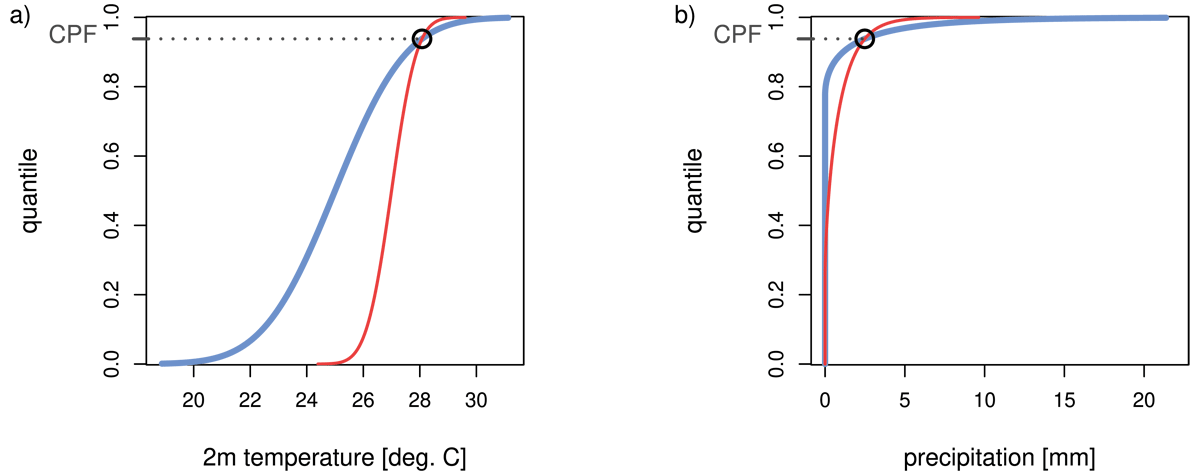
Synthetic examples of CPF in the case of (a) temperature-like distributions and (b) precipitation-like distributions with F in red and G in blue.
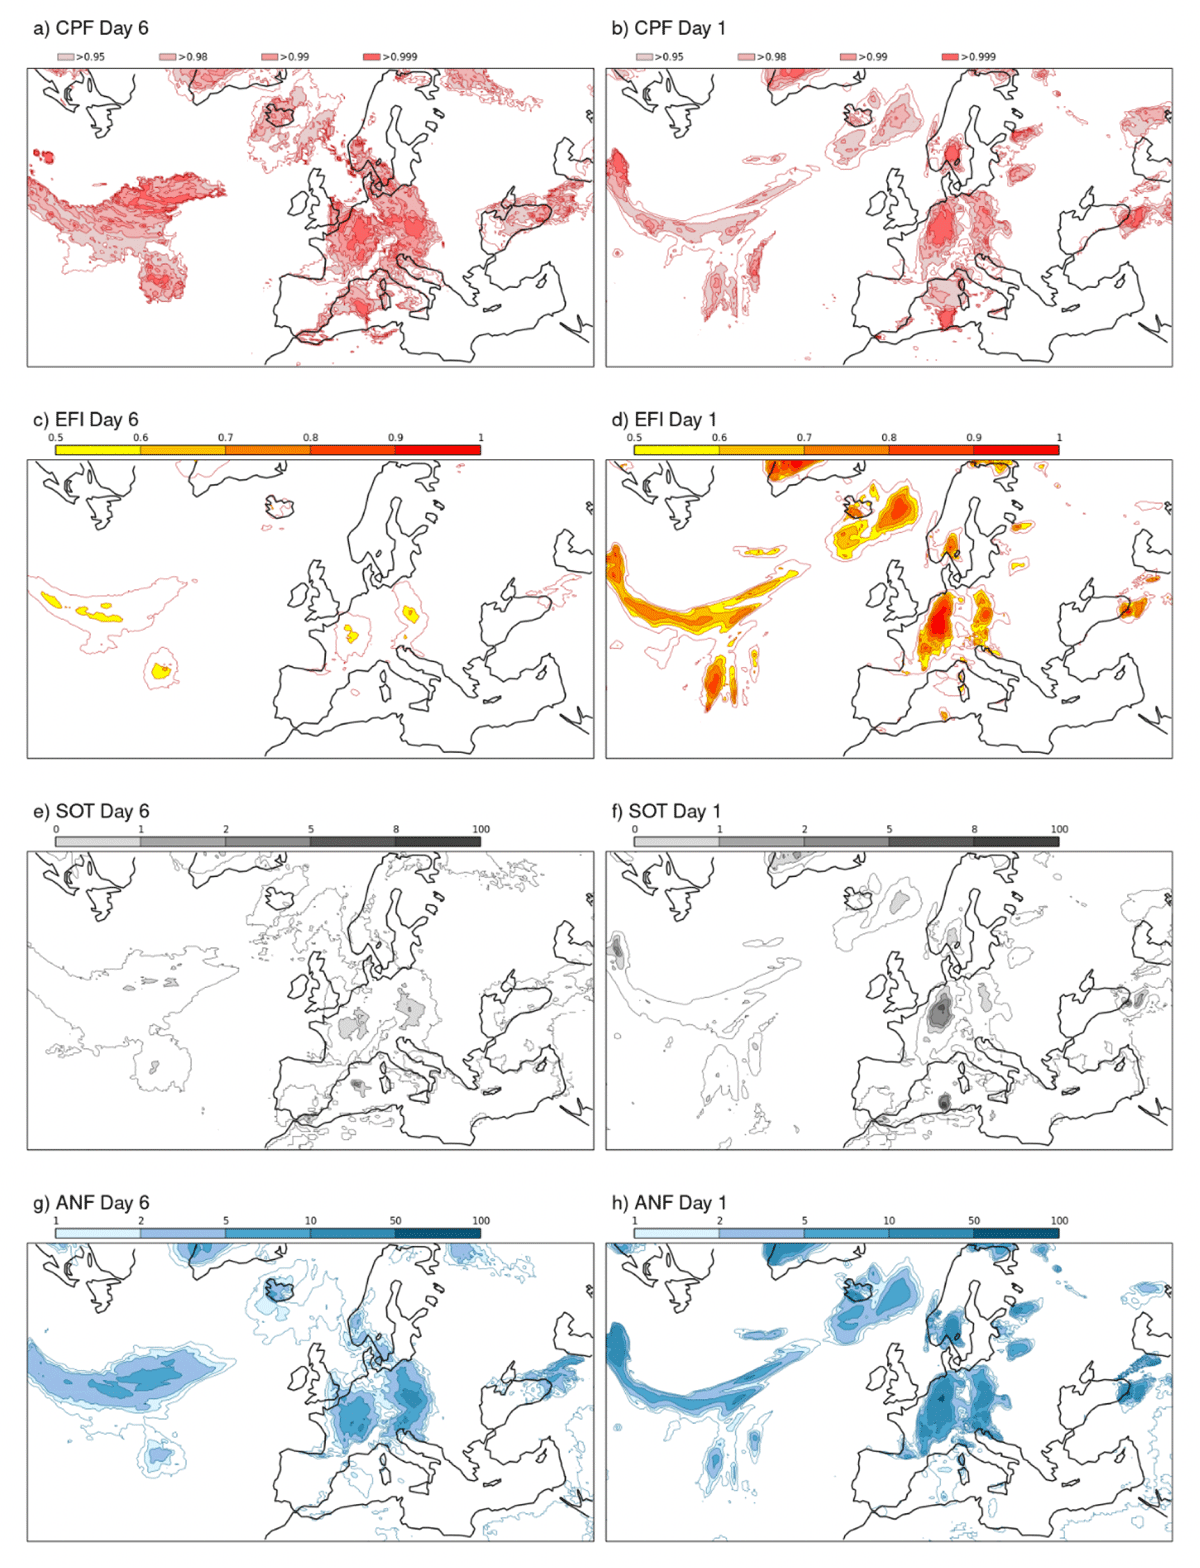
Figure 2
Daily precipitation forecasts valid on July 14, 2021: (a, b) CPF, (c, d) EFI, (e, f) SOT, and (g, h) ANF generated 6 days ahead of the event (left) and 1 day ahead of the event (right).
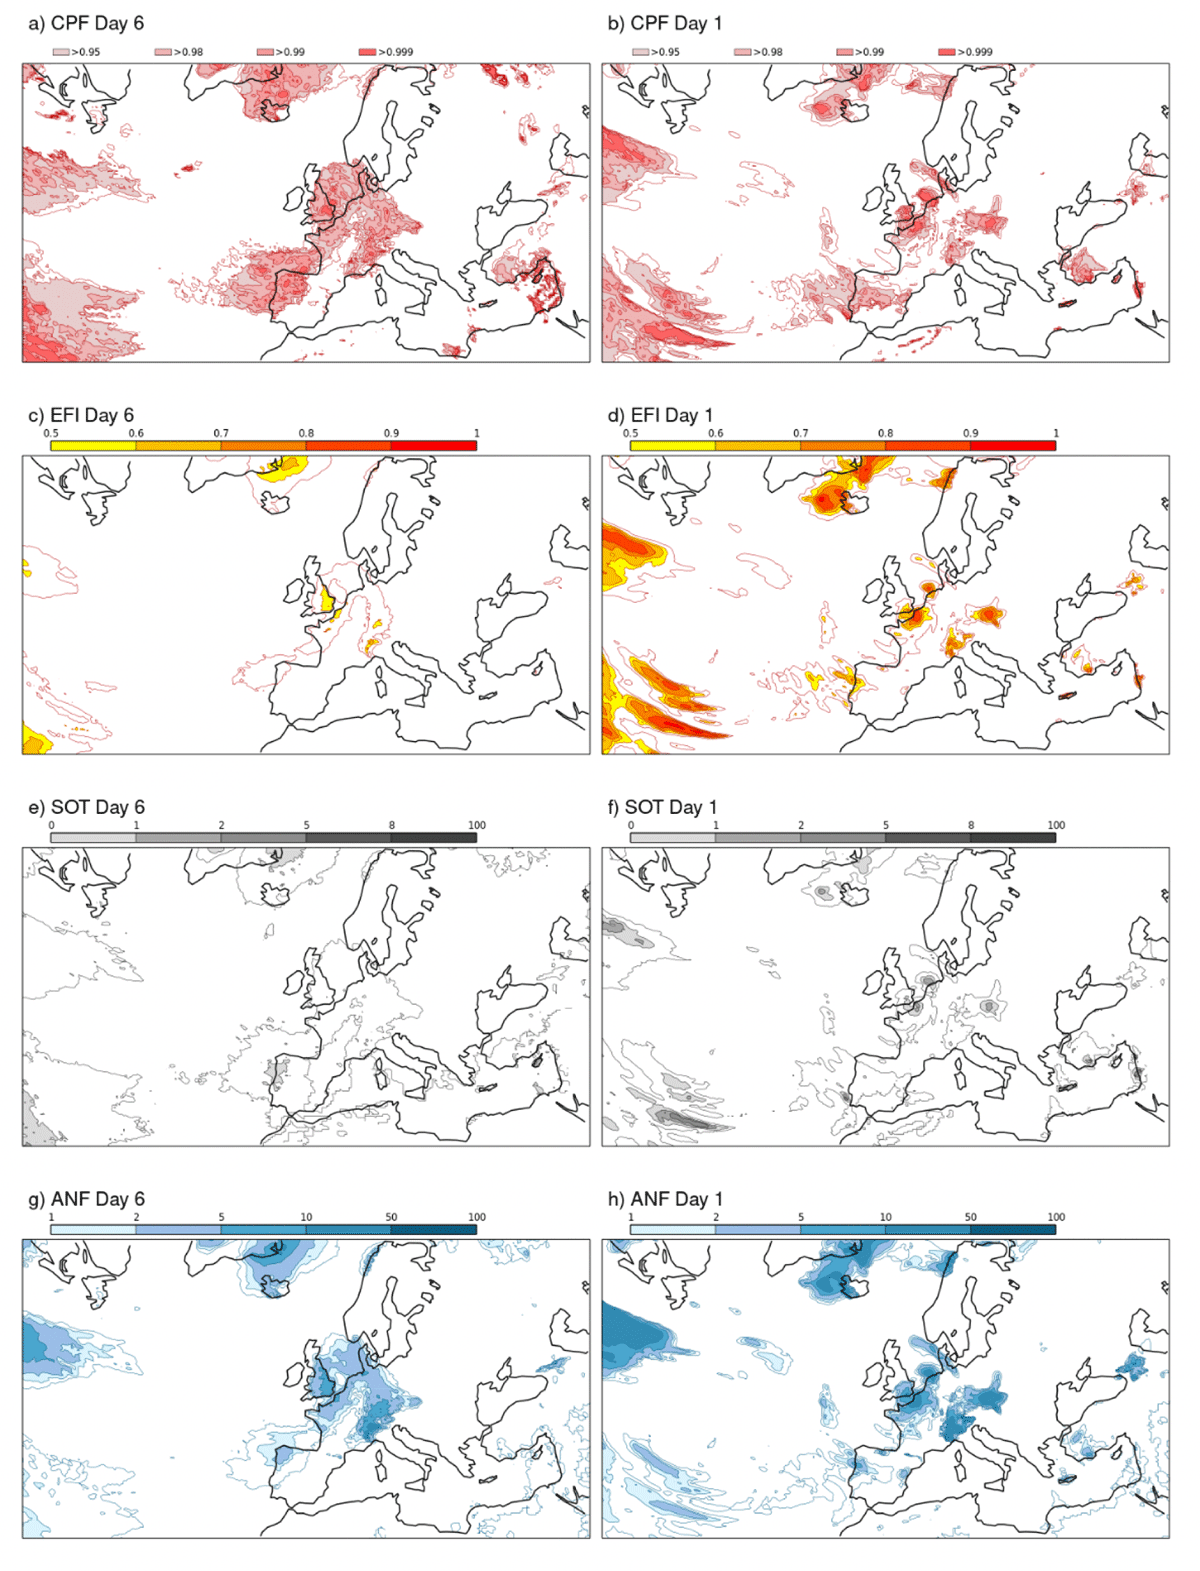
Figure 3
Same as Figure 2 but for forecasts valid on July 25, 2021.
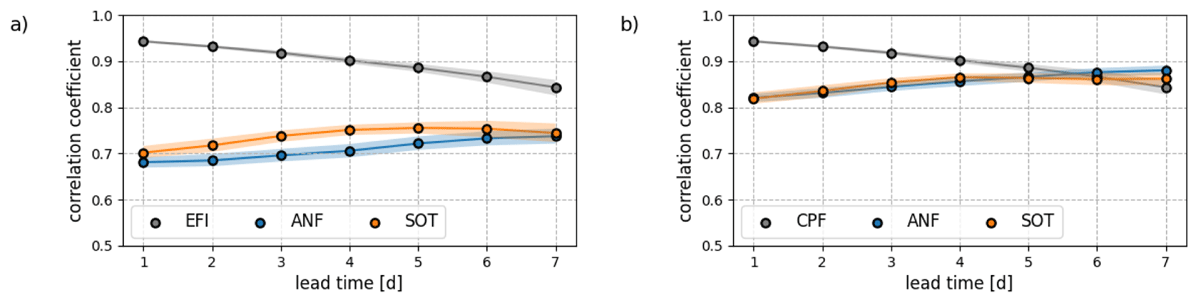
Figure 4
Spatial correlation between daily precipitation forecasts over Europe averaged over Summer 2021. Correlation of (a) CPF and (b) EFI with respect to one another, SOT, and ANF. The grey lines showing the correlation between CPF and EFI are identical in both panels. The shade represents the 5% and 95% confidence intervals as estimated with 5-day block boot-strapping.
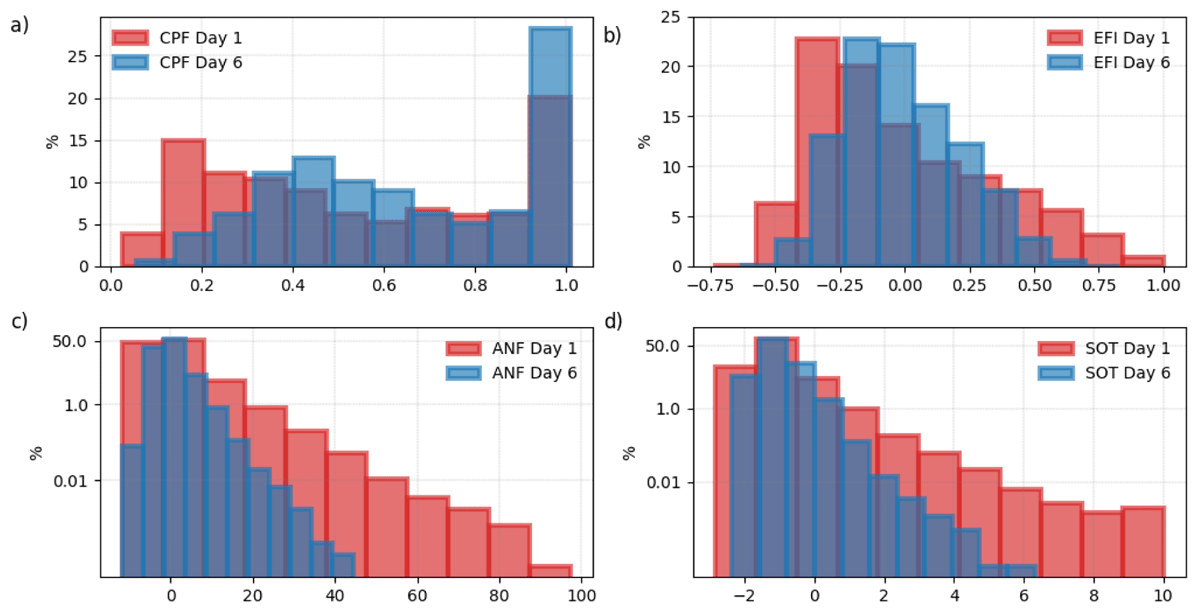
Figure 5
Forecast distribution at day 1 (red) and day 6 (blue) over Europe for Summer 2021: (a) CPF, (b) EFI, (c) SOT and (d) ANF of daily precipitation. Note the logarithmic scale of the y-axis in (c) and (d). CPF is the only type of forecasts exhibiting stronger values at longer lead times.
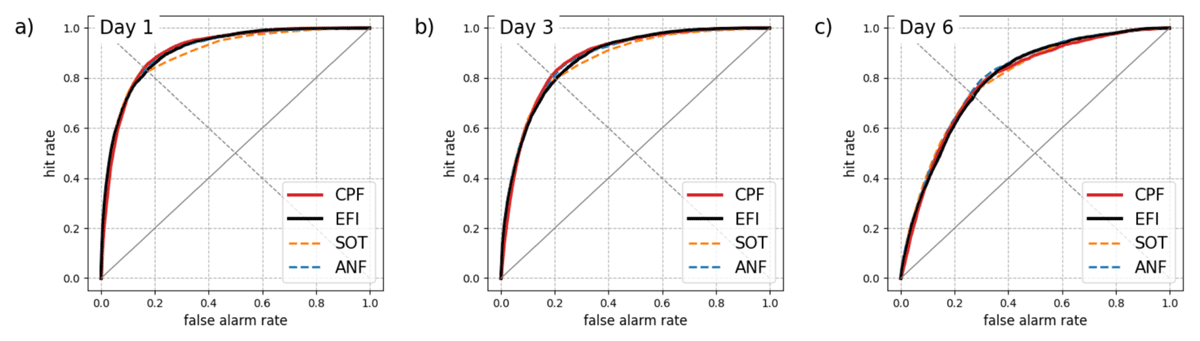
Figure 6
ROC curves assessing the potential discrimination ability of CPF, EFI, ANF, and SOT for daily precipitation exceeding the 95% climate percentile. Resulst for forecast lead times (a) day1, (b) day 3, and (c) day 6.
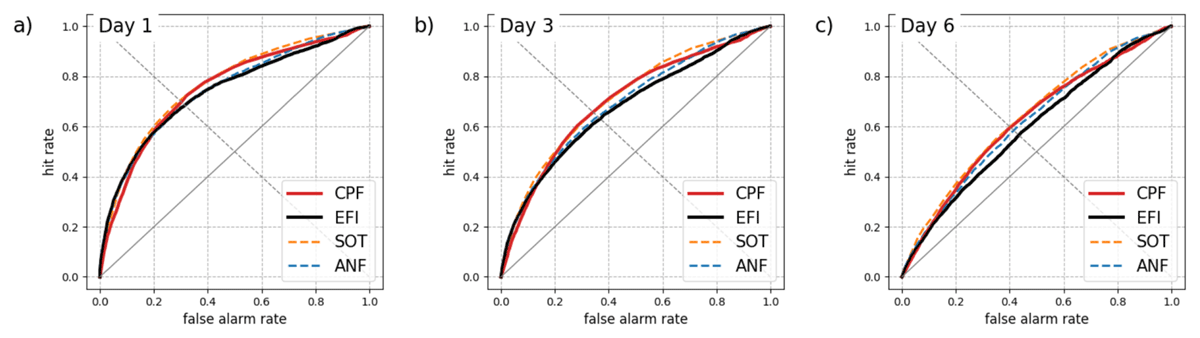
Figure 7
Potential discrimination ability to distinguish between “moderate” and “heavy” precipitation events. Same as Figure 6 but for the discrimination among the observed cases where precipitation exceed the 70% climate percentile.
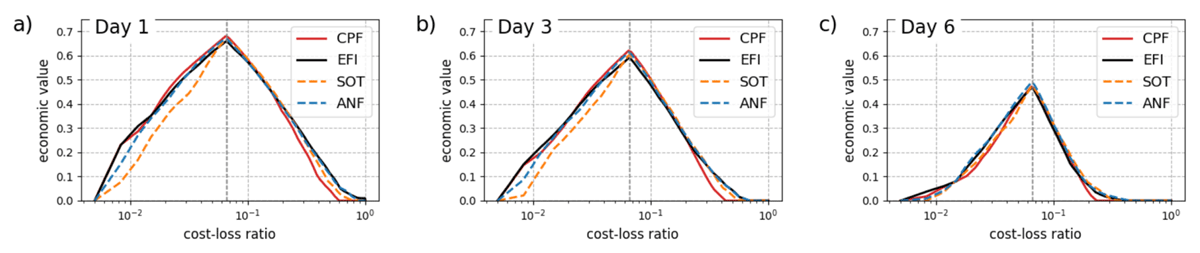
Figure 8
Potential economic value of daily precipitation forecasts as a function of a user’s cost-loss ratio. Results at (a) day 1, (b) day 3, and (c) day 6 for Europe over Summer 2021. Note that the x-axis is distorted (using a log-scale).
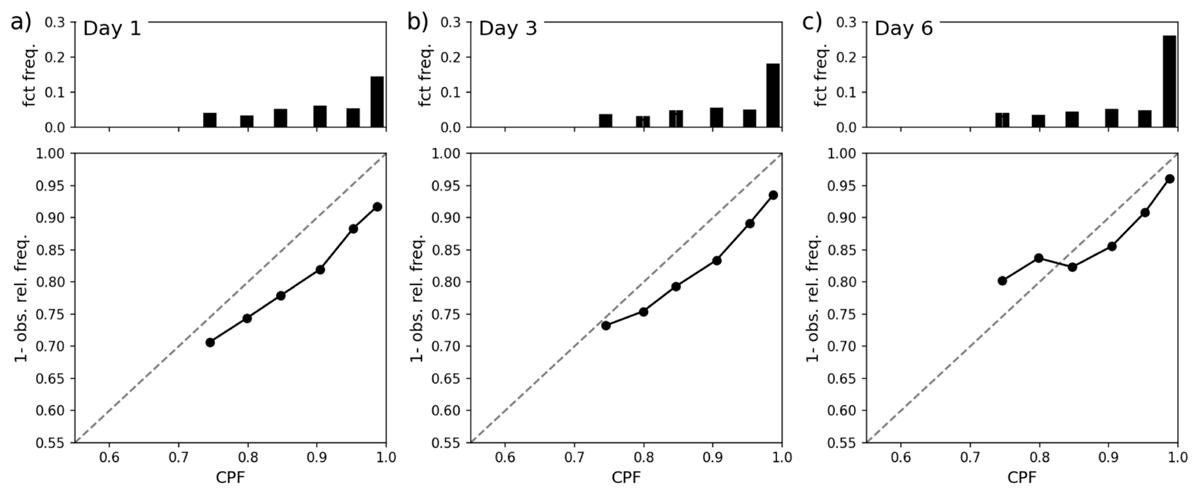
Figure 9
Reliability diagram for CPF of daily precipitation. Results are shown for forecasts at lead times (a) day 1, (b) day 3, and (c) day 7. In the lower panel, the observation relative frequency is aggregated for different CPF categories and perfect reliability is indicated with a dashed line. The upper panel shows the distribution of CPF in each category.
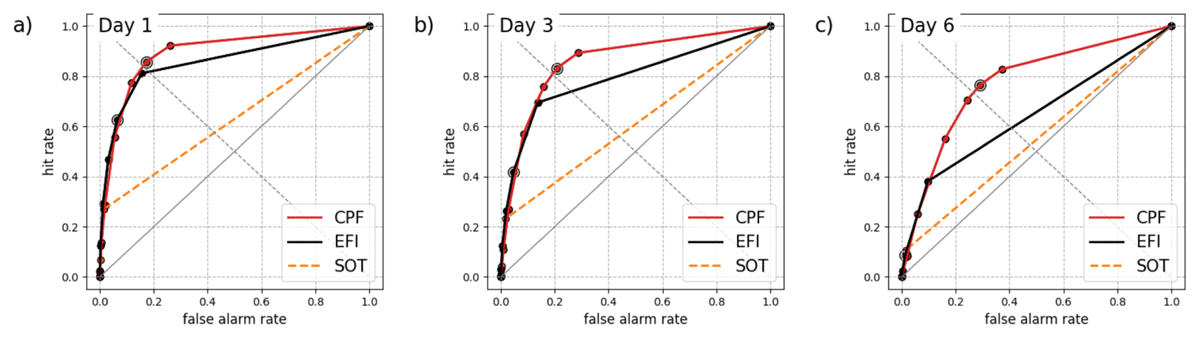
Figure 10
Discrimination ability of the actionable forecasts as plotted on ECMWF charts. Same as Figure 6 but when considering a fixed set of decision thresholds for each type of forecast.
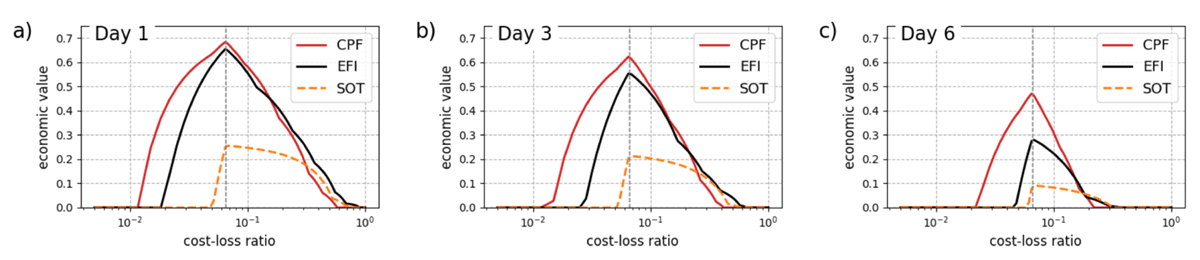
Figure 11
Economic value of daily precipitation actionable forecast. Same as Figure 8 but when considering the same set of decision-threolds as in Figure 10, that is the thresolds used for the forecast visualisation in Figures 2 and 3.
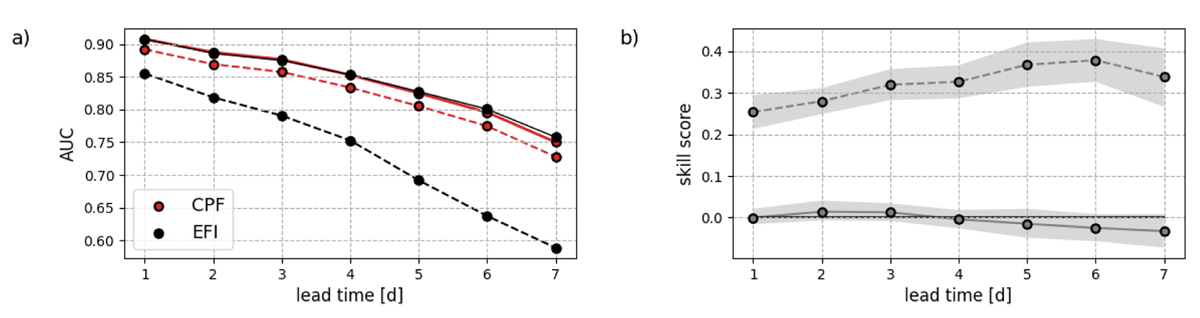
Figure 12
(a) Area under the ROC curve as a function of the forecast lead time and (b) corresponding skill score of CPF using EFI as a reference forecast. The solid lines indicate the potential discrimination ability while the dashed lines indicate the actual discrimination ability when considering a limited set of decision thresholds. In (b), the shade represents the 5% and 95% confidence intervals as estimated with 5-day block boot-strapping. Forecast discretisation has a negative impact on EFI discrimination while CPF discrimination is preserved at all lead times.