
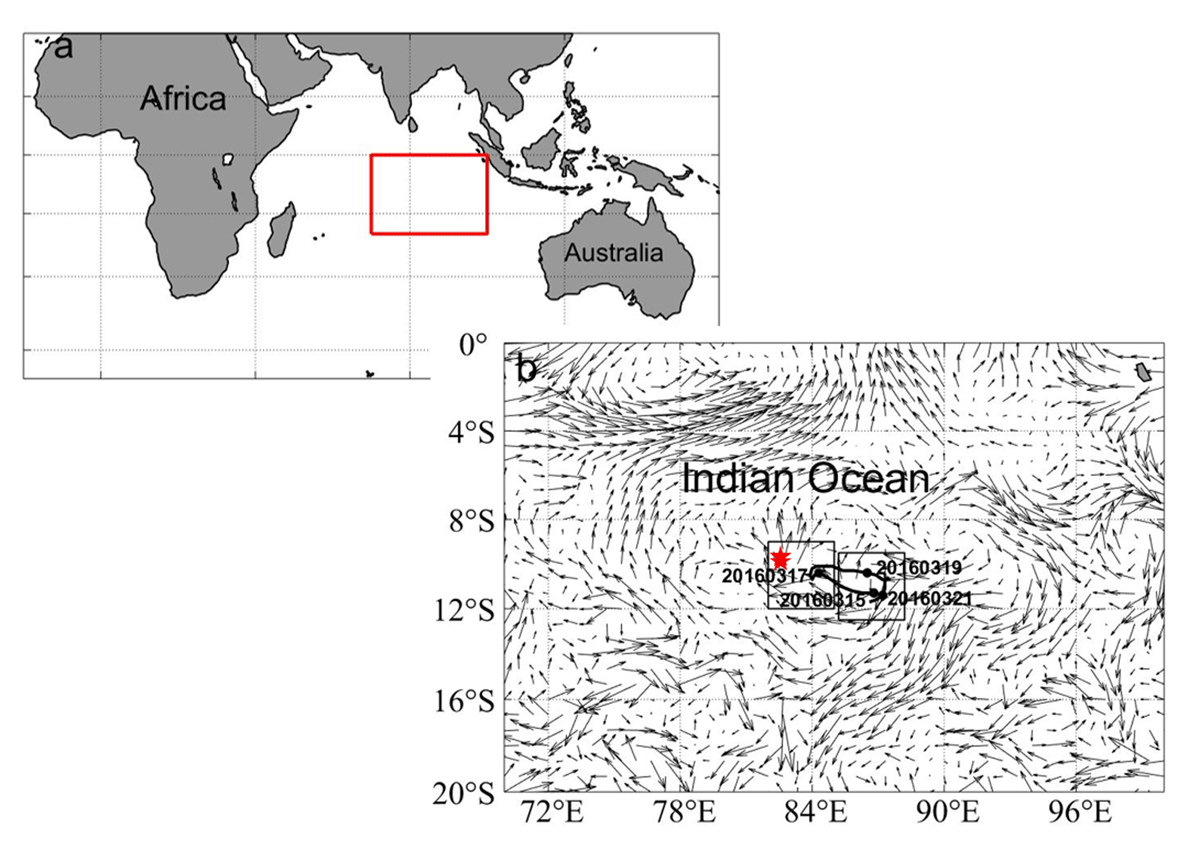
Figure 1
The study area’s geographical location and the TC trajectory with the flow field (black arrow). The Argo buoy is marked by the star (number 1901447). Box A: 9°S-12°S, 82°E-85°E; Box B: 9.5°S-12.5°S, 85.2°E-88.2°E.
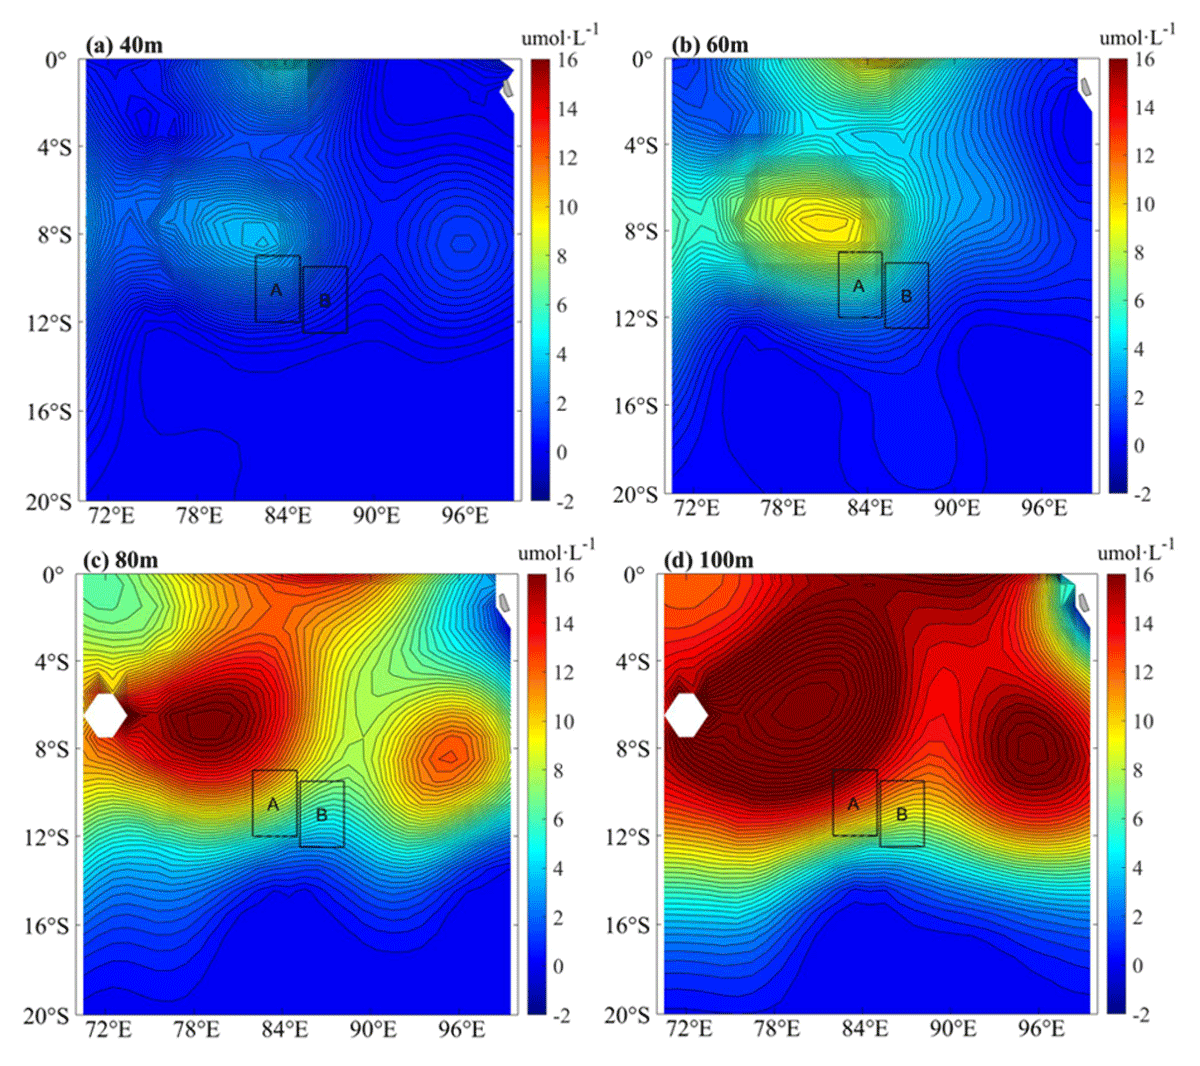
Figure 2
Climatology nitrate concentrations (µmol∙L–1) at different depths in March 2016 (a, b, c, and d denote the nitrate concentrations at depths of 40 m, 60 m, 80 m, and 100 m, respectively).
Table 1
Position, time, and MSW (maximum wind speed) of the studied TC.
| LAT (°S) | LON (°E) | TIME | MSW (M/S) |
|---|---|---|---|
| 11.3 | 86.8 | 03/15/06 | 12.5 |
| 11.3 | 86.3 | 03/15/12 | 15 |
| 11.0 | 85.3 | 03/16/00 | 27.5 |
| 10.6 | 84.7 | 03/16/12 | 37.5 |
| 10.4 | 84.3 | 03/17/00 | 50.5 |
| 10.7 | 84.0 | 03/17/12 | 57.5 |
| 10.1 | 84.2 | 03/18/00 | 45 |
| 10.3 | 85.4 | 03/18/12 | 32.5 |
| 10.4 | 86.5 | 03/19/00 | 32.5 |
| 10.7 | 87.2 | 03/19/12 | 37.5 |
| 10.7 | 87.5 | 03/20/00 | 32.5 |
| 10.8 | 87.3 | 03/20/12 | 25 |
| 11.4 | 87.2 | 03/21/00 | 20 |
| 11.7 | 86.6 | 03/21/12 | 12.5 |
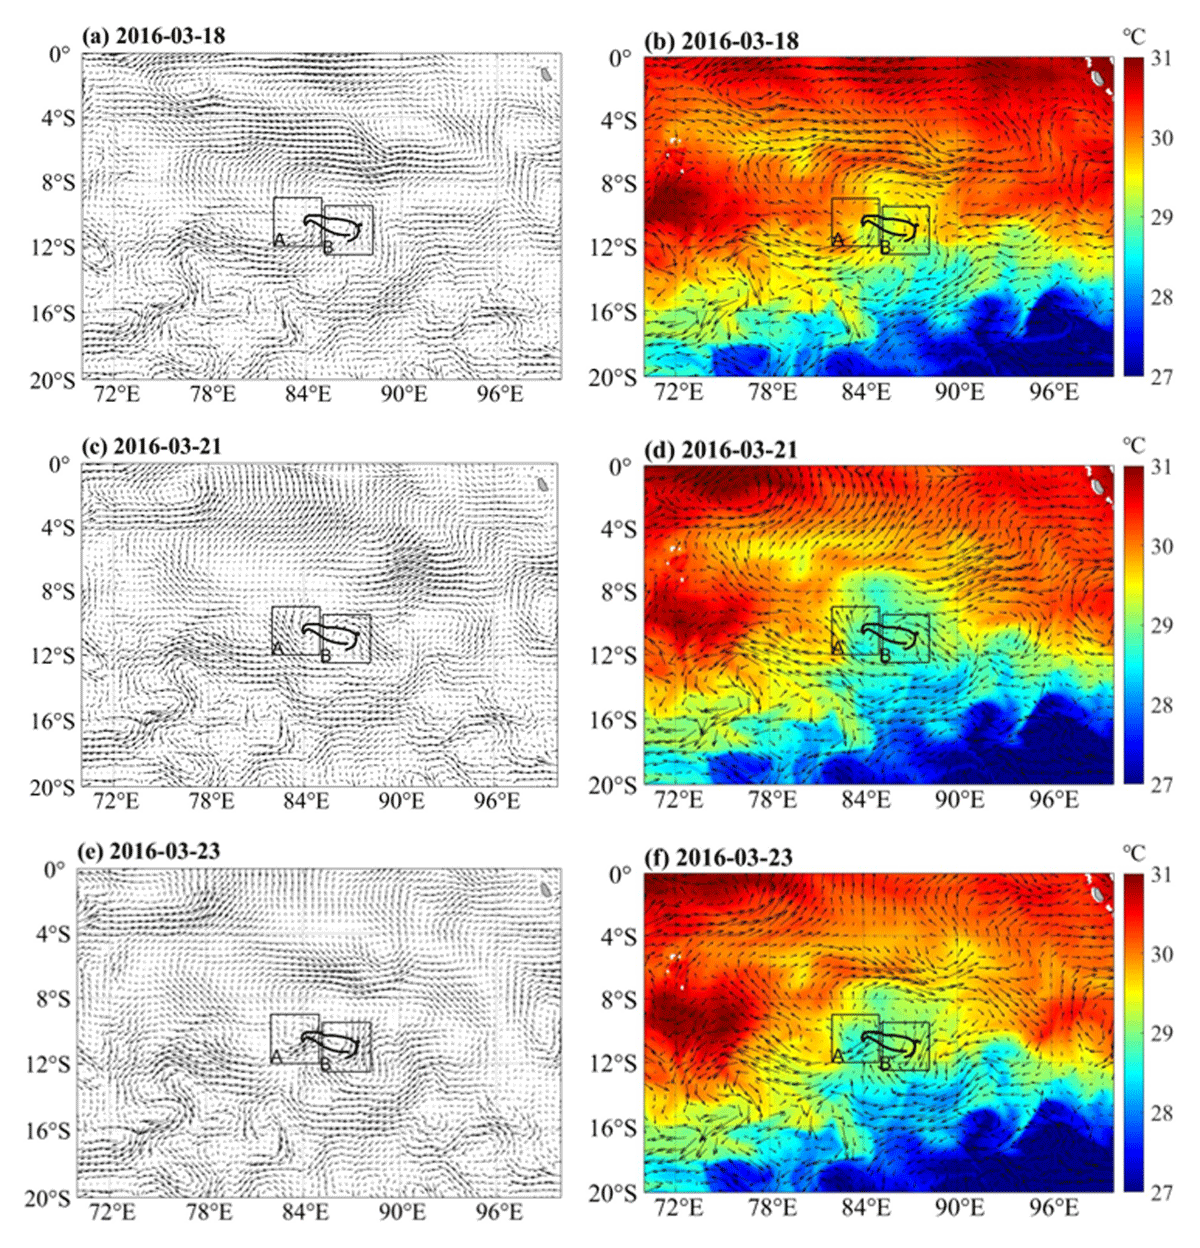
Figure 3
Sea surface currents (in units of m·s–1) and SSTs during the development of the TC. Panels (a), (c), and (e) showthe changes in the flow field (arrows) on March 18, March 21, and March 23, 2016, respectively; panels (b), (d), and (f) show the SST changes on March 18, March 21, and March 23, 2016, respectively, and the color bar represents the SST (°C).
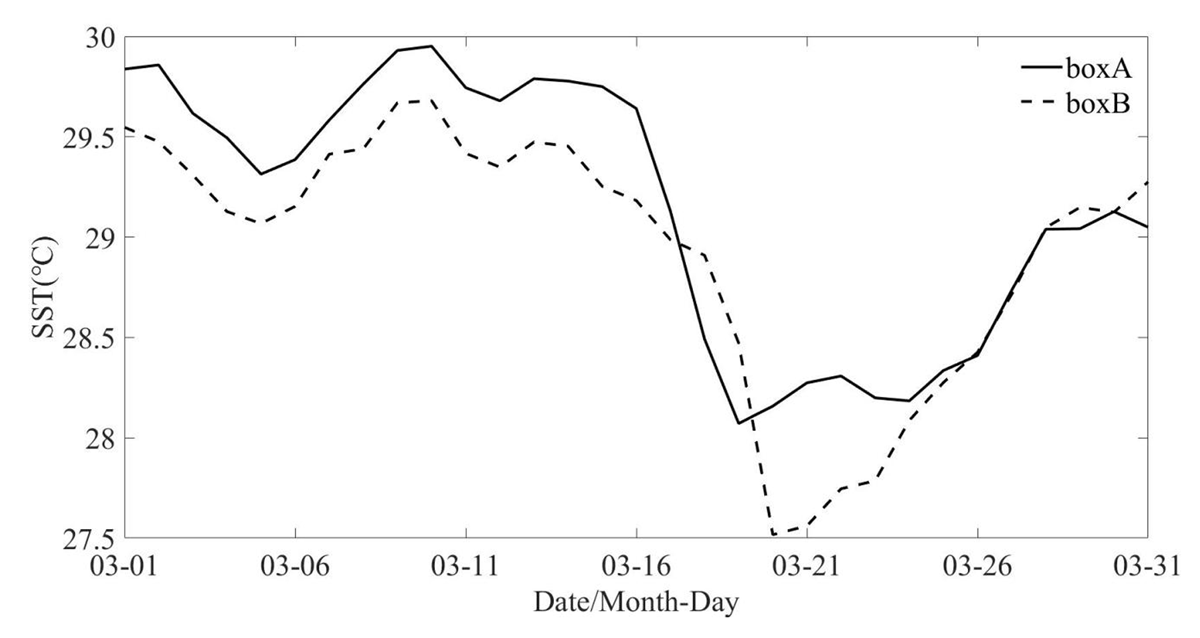
Figure 4
Spatially averaged SSTs from March 1 to March 31 in Boxes A and B.
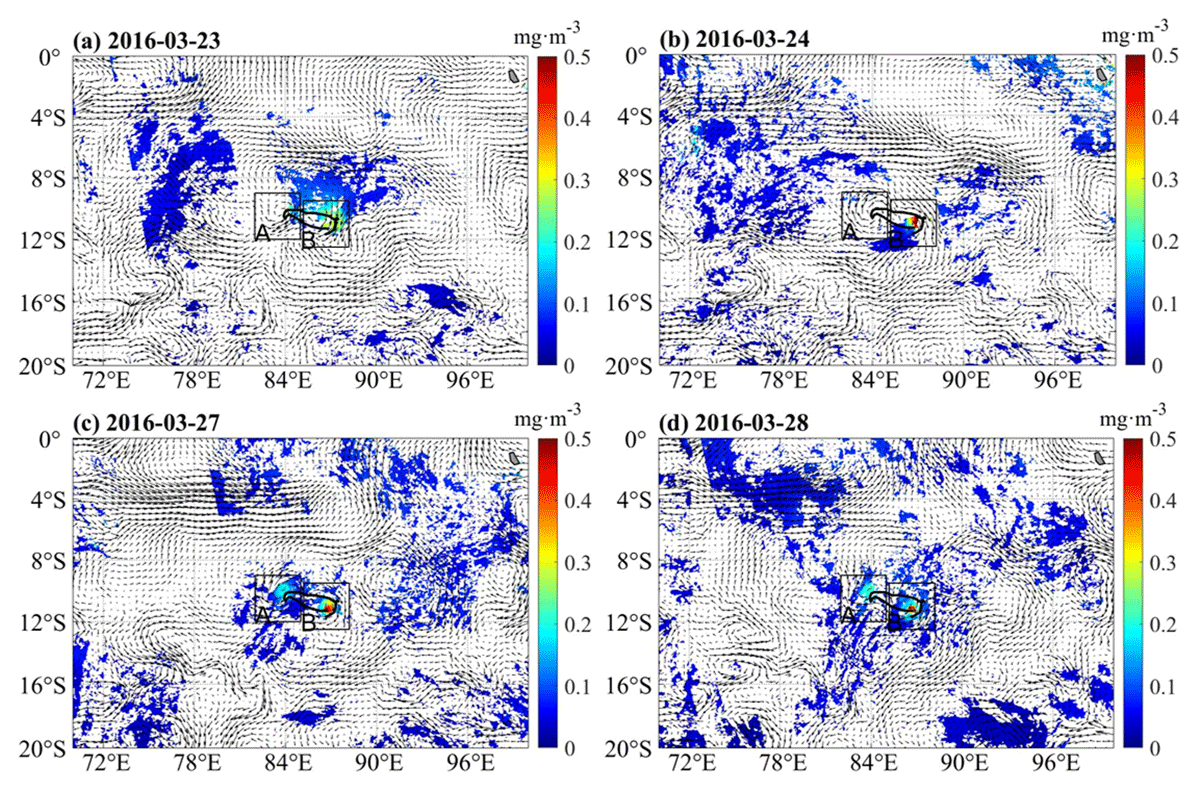
Figure 5
Concentrations of Chl-a and surface flows (black arrow) at diverse times. Panels (a), (b), (c), and (d) show the changes in Chl-a on March 23, March 24, March 27, and March 28, 2016, respectively.
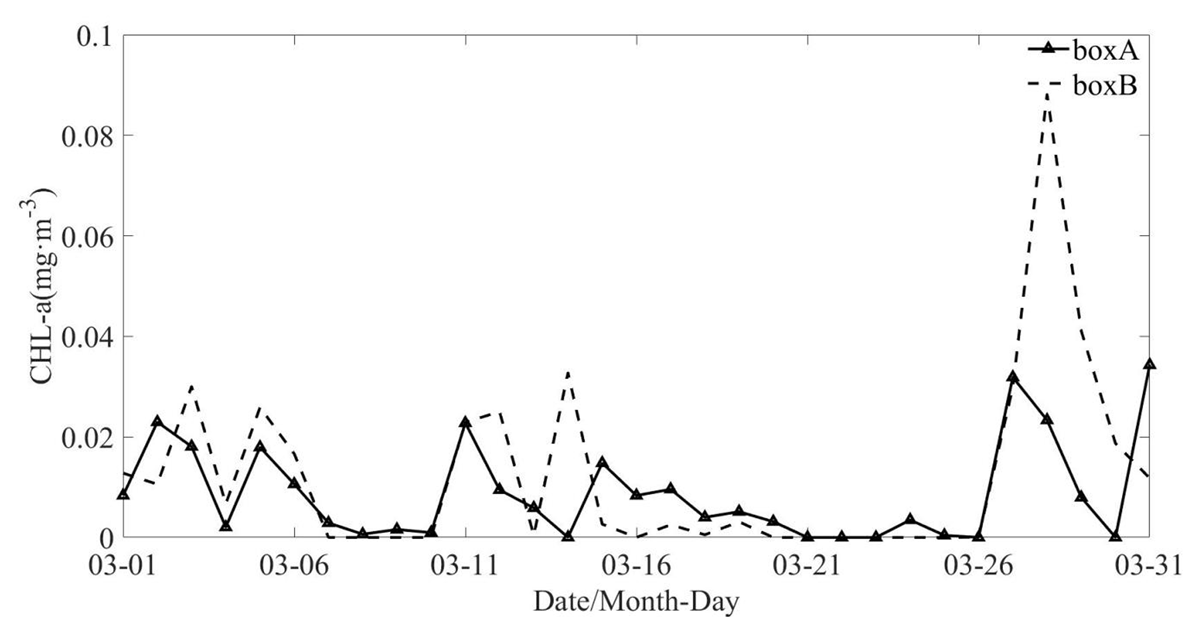
Figure 6
Spatially averaged chl-a concentrations from March 1 to March 31 in Boxes A and B.
Table 2
Position, time of the TC in 2011–2019.
| YEARS | TC NAME | TIME | LAT RANGE (°S) | LON RANGE(°E) | PHYTOPLANKTON BLOOMS |
|---|---|---|---|---|---|
| 2011 | CHERONO | 03/14–03/23 | 11.3–27.5 | 57–87.7 | Yes |
| 2013 | JAMALA | 05/07–05/15 | 5.8–10.7 | 80.2–88.7 | No |
| 2015 | IKOLA | 04/04–04/08 | 10.5–22 | 86.6–99 | No |
| 2019 | LORNA | 04/21–04/30 | 4–23.9 | 79.3–90 | No |
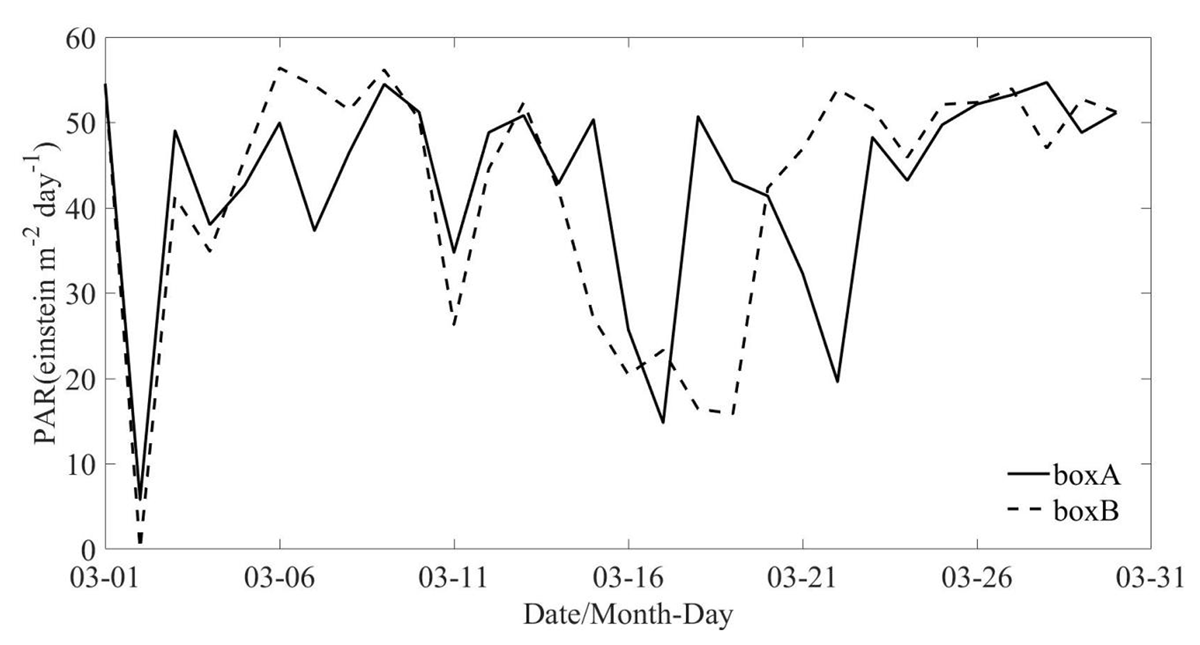
Figure 7
Spatially averaged PAR from March 1 to March 31 in Boxes A and B.
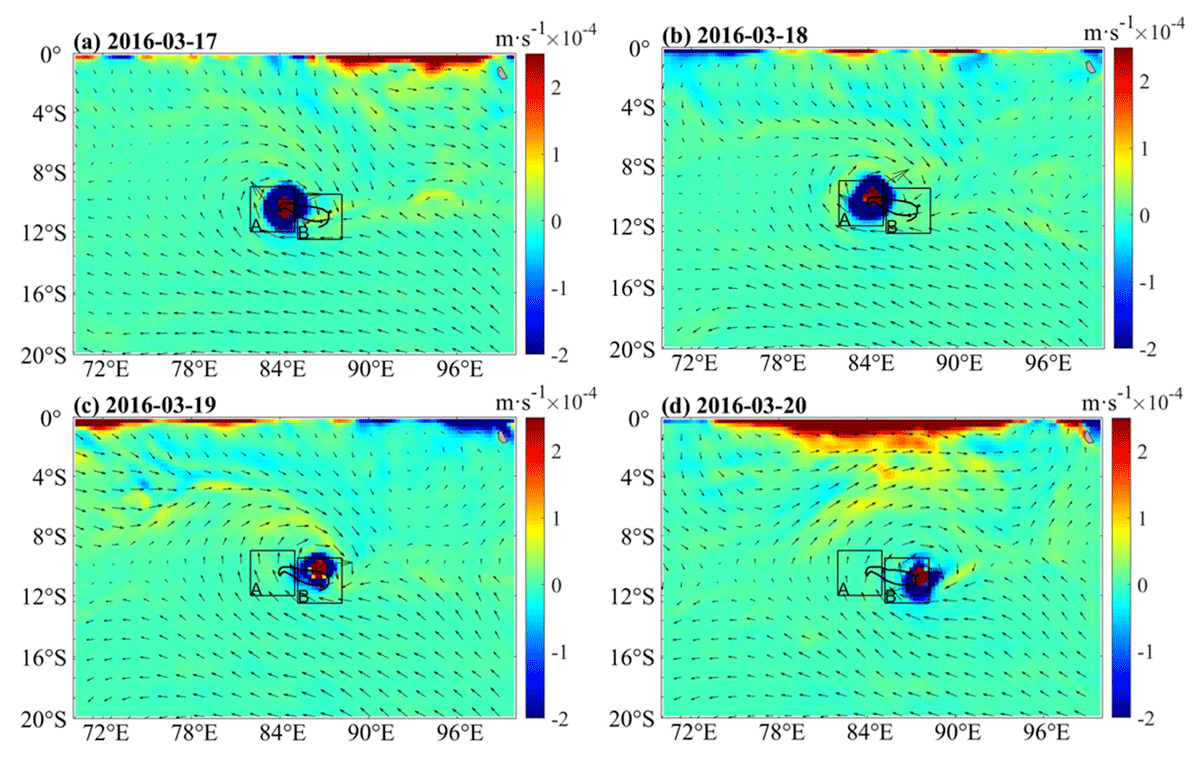
Figure 8
Surface wind speeds (black arrow) and EPVs during the passage of the studied TC (unit: m/s).
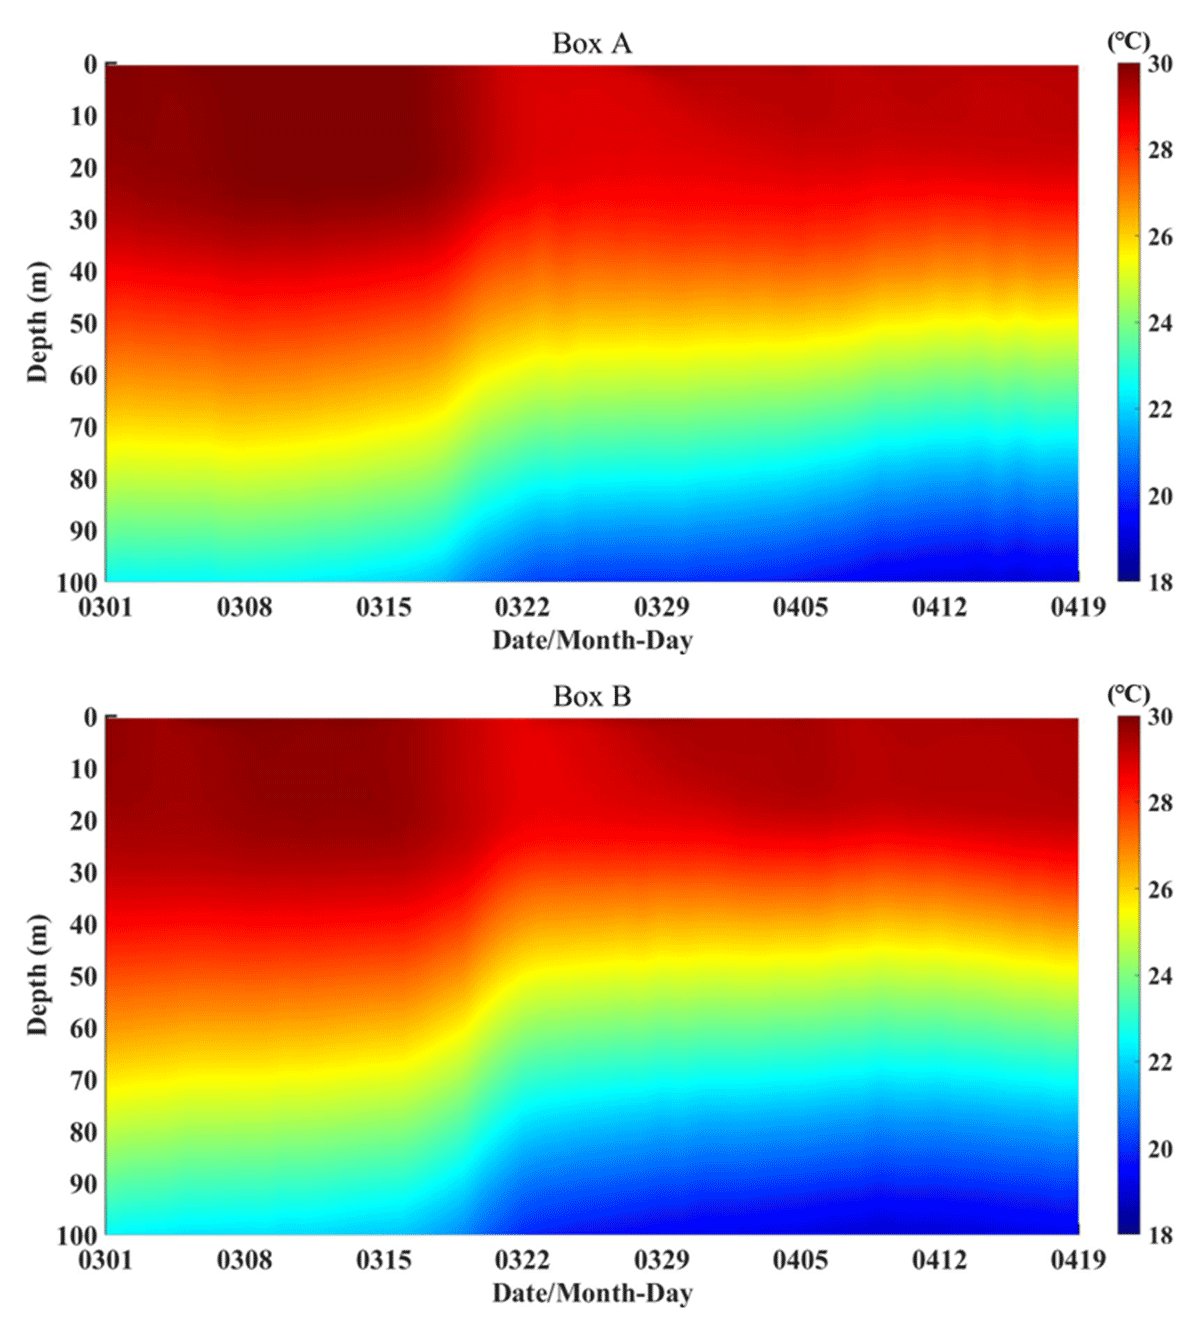
Figure 9
Time series of temperatures at various depths in Boxes A and B.
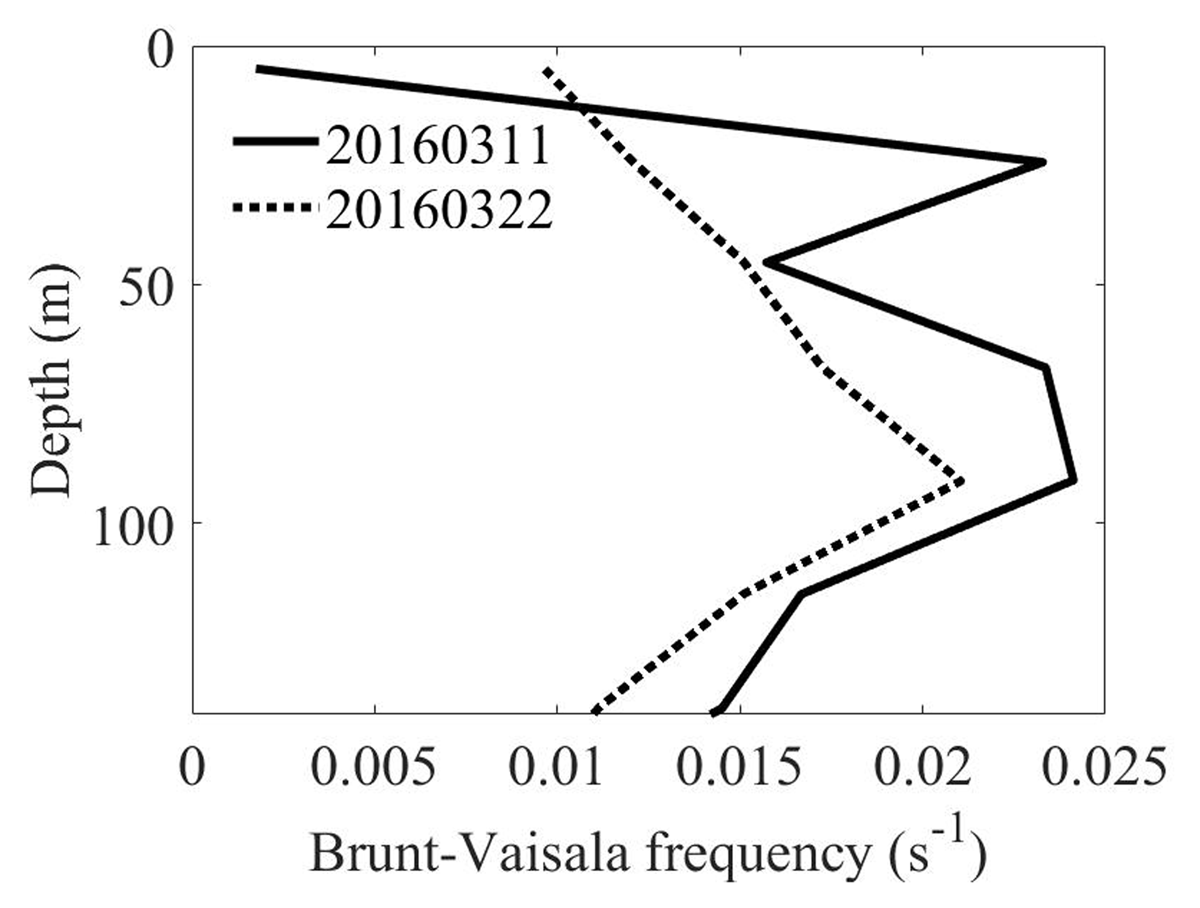
Figure 10
Vertical distribution of the buoyancy frequency before and after the TC.
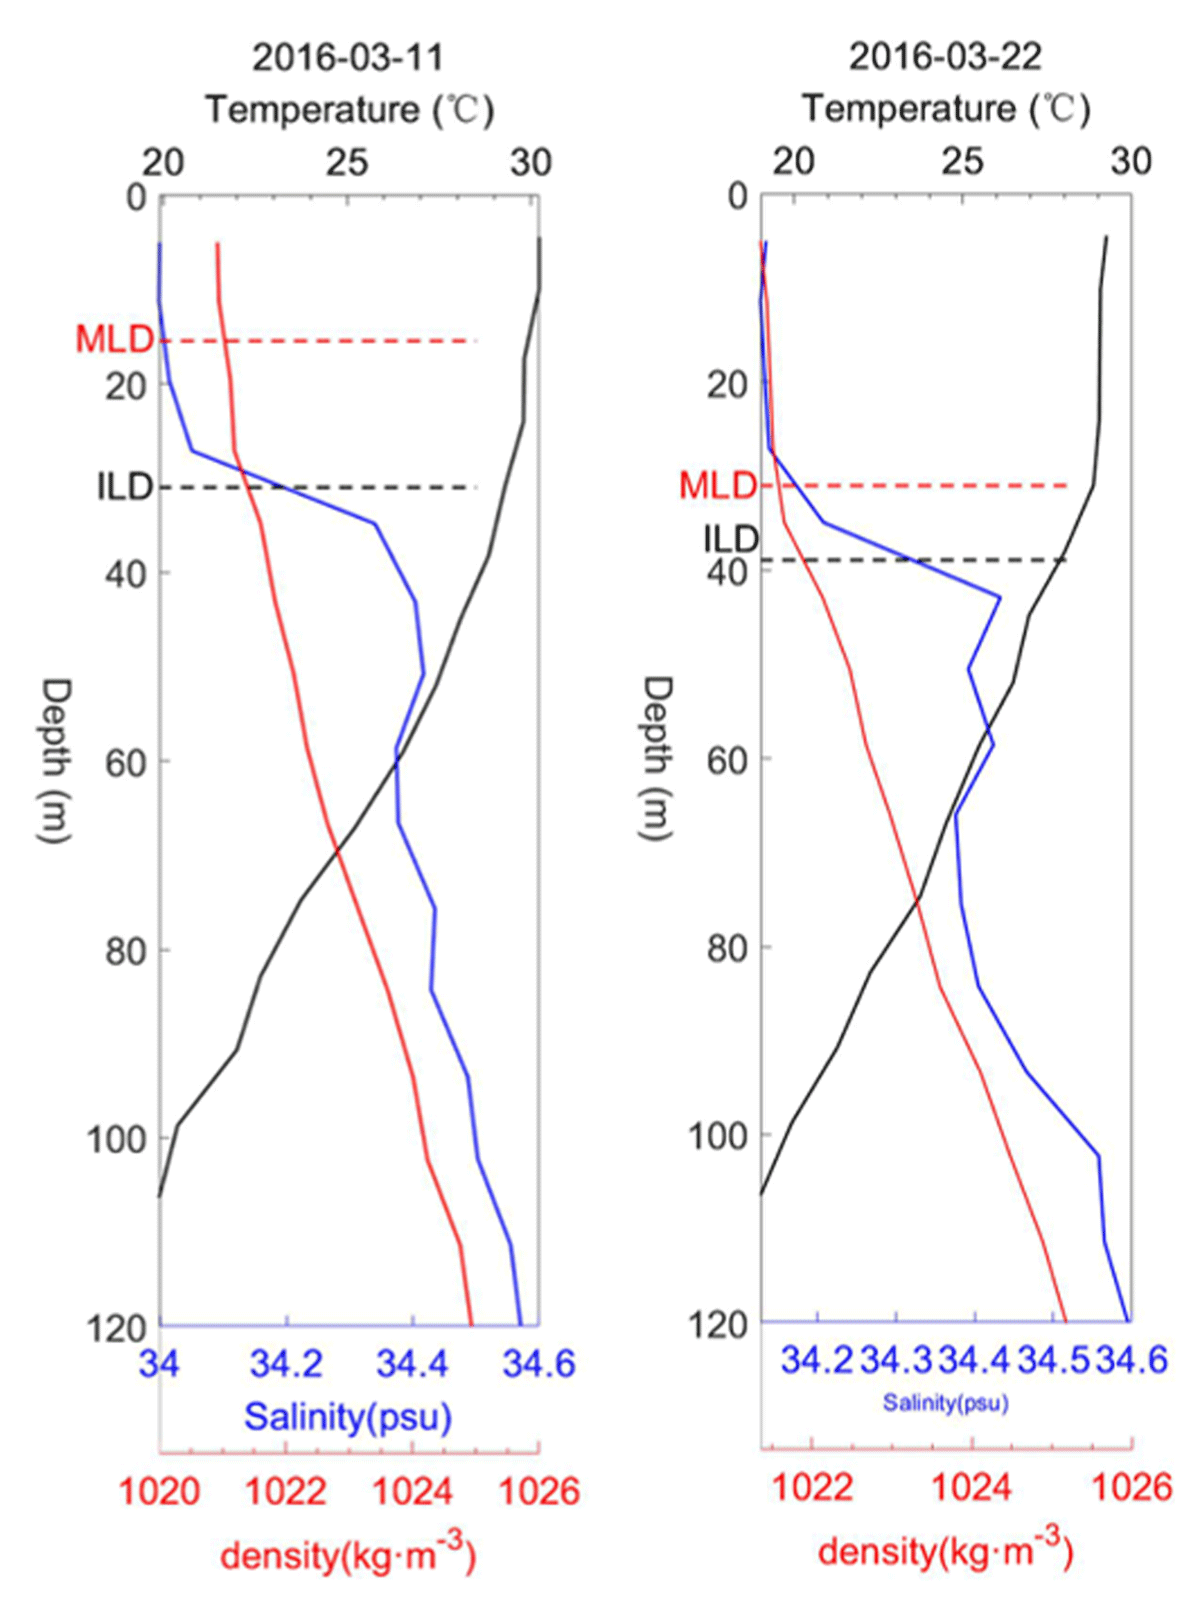
Figure 11
MLD and ILD data from Argo floats on March 11 and March 22.
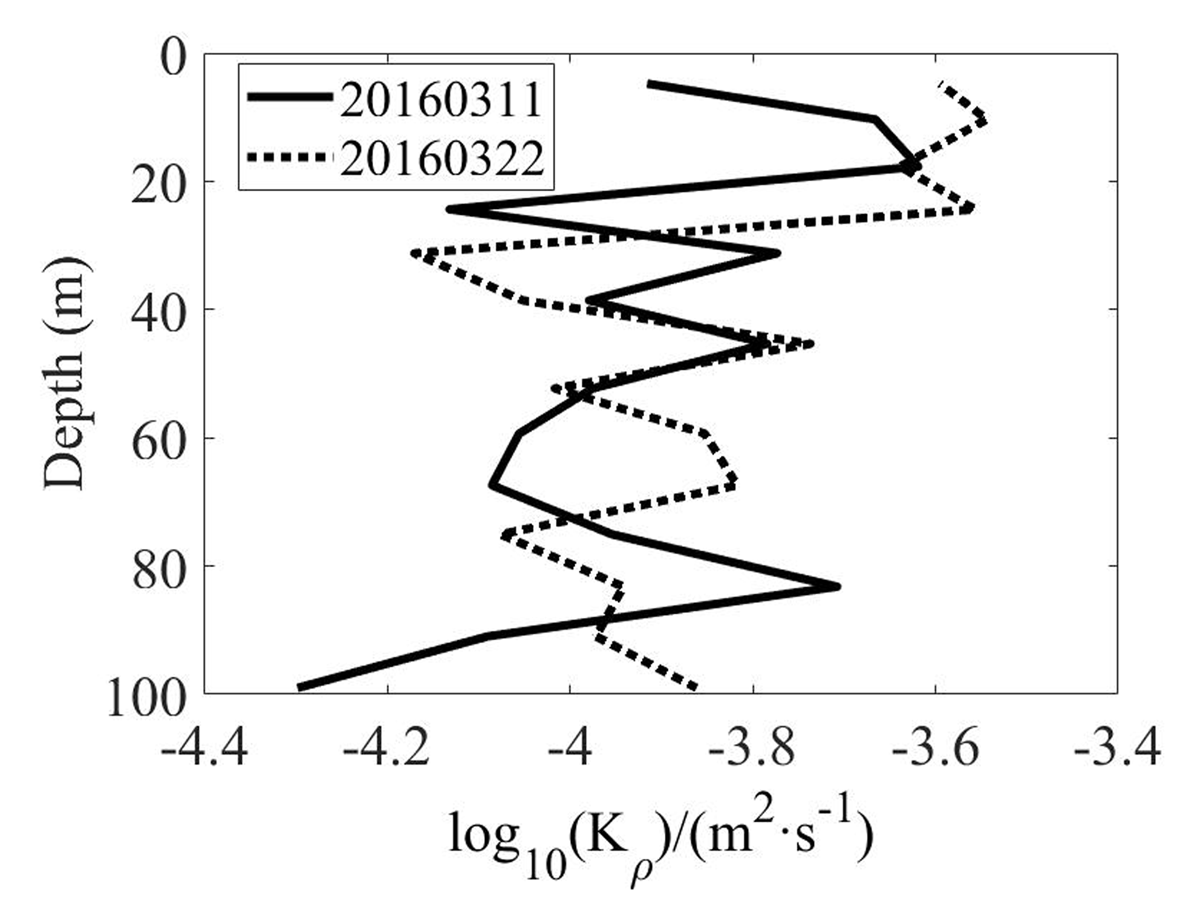
Figure 12
Daily average turbulent eddy diffusivity (Kρ).
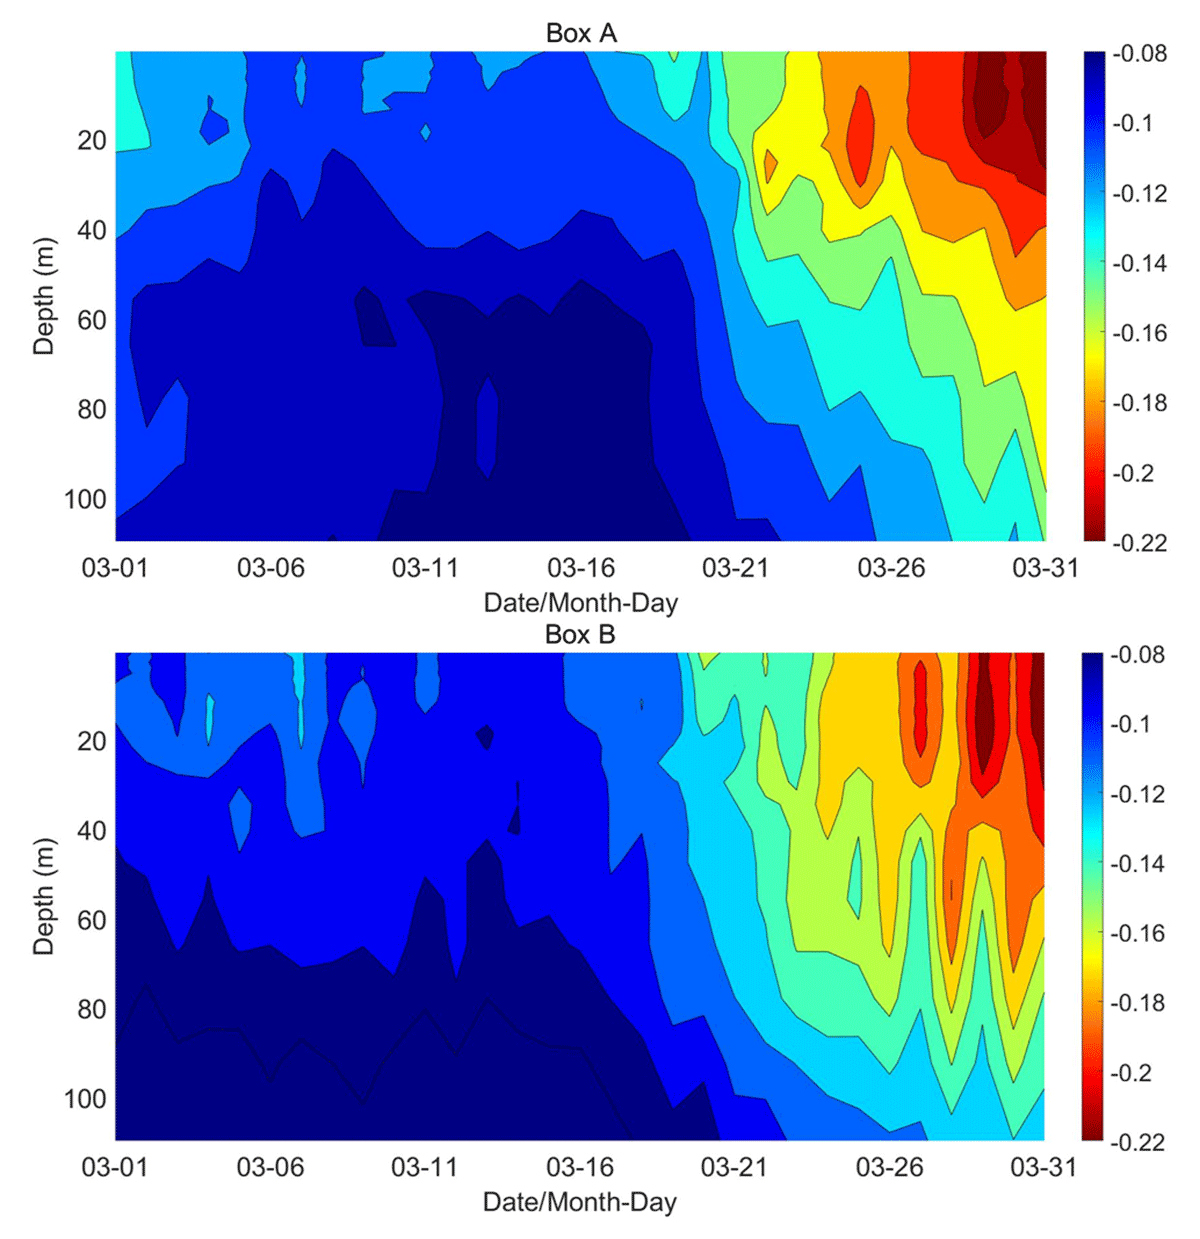
Figure 13
Time series of vorticities at diverse depths in Boxes A and B.