
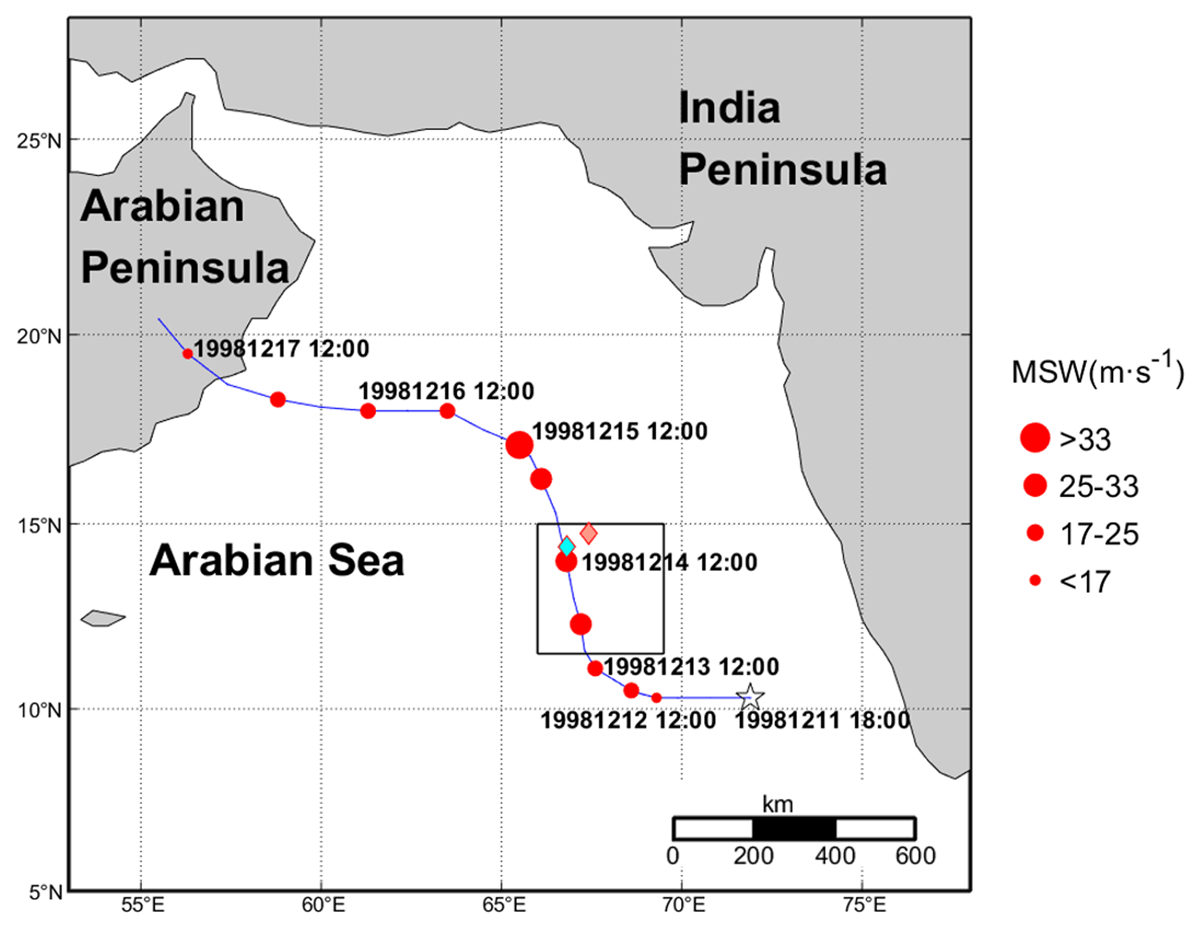
Figure 1
Track of tropical cyclone ARB 06. Locations of the tropical cyclone center are indicated by the red circles in the time format of year-month-date -hour. Diamonds mark the positions of the floats (Cyan diamond: 03/12/1998 66.81°E, 14.39°N; Red diamond: 29/12/1998 67.42°E 14.74°N). The circle size represents the maximum wind speed. The studied box A is indicated by the black square: 11.5°N–15°N, 66°E–69.5°E.
Table 1
Position, time, intensity and translation speed of tropical cyclone ARB 06.
| LAT(°N) | LON(°E) | TIME | MSW(M·S–1) | TS(M·S–1) |
|---|---|---|---|---|
| 10.3 | 71.9 | 12/11/18 | 10.29 | |
| 10.3 | 70.8 | 12/12/00 | 12.86 | 5.57 |
| 10.3 | 69.9 | 12/12/06 | 12.86 | 4.56 |
| 10.3 | 69.3 | 12/12/12 | 12.86 | 3.04 |
| 10.4 | 68.9 | 12/12/18 | 15.43 | 2.09 |
| 10.5 | 68.6 | 12/13/00 | 18.01 | 1.60 |
| 10.8 | 68.1 | 12/13/06 | 23.15 | 2.96 |
| 11.1 | 67.6 | 12/13/12 | 23.15 | 2.96 |
| 11.6 | 67.3 | 12/13/18 | 25.72 | 2.99 |
| 12.3 | 67.2 | 12/14/00 | 28.29 | 3.64 |
| 13.0 | 67.0 | 12/14/06 | 30.87 | 3.74 |
| 14.0 | 66.8 | 12/14/12 | 30.87 | 5.24 |
| 15.3 | 66.5 | 12/14/18 | 30.87 | 6.86 |
| 16.2 | 66.1 | 12/15/00 | 30.87 | 5.04 |
| 16.8 | 65.8 | 12/15/06 | 33.44 | 3.43 |
| 17.1 | 65.5 | 12/15/12 | 33.44 | 2.14 |
| 17.5 | 64.5 | 12/15/18 | 33.44 | 5.33 |
| 18.0 | 63.5 | 12/16/00 | 23.15 | 5.54 |
| 18.0 | 62.4 | 12/16/06 | 20.58 | 5.39 |
| 18.0 | 61.3 | 12/16/12 | 20.58 | 5.39 |
| 18.1 | 60.0 | 12/16/18 | 20.58 | 6.38 |
| 18.3 | 58.8 | 12/17/00 | 18.01 | 5.96 |
| 18.7 | 57.4 | 12/17/06 | 18.01 | 7.14 |
| 19.5 | 56.3 | 12/17/12 | 15.43 | 6.75 |
| 20.4 | 55.5 | 12/17/18 | 12.86 | 6.04 |
[i] (MSW: maximum wind speed; TS: translation speed).
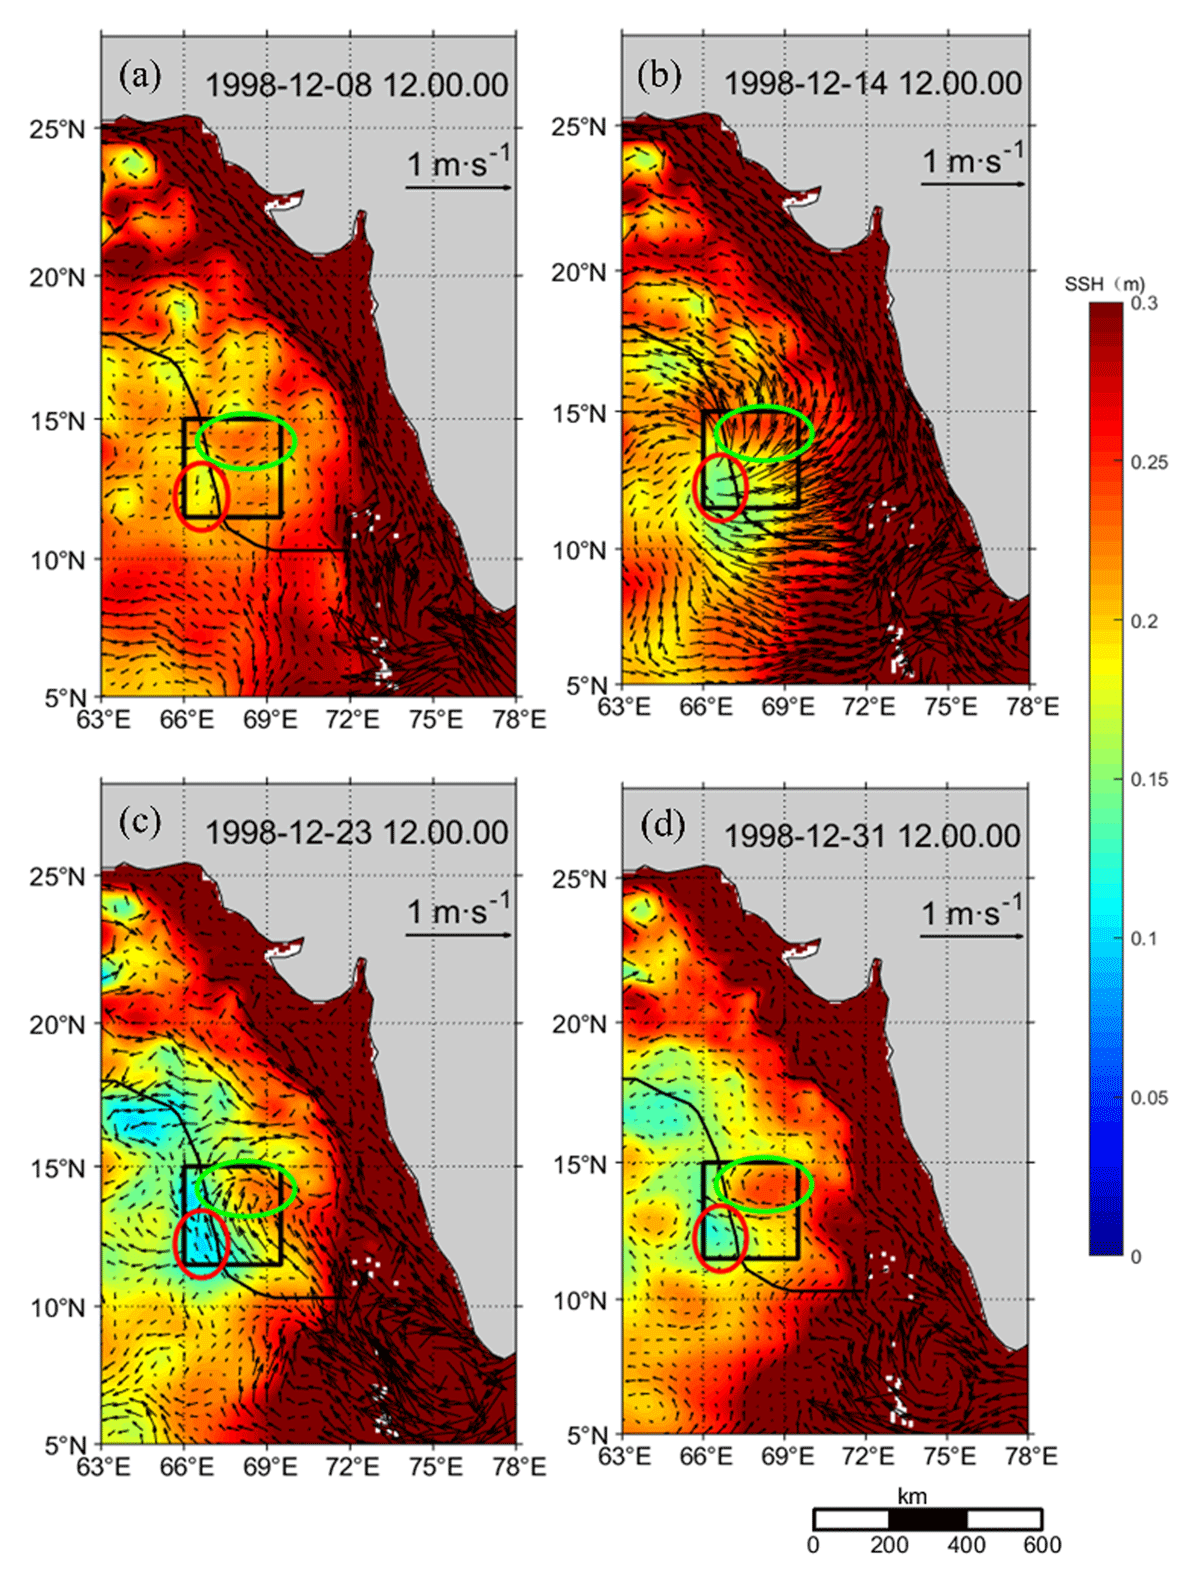
Figure 2
Sea surface current (unit in m·s–1) on Dec.8, Dec.14, Dec.23 and Dec.31 1998. The color bar represents the SSH (unit in m). Track of ARB 06 is indicated by the blue line. The red and green solid line elliptical rings mark the positions of cyclonic and anticyclonic eddies, respectively. Data: CMEMS 2022, http://marine.copernicus.eu/.
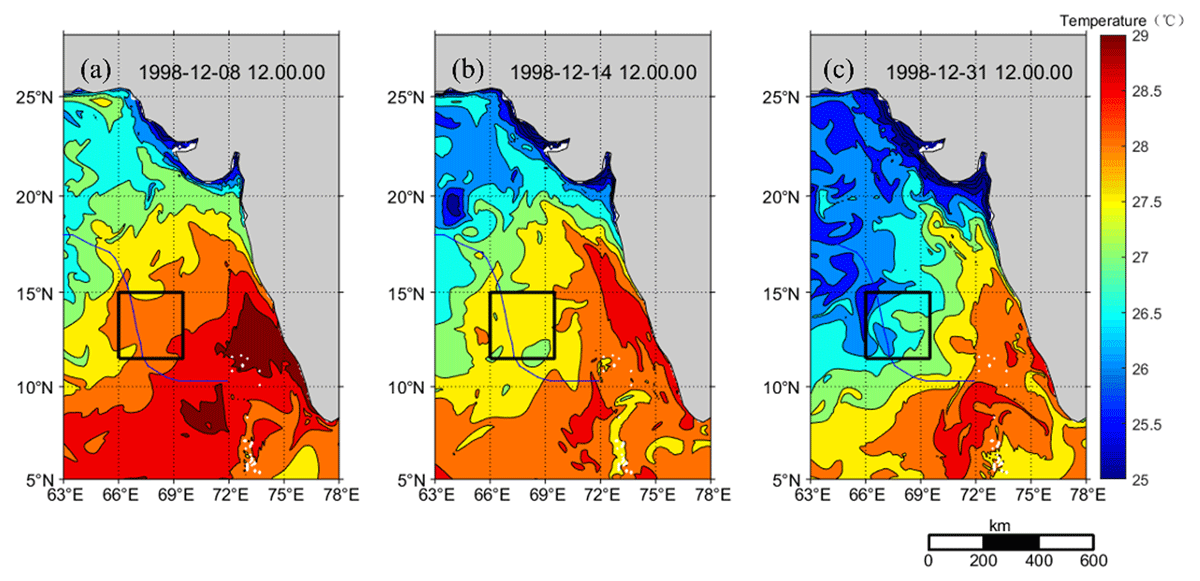
Figure 3
SST during and after the passage of ARB 06. Data: CMEMS 2022, http://marine.copernicus.eu/.
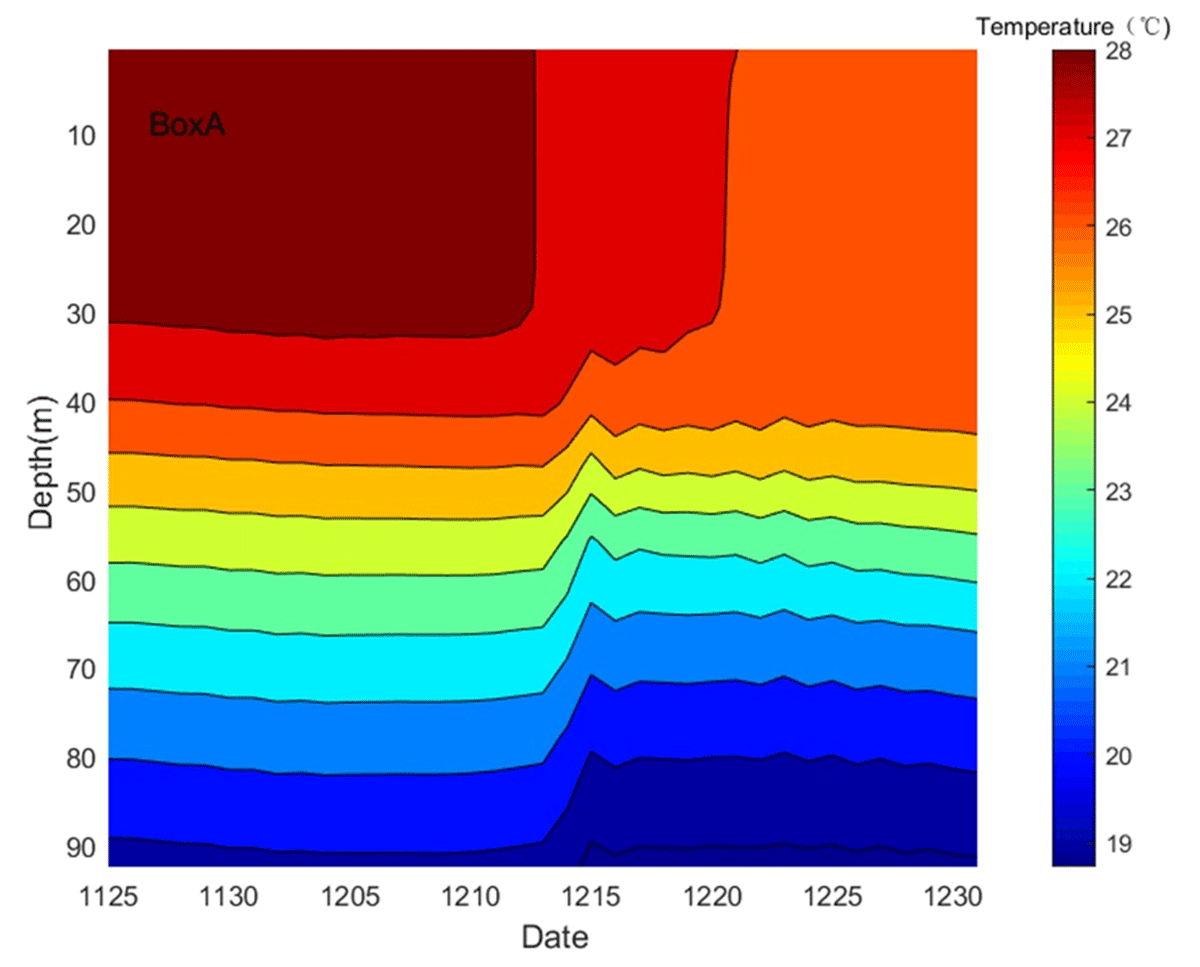
Figure 4
A time series of the spatially averaged temperature with depth in box A from Nov. 25 to Dec.31.
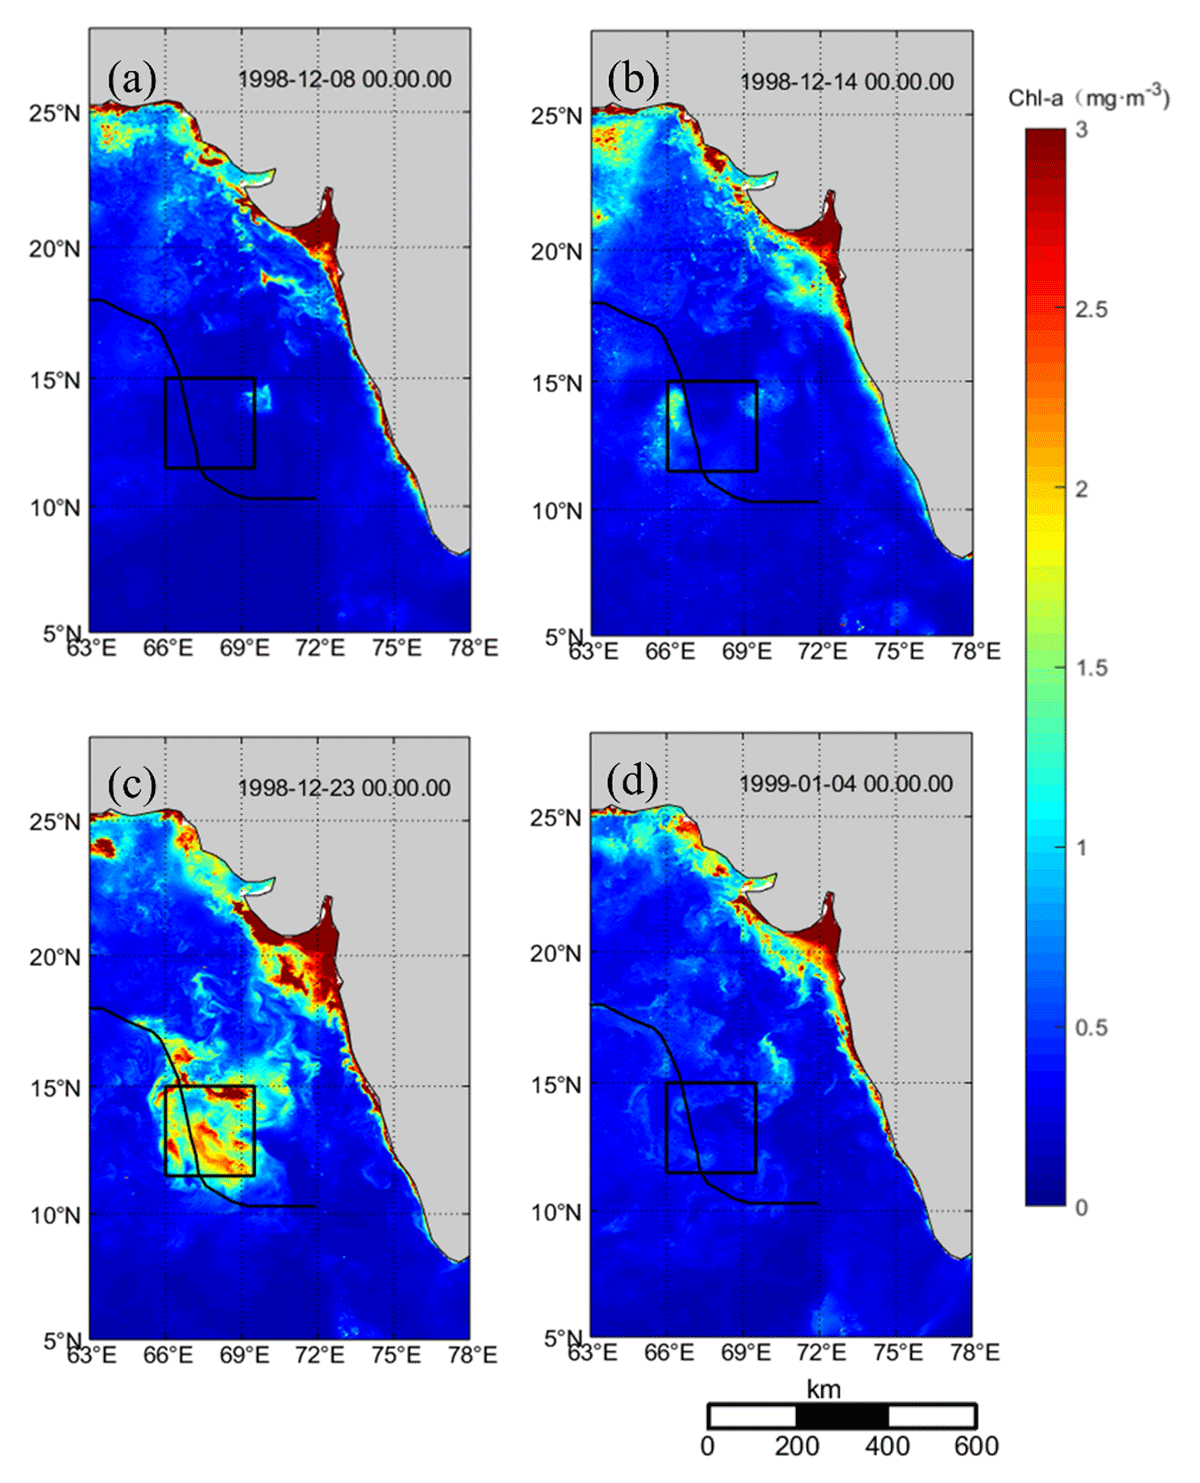
Figure 5
Daily mean Chl-a concentration during and after the passage of ARB 06. Data: CMEMS 2022, http://marine.copernicus.eu/.
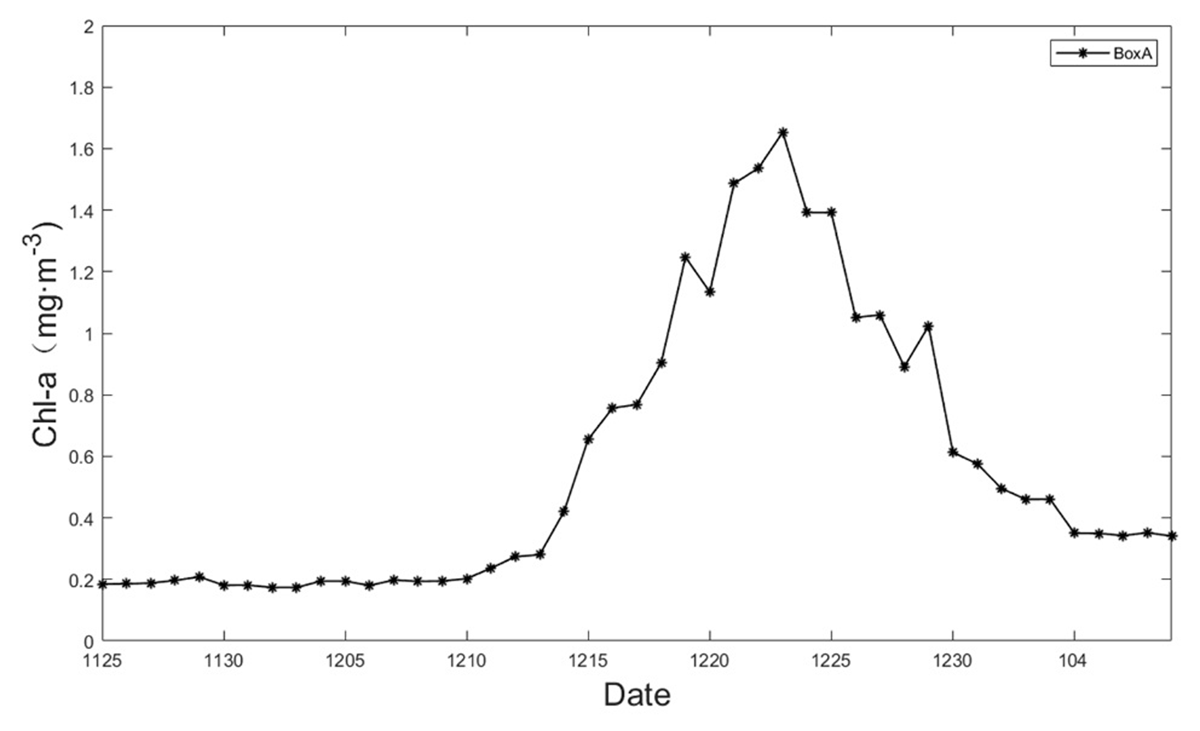
Figure 6
Time series of daily averaged Chl-a in box A from Nov. 25,1998 to Jan. 8,1999. Data: CMEMS 2022, http://marine.copernicus.eu/.
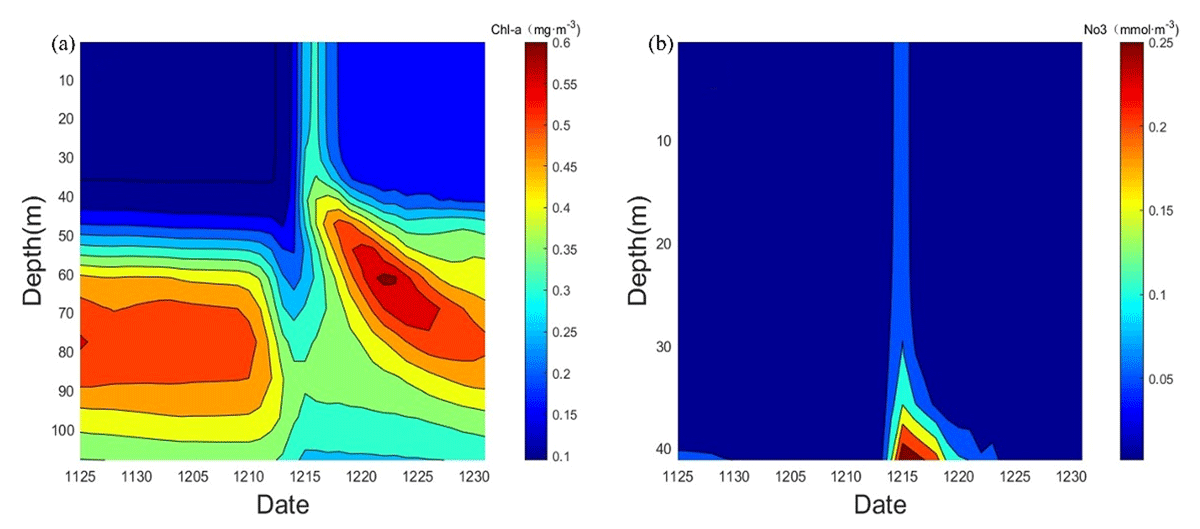
Figure 7
A time series of the spatially averaged concentration of Chl-a (Figure 7a), nitrate (Figure 7b) with depth in box A from Nov. 25 to Dec.31. Data: CMEMS 2022, http://marine.copernicus.eu/.
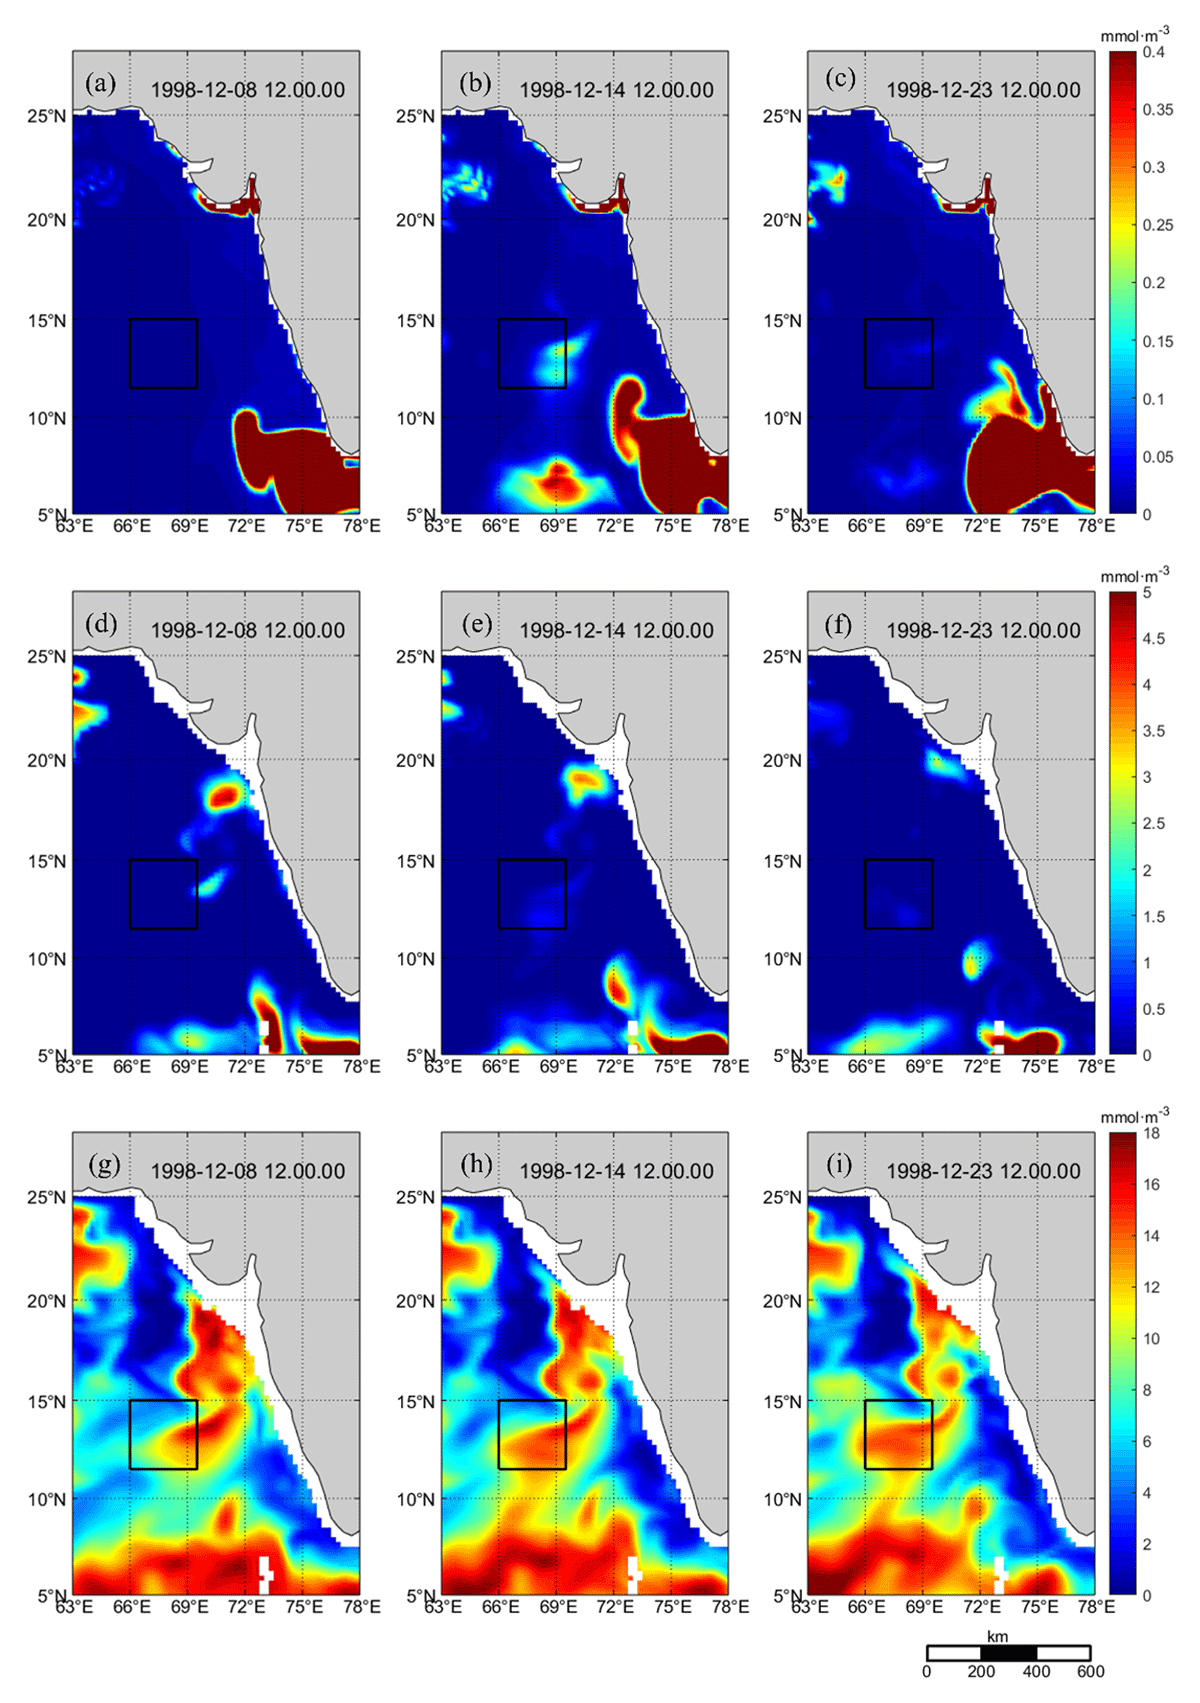
Figure 8
The nitrate concentrations at different depths with z = –0.5 m, –41 m and –77.6 m marked as (a, b, c), (d, e, f), (g, h, i) respectively. Data: CMEMS 2022, http://marine.copernicus.eu/.
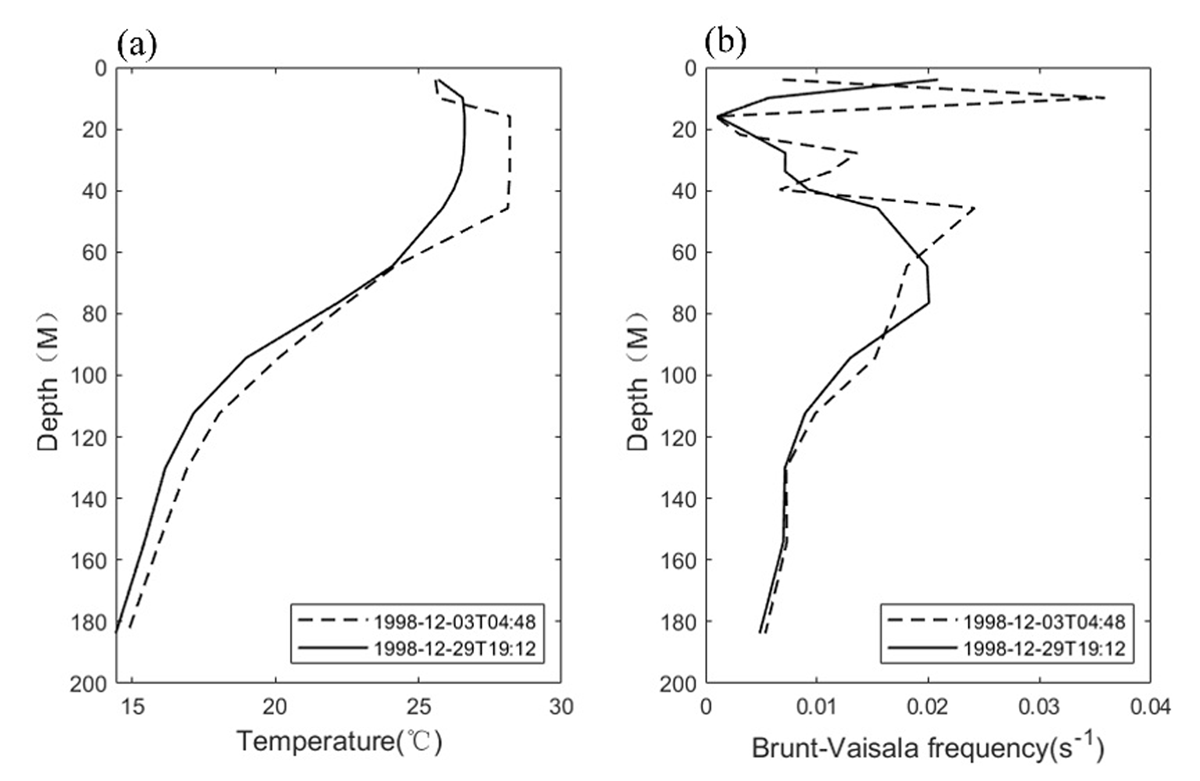
Figure 9
Vertical profiles of temperature and buoyancy frequency from floats before and after the passage of the tropical cyclone. Data: World Ocean Circulation Experiment (WOCE), https://doi.pangaea.de/10.1594/PANGAEA.725481/.
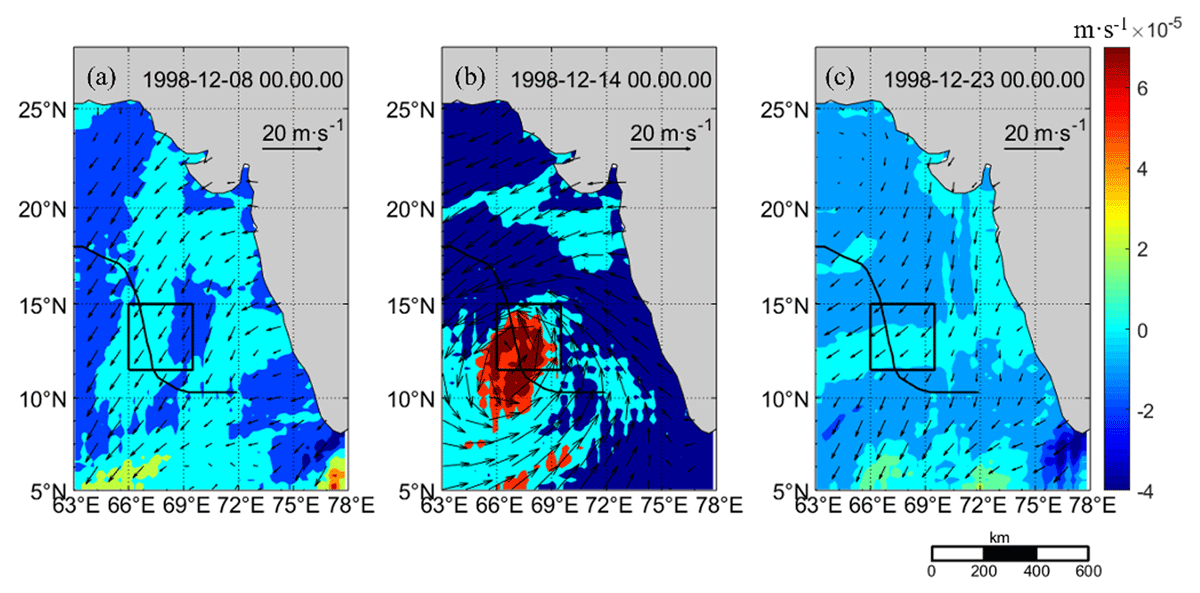
Figure 10
Surface wind speed (arrows) and EPV (colors) during the passage of the tropical cyclone. Data: CMEMS 2022, http://marine.copernicus.eu/.
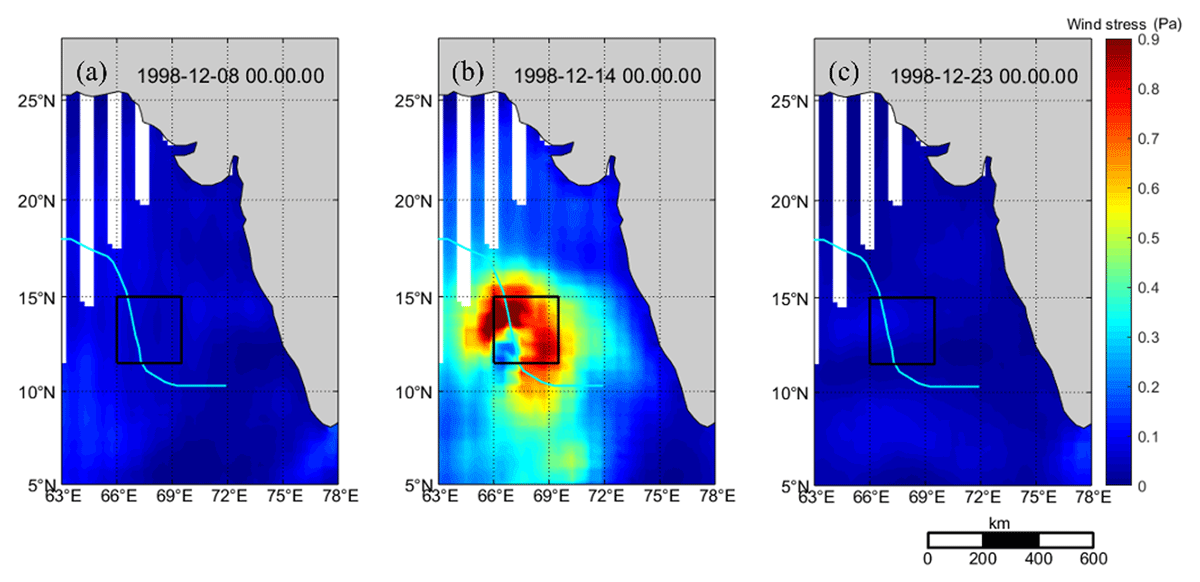
Figure 11
Wind stress (Pa) on Dec.8, Dec.14 and Dec.23. Data: CMEMS 2022, http://marine.copernicus.eu/.
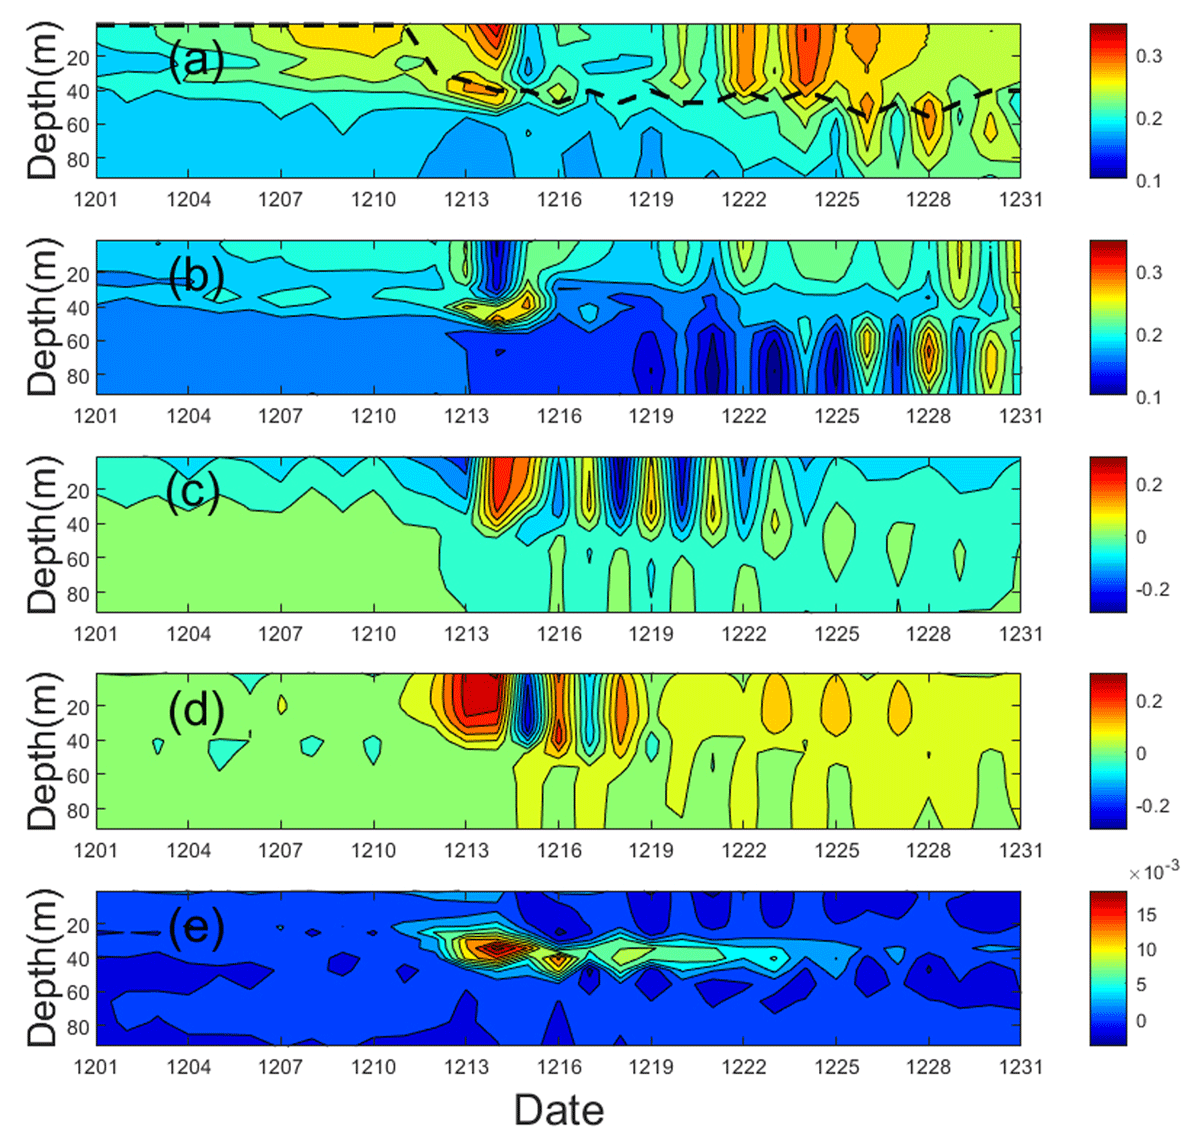
Figure 12
A time series of the spatially averaged positive vorticity (s–1) (a), the spatially averaged negative vorticity (absolute value) (s–1) (b), spatially averaged meridional current (m·s–1) (c), spatially averaged zonal current (m·s–1) (d), spatially averaged VCS (s–1) (e) with depth in box A from Dec.01 to Dec.31. The dotted lines in a indicate the depth of the strongest VCS. Data: CMEMS 2022, http://marine.copernicus.eu/.
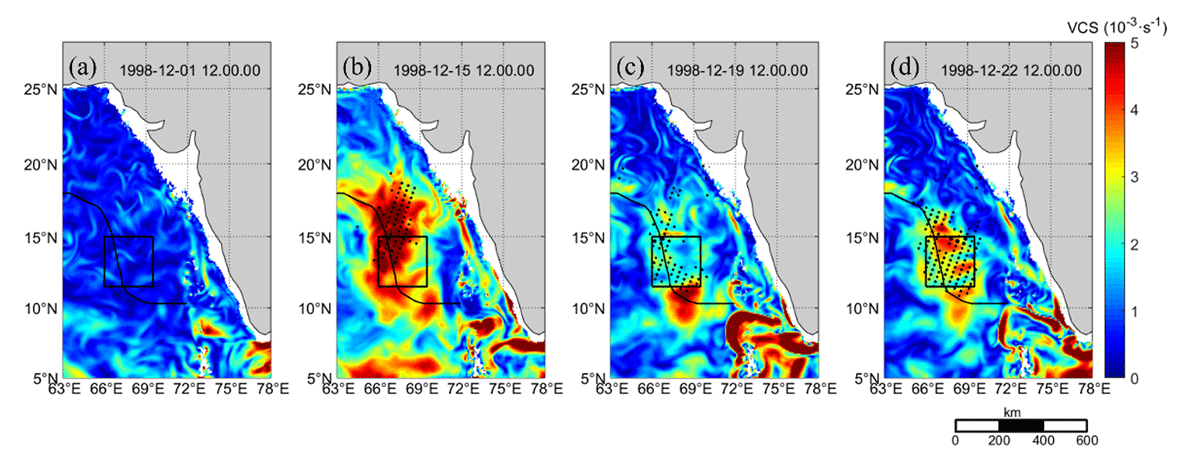
Figure 13
VCS (10–3·s–1) on Dec.01, Dec.15,Dec.19 and Dec.22. The black dots represent the distribution of Chl-a (>1 mg·m –3) the next day. Data: CMEMS 2022, http://marine.copernicus.eu/.