
Table 1
Overview of the sampling procedure and response rates in 2013, 2015 and 2017. As 30 or 40 surveys were printed for each vessel and some vessels did not participate in the survey, the response rates are calculated from the vessels returning any surveys at all, and assumes an average actual crewing of 20 crewmembers.
| 2013 | 2015 | 2017 | Total | |
|---|---|---|---|---|
| Vessels invited | 62 | 37 | 58 | 157 |
| Vessels responded | 49 | 27 | 34 | 110 |
| Surveys distributed | 1860 | 1110 | 1780 | 4750 |
| Valid surveys returned | 832 | 447 | 543 | 1822 |
| Response rate for included ships | 85% | 83% | 80% | 83% |
Table 2
Sample characteristics in percentages across the three data collections.
| Year | 2013 | 2015 | 2017 |
|---|---|---|---|
| Scandinavian nationality | 86 | 91.4 | 92.9 |
| Captains | 7.4 | 7.5 | 9.2 |
| Vessel function | |||
| Emergency preparedness | 21.6 | 27.3 | 20.5 |
| Supply | 67.2 | 58.6 | 65.1 |
| Anchor handling | 11.2 | 14.2 | 14.4 |
| Age category | |||
| Under 26 years | 20.3 | 24.8 | 15.1 |
| 26–30 years | 16.1 | 14.5 | 14.4 |
| 31–35 years | 10.8 | 11.4 | 12.9 |
| 36–40 years | 11.3 | 10 | 8.4 |
| 41–45 years | 12.3 | 9.8 | 10.4 |
| 46–50 years | 9.7 | 9.8 | 13.8 |
| 51–55 years | 10.5 | 7.6 | 8.9 |
| Over 55 years | 9.1 | 12.1 | 16.2 |
| Employment relationship | |||
| Permanent | 86.1 | 86.8 | 82.2 |
| Temporary | 4.7 | 3.4 | 9 |
| Apprentice | 9.2 | 9.8 | 8.8 |
| Seniority | |||
| 0–2 years | 47.3 | 33.9 | 18 |
| 3–5 years | 24.8 | 29 | 26.3 |
| 6–10 years | 16.8 | 26.1 | 30 |
| 11–20 years | 8.3 | 8.9 | 20.5 |
| More than 20 years | 2.7 | 2.2 | 5.2 |
| Department | |||
| Bridge | 31 | 31.1 | 28.7 |
| Deck | 34.4 | 35.7 | 36.1 |
| Engine room | 27.6 | 28.2 | 29.1 |
| Galley | 6.7 | 4.5 | 6.2 |
Table 3
Results from one-way regressions testing pre-registered hypotheses.
| 2013 mean (SD) | 2015 mean (SD) | 2017 mean (SD) | df | F | p | Eta square | |
|---|---|---|---|---|---|---|---|
| H1a: ‘Safety climate’ will increase | 4.151 (0.616) | 4.154 (0.598) | 4.164 (0.745) | (2, 1820) | 0.06 | 0.938 | <0.001 |
| H1a1: ‘Safety climate’ for captain will increase | 4.277 (0.682) | 4.268 (0.656) | NA | (1, 1288) | 0.06 | 0.811 | <0.001 |
| H1a1: ‘Safety climate’ for ship-owner will increase | 4.05 (0.738) | 4.108 (0.68) | NA | (1, 1280) | 1.9 | 0.169 | 0.009 |
| H1a1: ‘Safety climate’ for client will increase | 4.113 (0.709) | 4.067 (0.719) | NA | (1, 1274) | 1.2 | 0.273 | 0.007 |
| H1a2: Six ‘Safety climate’ items will increase | 4.072 (0.701) | 4.066 (0.684) | 4.164 (0.745) | (2, 1823) | 3.37 | 0.035 | 0.004 |
| H1b: ‘Safety focus’ will increase | 4.266 (0.610) | 4.275 (0.585) | 4.303 (0.595) | (2, 1821) | 0.66 | 0.052 | <0.001 |
| H1c: ‘Safety attitude’ will increase | 4.033 (0.803) | 3.717 (0.653) | 3.9 (0.652) | (2, 1814) | 27.69 | <0.001 | 0.03 |
| H1d: ‘Reporting attitude’ will increase | 3.836 (0.875) | 3.11 (0.564) | 3.79 (0.796) | (2, 1805) | 134.68 | <0.001 | 0.13 |
| H2: ‘Job insecurity’ will increase | 1.876 (0.667) | NA | 2.24 (0.729) | (1, 1372) | 89 | <0.001 | 0.0609 |
| H21: ‘Fear of losing job’ items will increase | 2.066 (0.922) | NA | 2.999 (1.171) | (1, 1371) | 271 | <0.001 | 0.165 |
[i] Note: All displayed p values are two-tailed. Bonferroni post-hoc group comparison for H1a2 showed that the six-item SC approached being higher in 2017 than it was in 2013 (p = 0.055) and in 2015 (p = 0.092). Bonferroni post-hoc group comparison for H1c showed that ‘Safe attitude’ was lower in 2013 than it was in 2015 and in 2017 (p < 0.001 and p = 0.003), and 2017 was significantly higher than in 2015 (p < 0.001). Bonferroni post-hoc group comparison for H1d showed that ‘Reporting attitude’ was lower in 2015 than in 2013 (p < 0.001), and higher in 2017 than in 2015 (p < 0.001, all post-hoc tests two-tailed).
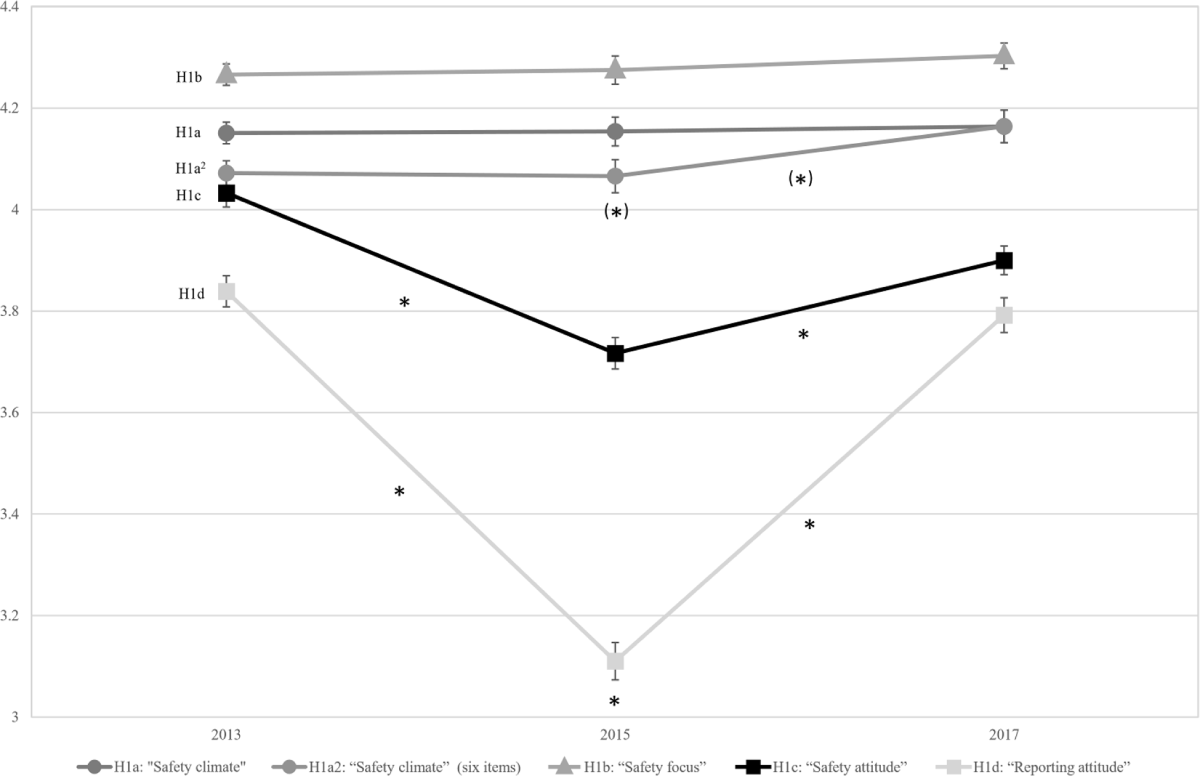
Figure 1
Change in safety climate and attitude over time. Figure 1 shows means and standard deviations for self-reported safety variables across three measurement points. Error bars show standard error of mean. Significant differences between the first and second, second and third, or first and third measurement points at p < 0.05 (using two-tailed Bonferroni post-hoc testing) are indicated with a star, while a parenthesized star indicates p-values significant when applying one-tailed testing as described in the pre-registration.