
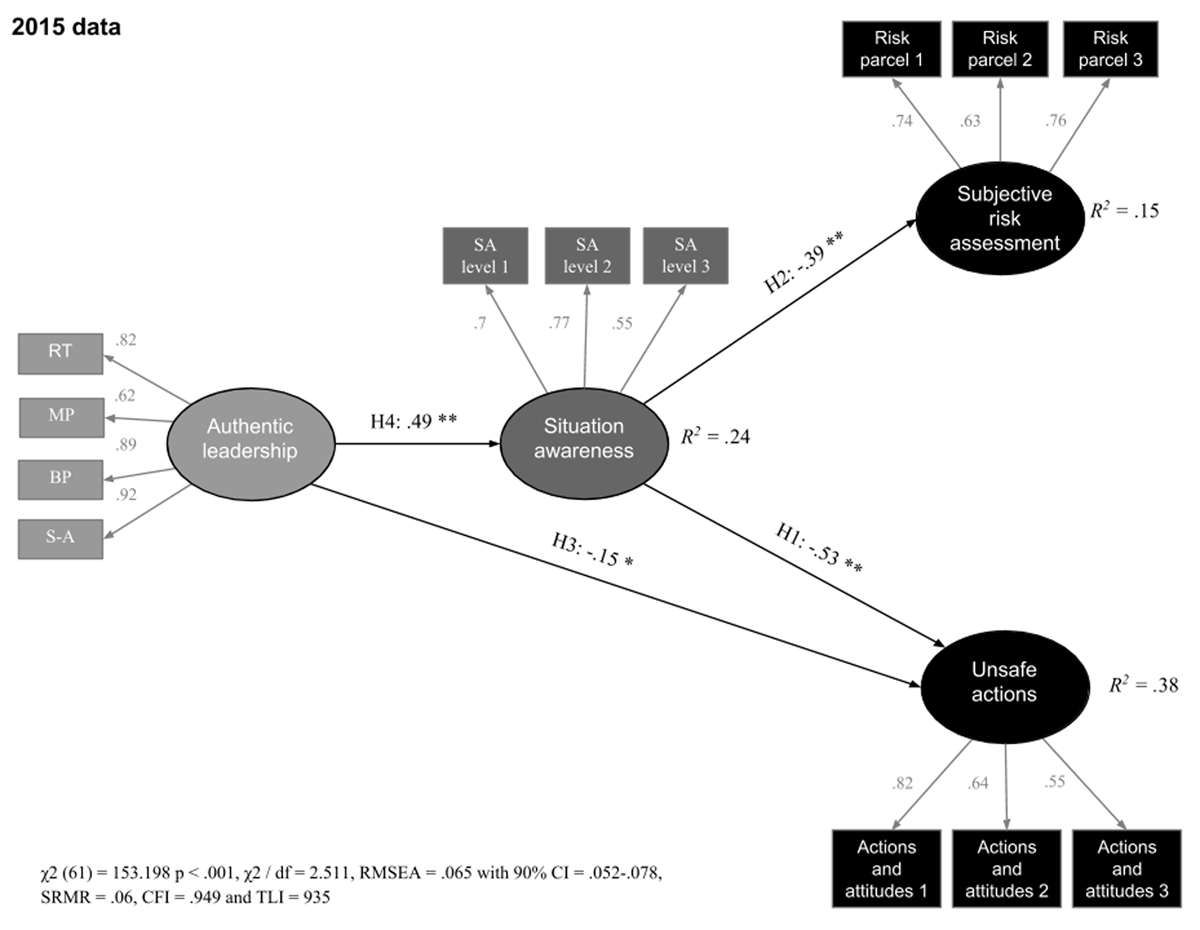
Figure 1
Standardized coefficients for the preregistered structural model on the 2015 dataset. Factor loadings marked with ** are significant at p < 0.001, while the H3 association marked with * is significant at p = 0.02 (one-tailed).
Table 1
Demographic information about the 2015 and 2017 datasets. The 2013 dataset from the replicated study (Sætrevik & Hystad, 2017) is included for comparison.
| 2013 dataset | 2015 dataset | 2017 dataset | |
|---|---|---|---|
| Nordic nationality | 92.5% | 88.9% | 92.2% |
| Age over 35 years | 52.7% | 49.3% | 57.6% |
| Over 5 years of experience | 31.2% | 36.8% | 59.1% |
| Supply vessel | 66.5% | 57.9% | 61.2% |
| Emergency preparedness vessel | 20.4% | 27.5% | 24.5% |
| Anchor handling vessel | 11.2% | 13.6% | 14.3% |
| Bridge | 30.6% | 30.7% | 28.5% |
| Deck | 34.3% | 36% | 35% |
| Engine room | 28% | 28.3% | 29.3% |
| Permanent employment | 85.6% | 87% | 82.1% |
Table 2
Correlation matrix of the variables involved in the analytical model for the 2015 dataset. All shown correlations are significant at p < 0.001.
| Authentic leadership | Situation awareness | Subjective risk | Unsafe actions | |
|---|---|---|---|---|
| Authentic leadership | 1 | |||
| Situation awareness | 0.3290** | 1 | ||
| Subjective risk | –0.1079** | –0.2484** | 1 | |
| Unsafe actions | –0.3021** | –0.4224** | 0.2147** | 1 |
Table 3
Correlation matrix of the variables involved in the analytical model for the 2017 dataset. All shown correlations are significant at p < 0.001.
| Situation awareness | Subjective risk | Unsafe actions | |
|---|---|---|---|
| Situation awareness | 1 | ||
| Subjective risk | –0.2200** | 1 | |
| Unsafe actions | –0.3940** | 0.2555** | 1 |
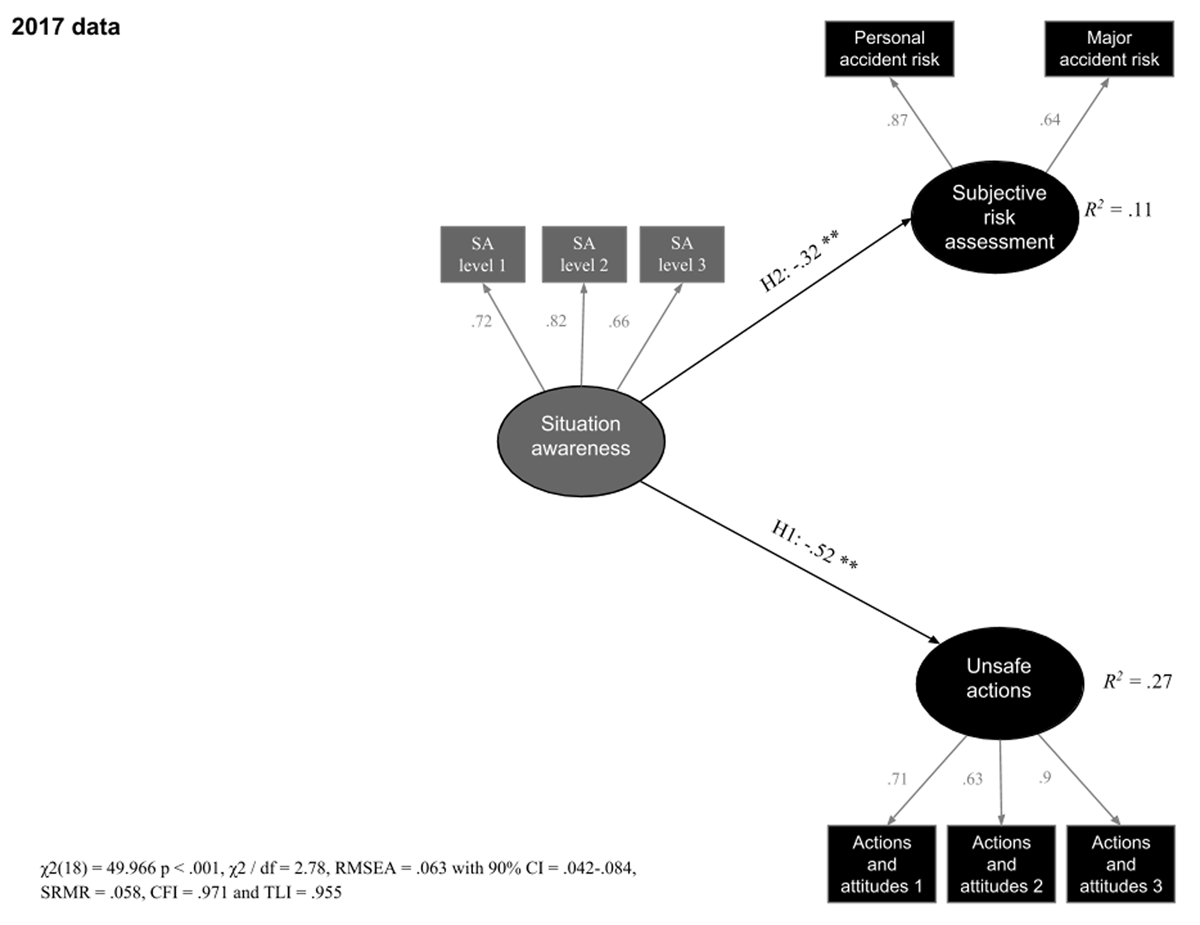
Figure 2
Standardized coefficients for the preregistered structural model on the 2017 dataset. Both factor loadings are marked with ** to indicate significance at p < 0.001.